Thingsboard: Digital Gauges Not Refreshing with Telemetry Data
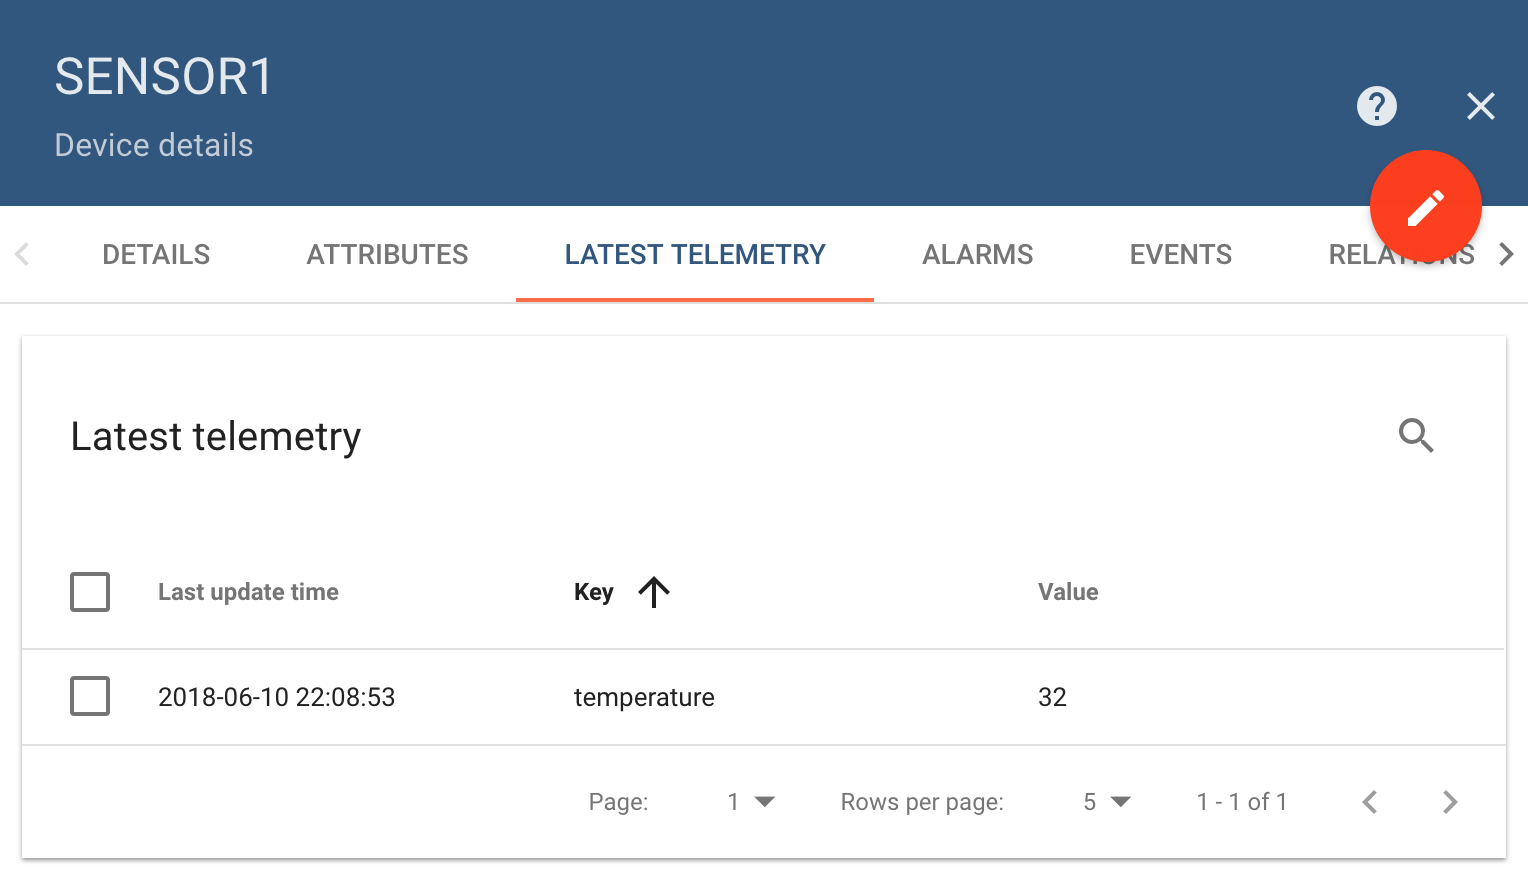
I am continuously publishing temperature data to a device and I can see the temperature data visible in the device Latest Telemetry tab correctly and it is continuously updating.
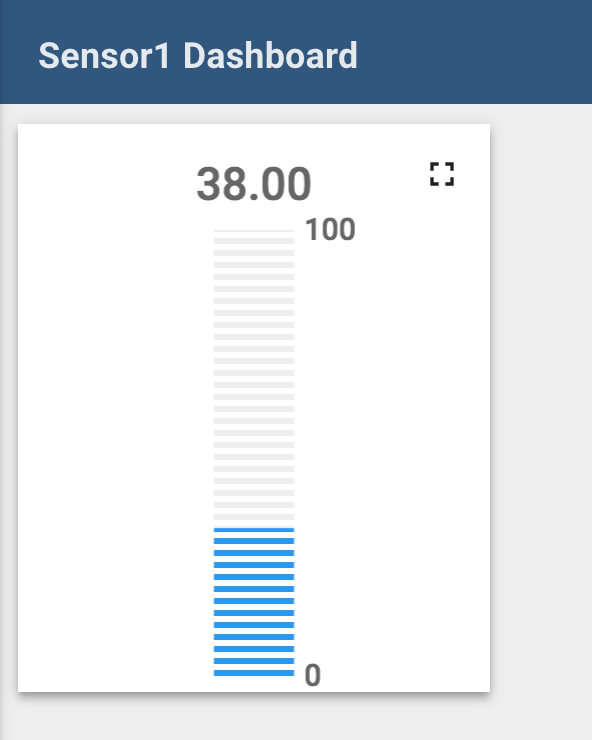
When I visualize the same telemetry data on a dashboard using a digital gauge, then the telemetry data is not updating and the Digital gauge looks frozen.
I am attaching the screen shots of both Latest Telemetry tab and the dashboard containing digital gauge, the digital gauge numerical value does not change as per the telemetry data.
Your help is highly appreciated.
Thanks,
Nitin Ware
 nitinware
All 21 comments
@nitinware Will you please share browser logs
 adityaba
on 11 Jun 2018
adityaba
on 11 Jun 2018
@adityaba - I am using chrome browser and I see these log statements in the browser developer console.
You are using the ngTouch module.
Angular Material already has mobile click, tap, and swipe support...
ngTouch is not supported with Angular Material!
(anonymous) @ angular.js:13920
angular.js:13920 <md-backdrop> may not work properly in a scrolled, static-positioned parent container.
Is it possible that you send value using string data type instead of numeric data type?
For example "38.1" instead of 38.1
 vparomskiy
on 12 Jun 2018
vparomskiy
on 12 Jun 2018
@vparomskiy - I am sending the temperature data as string, please check the below python script which I am using to publish telemetry to thingsboard.
Below is a sample message generated by below python script -
{"temperature":"30"}
import paho.mqtt.client as mqtt
from time import sleep
import random

broker="test.mosquitto.org"
topic_pub='v1/devices/me/telemetry'

client = mqtt.Client()

client.username_pw_set("*************")
client.connect('127.0.0.1', 1883, 1)

while True:
    x = random.randrange(30, 40)
    print(x)
    msg = '{"temperature":"'+ str(x) + '"}'
    client.publish(topic_pub, msg)
    sleep(0.1)
@vparomskiy - I would like to add more information that the Digital Gauge is frozen and not refreshing when it is non-edit mode on dashboard, but when I try to edit the digital gauge then I can see the Digital Gauge values changing background of edit window. I am attaching the gify screen shot of the same.
nitinware
on 13 Jun 2018
Thank you for details. You are right, it is a bug in a gauges widget. Updates are visible in this widget, but value not updated properly.
In other widgets, for example in 'charts', it works as expected.
We will fix this.
vparomskiy
on 13 Jun 2018
@vparomskiy Hi. I'm having exactly the same problem with a timeseries flot. When i open the dashboard, the values are refreshed, but stay frozen at that values. And don't refresh with the new ones when i'm in edit mode. Tried in Chromium (RPI) and Firefox, but the problem is the same. To get the new ones, i need to refresh the page or change timewindow value to a different one and update. Same log in develoer console as @nitinware have:
"You are using the ngTouch module.
Angular Material already has mobile click, tap, and swipe support...
ngTouch is not supported with Angular Material!
 Neuromystix
on 19 Jun 2018
Neuromystix
on 19 Jun 2018
This issue already resolved in master, but not released yet.
As a workaround, you can decrease data submission rate. It is reproduced only when submission rate is higher than 1 per 2 seconds.
vparomskiy
on 19 Jun 2018
Ok, i'll wait for the master, not a big deal right now ;)
My submission rate is 20 seconds, so it shouldn't happen. Checked with a timeseries table, also happening.
Neuromystix
on 19 Jun 2018
@Neuromystix also could you write what time window is configured for time series flot. Is it realtime or history?
vparomskiy
on 20 Jun 2018
All widgets was using "dashboard timewindow", with "realtime". Didn't tried to check history. It was a fresh 2.0.3 install, running in a RPi3 which received data from a sensor, each 20 seconds. It was working fine with an old 1.4 version (had some problems with RPi SD card, so i've done a clean install).
Neuromystix
on 20 Jun 2018
Fix already available. Closing this issue.
vparomskiy
on 5 Feb 2019
Nope, I still have the issue in the latest release of Thingsboard : 2.3.0. I am using the docker image tb-postgres. Digital gauges aren't refreshing, analog gauges are.
 bachrc
on 18 Feb 2019
bachrc
on 18 Feb 2019
@vparomskiy @bachrc
I can also confirm the digital gauge widgets are not refreshing properly however the analog widgets are correct. The graphical part of the digital gauge appears to update correctly, just the numerical value does not. Also all widgets refresh correctly if I reload the web page or while in edit mode. Dashboard is set to realtime at 1 sec and data is sent at once a sec via mqtt. I'm using docker v2.3.0 tb-cassandra.
 lepgithub
on 31 Mar 2019
lepgithub
on 31 Mar 2019
is the issue already solved? having the same problem. Where can get the latest solution for this issue? thank you.
 amirNoob89
on 5 Apr 2019
amirNoob89
on 5 Apr 2019
I hope a patch will be available in the 2.4.0, because it is really annoying. @vparomskiy could you open again this issue ?
bachrc
on 6 Apr 2019
I'm still having this with digital widget refreshing too. Some of my digital widgets refresh and others do not. Data uploads are every 10 minutes.
 adambforbes
on 4 May 2019
adambforbes
on 4 May 2019
@adambforbes Try disabling animation under Edit Widget Advance. It worked for me, value is now accurate.
lepgithub
on 4 May 2019
That seemed to fix it. Thank you!
adambforbes
on 4 May 2019
I still have the issue.....
 ecmap
on 25 Apr 2020
ecmap
on 25 Apr 2020
tb-postgress docker ver. 2.4.3 same issue
 goboras
on 12 May 2020
goboras
on 12 May 2020
Related issues
 fotis400
·
18Comments
fotis400
·
18Comments
 affoltep
·
29Comments
affoltep
·
29Comments
 mfalkvidd
·
16Comments
mfalkvidd
·
16Comments
 openedhardware
·
24Comments
fotis400
·
14Comments
openedhardware
·
24Comments
fotis400
·
14Comments
Most helpful comment
@adambforbes Try disabling animation under Edit Widget Advance. It worked for me, value is now accurate.