Scratch-gui: Apparent resource leak in Edge
Expected Behavior
Scratch 3.0 can be used in MS Edge for extended editing sessions.
Actual Behavior
After editing a project for a while (5-20 minutes), Edge's memory usage climbs to about 4 GB and then the Scratch 3.0 tab becomes unresponsive. The rest of Edge, including the close-tab button, is sometimes also unresponsive.
Steps to Reproduce
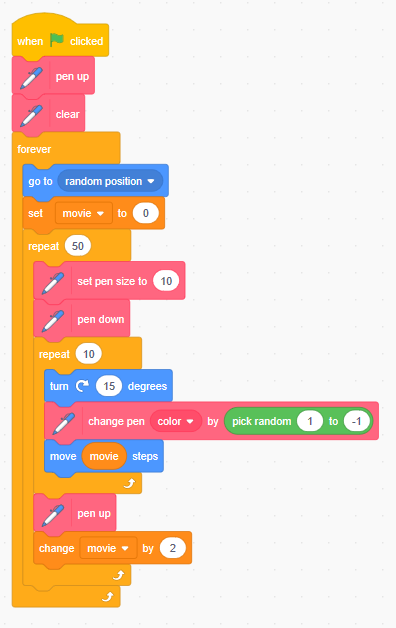
Build a non-trivial project in Scratch 3.0 using Edge. For example, I built a small pen-based program to generate a Sierpinski triangle using two stacks of 10-15 blocks each.
Operating System and Browser
Version 10.0.15063
Microsoft Edge 40.15063.674.0
 cwillisf
All 11 comments
@fsih, do you think you have time for this? If not, I'll work on it after LLK/scratch-render#24.
cwillisf
on 16 Jan 2018
I can look after LLK/scratch-paint/issues/255
 fsih
on 16 Jan 2018
fsih
on 16 Jan 2018
It's a race! ;)
cwillisf
on 16 Jan 2018
@cwillisf I wasn't able to reproduce a memory leak. I did find
- Edge starts right off using ~1GB (compare to 42MB on Chrome on Windows) and stays pretty steady
- Absurdly laggy when drawing with pen
I will try to look into why it's using that much memory
Here is the little program I made to test. Do you remember using any other blocks in particular that might have been the culprit?
fsih
on 17 Jan 2018
I might have found something? The memory usage seems to climb every time I refresh the page.
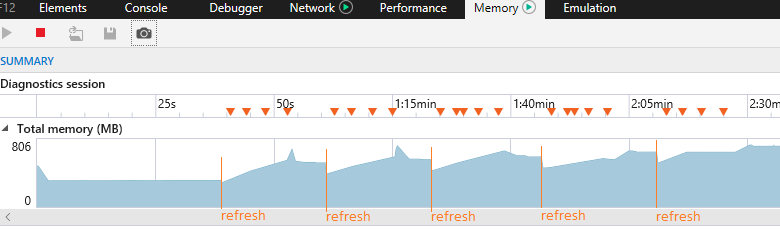
Financial analysts call this the sharks-climbing-each-other pattern
fsih
on 17 Jan 2018
This might be relevant:
https://developer.microsoft.com/en-us/microsoft-edge/platform/issues/8992678/
Unfortunately the heap analysis in Edge only gets ahold of 30MB of memory usage. See https://connect.microsoft.com/IE/feedback/details/2270279/why-is-ie11-total-memory-so-much-larger-than-heap-snapshot-size which implies that the rest might be garbage-collectable but not getting collected. I haven't had any luck finding tools to analyze the contents of the 1GB and not just what's in the heap snapshot.
fsih
on 17 Jan 2018
I tried rebuilding my Sierpinski project in Edge while running the heap profiler. Results below...
First off, this is how far I got before it froze. I had just inserted the "set {my variable}" block into the loop:

I noticed that it took a while (most of a second, maybe?) to open up a spot to drop the "set {my variable}" block into. This corresponds to the first "mountain" on the memory profile image below.
When I dropped the block, this caused the second "mountain" on the graph. The tab then froze ("llk.github.io is not responding" message from the browser).
Here's the visualizer on the memory profiler:

Unfortunately I've been unable to save a heap snapshot so far, but maybe this is enough info to go on? @rachel-fenichel & friends, any thoughts?
cwillisf
on 17 Jan 2018
Hi friends!
My first thought is to attempt to repro this in the scratch-blocks playground. If you don't have that set up locally, you can use the hosted one.
Can one of you poke at that and let me know what you find?
 rachel-fenichel
on 17 Jan 2018
rachel-fenichel
on 17 Jan 2018
I did my best to recreate the program in the vertical playground (there don't seem to be custom blocks or extensions) and still wasn't able to repro :/
On the bright side, cool! There's a hosted blocks playground!
Going to take myself off this bug for now, since I haven't been able to repro
fsih
on 18 Jan 2018
After discussion with @thisandagain we're going to treat this as a performance issue and address it as part of a later milestone.
For what it's worth, I have also been unable to repro this in the scratch-blocks playground. My guess is that it's either in the GUI (React) layer or in the VM.
cwillisf
on 26 Jan 2018
I'm not seeing this on Edge 41.16299.15.0. I do think that it became much less responsive with the memory profiler turned on, though.
 BryceLTaylor
on 4 Apr 2018
BryceLTaylor
on 4 Apr 2018
Related issues
 ericrosenbaum
·
3Comments
ericrosenbaum
·
3Comments
 apple502j
·
4Comments
apple502j
·
4Comments
 cyx2015s
·
4Comments
cyx2015s
·
4Comments
 davidaylaian
·
4Comments
davidaylaian
·
4Comments
 thisandagain
·
3Comments
thisandagain
·
3Comments
Most helpful comment
It's a race! ;)