Pfelk: any chance you can include pfblocker ng in the roadmap?
Hi guys, appreciate your project development, is there any chance you can include pfblocker ng dashboards? Thank you
 myrsecurity
All 45 comments
@myrsecurity - Although I utilize OPNsense and Unbound (similar to pfBlocker capability)... I'm open to expanding. Please provide some raw pfblocker ng logs and I'll build out a filter for you to test, help develop and implement. Next, I can assist in building out a dashboard.
 a3ilson
on 3 Jan 2021
a3ilson
on 3 Jan 2021
@revere521 - any chance you utilize pfBlocker ng?
a3ilson
on 3 Jan 2021
I would like to integrate the PFBloquer NG, how could I help you?
 themendas
on 3 Jan 2021
themendas
on 3 Jan 2021
@themendas - excellent and thank you! Forgive me up front as I am unfamiliar with the specifics of pfblockerng and how they are currently logged but would need the original log message.
Based on a quick search, it appears that the logs are stored locally. The first thing we’ll need to do is devise a means to extract and or send the logs remotely.
i don’t currently have pfsense installed... ill fired up a virtual instance and dabble a bit with it later today but any help would be greatly appreciated.
a3ilson
on 3 Jan 2021
I also have pfblocker ng setup, but only for dnsbl filtering.
It looks like the internal logging for dnsbl logs to /var/log/pfblockerng/* and you can not ship that logging somewhere else in the settings.
So you would need to setup syslog NG to read the logs where they are, then ship them somewhere else.
If its setup with IP based blocking (rather than DNS resolution filtering), which is an alternative, that appears to create firewall rules instead - so those might be already being delivered to pfELK and just not yet parsed.
I can help with copy/paste of dnsbl outputs for a grok, but I'm not sure about setting up syslog ng to forward the logging... that might take a bit to figure out.
 revere521
on 3 Jan 2021
revere521
on 3 Jan 2021
That's what I concluded after reading and researching the topic...they should already be logged within the firewall rules. The only thing required would be to filter based on those rules.
Essentially, from what I understand, the service simply blocks and curious as to the benefit...if they were already logged within the firewall rules. What would be the value in knowing that you received logs informing you an IP address is blocked?
a3ilson
on 3 Jan 2021
I think the ask is really to move the dashboards that pfblocker provides inside pfsense itself to pfELK..
Basically with dns based blocking (inside pfsense) i can see what LAN IP's are attempting to reach ad sites / analytics sites / potential malware sites and how often. It does log data like that, but that's speaking only from the dns side
This is what that looks like:
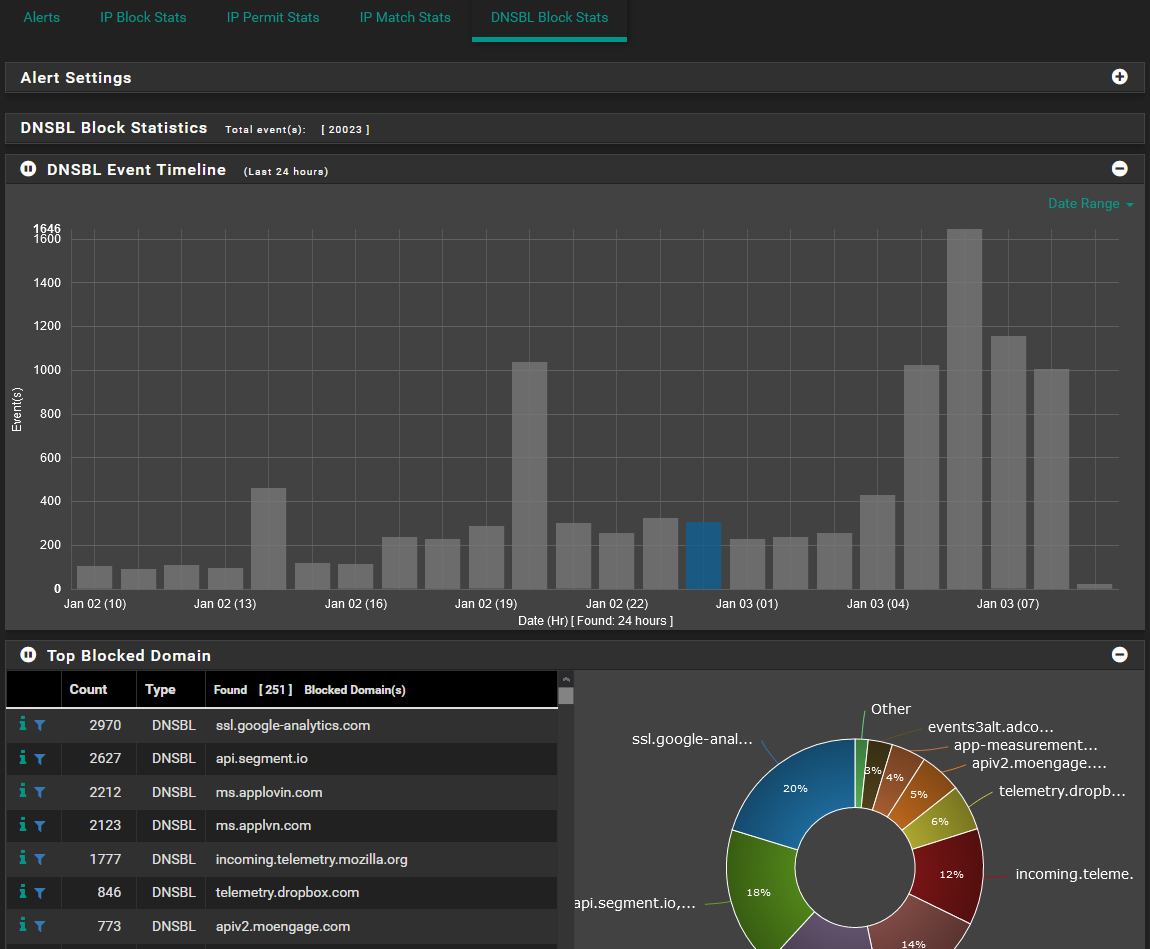
For IP based filtering - looks like it internally tallies IP Block, Pass and Match based on rules and actions you have setup in some similar dash-boarding, but I'd need someone else to display what they have (I don't use the IP based filtering because its it caused too many issues on my home network.)
I guess the value is the same as for DNS based filtering - knowing if there are problem devices on the network that are spamming telemetry sites, phoning home all the time - or possibly being malicious
revere521
on 3 Jan 2021
@revere521 - Gotcha...and I believe it is doable but will need the logs to build out a grok pattern and dashboard.
a3ilson
on 3 Jan 2021
@myrsecurity - Added a project but will need assistance in building this out (yours and others) which will correlate to the rate in which this is accomplished.
a3ilson
on 3 Jan 2021
Indeed, the blocking losgs are defined in firewall.log, which are sent as filterlog, the only thing that would open it was to define the rule number to which it refers. The truth is that it is a bit convoluted.
example block rule PFBloquer-NG:
Jan 3 20:04:13 | TRANS_DUNE | pfB_Top_v4 auto rule (1770004081) | 194.156.124.92:44247 | xx.xx.xx.xx:443 | TCP:S
RuleName: pfb_top_v4
Roule ID: 1770004081
Message Elastic Discover:
@timestamp | Jan 3, 2021 @ 20:07:34.145
| @version | 1
| _id | Pd-lyXYBAuK6lTvYyTLY
| _index | pfelk-firewall-2021.01
| _score | -
| _type | _doc
| destination.geo.continent_code | EU
| destination.geo.country_code3 | ES
| destination.geo.country_iso_code | ES
| destination.geo.country_name | Spain
| destination.geo.ip | xx.xx.xx.xx
| destination.geo.latitude | 40,417
| destination.geo.location | { "lat": 40.4172, "lon": -3.684 }
| destination.geo.longitude | -3,684
| destination.geo.timezone | Europe/Madrid
| destination.ip | xx.xx.xx.xx
| destination.port | 443
| ecs.version | 1.7.0
| event.action | block
| event.created | Jan 3, 2021 @ 21:07:34.000
| event.reason | match
| interface.alias | TRANS2
| interface.name | re1
| log.original | <134>Jan 3 20:07:34 filterlog: 62,,,1770004081,re1,match,block,in,4,0x0,,113,41311,0,DF,6,tcp,48,84.54.57.139,xx.xx.xx.xx,9845,443,0,S,3057096707,,42340,,mss;nop;nop;sackOK
| log.syslog.priority | 134
| network.direction | in
| network.iana_number | 6
| network.name | Transito_Dune
| network.transport | tcp
| network.type | 4
| observer.ip | xx.xx.xx.xx
| observer.name |
| observer.product | PFSENSE
| observer.serial_number | 001
| observer.type | firewall
| pf.ipv4.flags | DF
| pf.ipv4.offset | 0
| pf.ipv4.packet.id | 41.311
| pf.ipv4.tos | 0x0
| pf.ipv4.ttl | 113
| pf.packet.length | 48
| pf.tcp.flags | S
| pf.tcp.options | mss, nop, nop, sackOK
| pf.tcp.sequence_number | 3.057.096.707
| pf.tcp.window | 42.340
| pf.transport.data_length | 0
| process.name | filterlog
| rule.ruleset | 62
| rule.uuid | 1770004081
| source.geo.continent_code | AS
| source.geo.country_code3 | CN
| source.geo.country_iso_code | CN
| source.geo.country_name | China
| source.geo.ip | 84.54.57.139
| source.geo.latitude | 34,773
| source.geo.location | { "lat": 34.7725, "lon": 113.7266 }
| source.geo.longitude | 113,727
| source.geo.timezone | Asia/Shanghai
| source.ip | 84.54.57.139
| source.port | 9.845
| tags | pf, _geoip_lookup_failure, GeoIP_Source, GeoIP_Destination
themendas
on 3 Jan 2021
@themendas - Thanks! The log looks to be the same with the only distinguisher being the rule.
I am confident we could enrich this particular data set and devise a dashboard or dashboard option to specifically depict the dataset. However, the rule numbers will be unique for each instance. Luckily, @ShagoY built a solution for that here. Once the rule name is added (enriched) to the related log, we can filter/enrich pfblocker-ng data assuming the rule name is consistent or has consistency. Based on what you provided, I assume that all pfblocker-ng rule names are pfb_top_v4 or pfb_top_v6 - can you confirm?
Below is what will be needed to mimic the pfblocker stats (e.g. see screenshot provided by @revere521 above)
- [ ] pfblocker-ng installed with logging enabled (seems to be default)
- [ ] Utilization of rule descriptions
- This optional addition will be required
- [ ] DSN lookup as it doesn't appear to be included in the remote log
Questions:
- Does syslog-ng provide additional pfblocker-ng details
- Does pfSense 2.5.0 logging options provide additional context
a3ilson
on 5 Jan 2021
Hi,
Yes, the names of the records would be those among others;
- pfb_top_v4 auto rule
- pfb_top_v6 auto rule
- pfb_DNSBLIP auto rule
- pfb_ "name of manual rule" auto rule
In syslog, just provide update log
I still do not know what version 2.5.0 does, I have not been able to test it yet, although knowing that it has the same pfbloquer package, I imagine it will do the same.
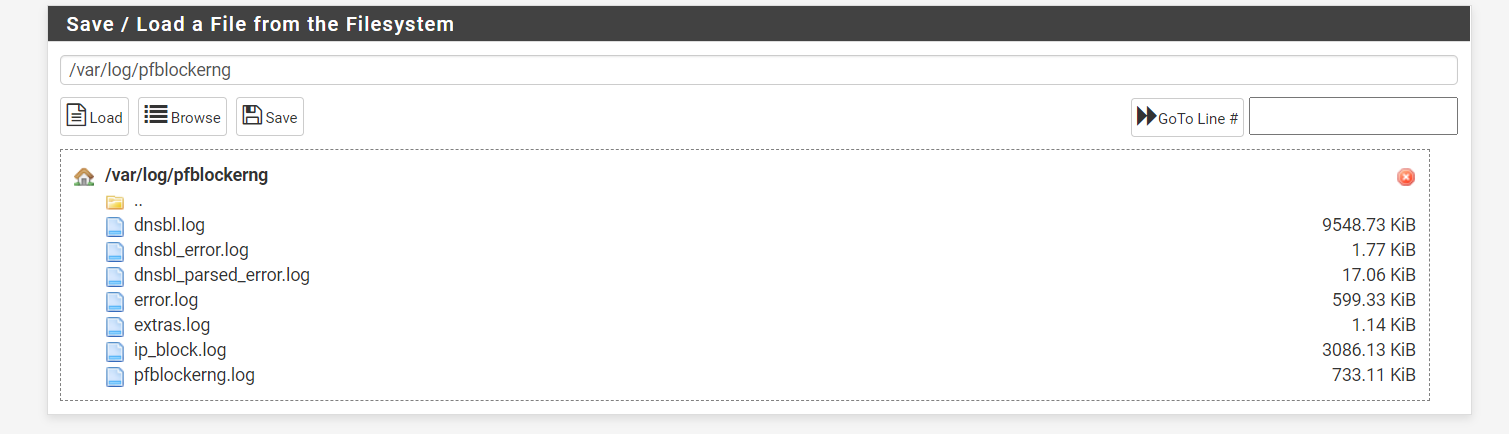
The log files that pfbloquer generates, to enter them even manually are the following:
Pfbloquerng.log (information on the update process by crontab)
error.log (errors in the update process)
dnsbl.log (this is the only one that gives information about the matches, with dates, domains, and protocol)
extras.log (GeoIP update process)
maxmind-view
themendas
on 6 Jan 2021
Gotcha -
A few thoughts...
- We could potentially leverage the firewall events/logs since they are already being sent, enriching the data to mimic the current pfblocker dashboard?
- This would require the utilization of the rule description script generator
or
- We would send the dnsbl.log to pfelk for enrichment and visualization
- Could you provide an example of the dnsbl.log format (i.e. 5-15 sanitized entries)
a3ilson
on 6 Jan 2021
@a3ilson I just saw that the command link uses my fork, can you please change it? :)
 ShagoY
on 7 Jan 2021
ShagoY
on 7 Jan 2021
@a3ilson I just saw that the command link uses my fork, can you please change it? :)
Thanks/updated
a3ilson
on 7 Jan 2021
So here are a few thoughts and questions:
- [ ] Does syslog-ng have the capability to export pfBlocker-ng logs
- can someone running pfSense confirm this
if the above yields another dead end, the following is feasible based on this repo
- [ ] Install telegraf (plugin available for pfSense or OPNsense)
- Configure for pfelk ==> will build out if/as needed
- Configure for pfBlocker-NG
- Configure for system metrics
a3ilson
on 17 Jan 2021
Attached is a guide based on how suricata is sent from pfsense via syslog-ng. I modified it for pfblocker-ng but need someone to test if it'll work...Once configured and since there isn’t any filter built with pfelk, no data will be processed nor sent to elasticsearch. However, we can test to see if this will send the logs remotley which it should. To do this, I would recommend changing the port to something else (e.g. 5055). Then we can run a tcpdump of the instance where pfelk is installed (e.g. sudo tcpdump -vvv -A -i any port 5055 > pfblocker.tcp).
I'll need some raw log files from the TCP dump to build and devlope the grok pattern...once developed, we can build visulizations.
a3ilson
on 19 Jan 2021
@a3ilson per gitter discussion I sent tcp dump file for review...
 Apex-Heavy
on 27 Jan 2021
Apex-Heavy
on 27 Jan 2021
@Apex-Heavy - Sorry for the delay...just saw this. I have not received the updated TCP file.
a3ilson
on 8 Feb 2021
Added as a project but need/require collaboration to develop and mature.
a3ilson
on 17 Feb 2021
hello a3ilson !
can i help on this project ?? i'm using pfblocker-ng too
 mrahmatellah
on 23 Mar 2021
mrahmatellah
on 23 Mar 2021
@mrahmatellah - certainly! Help is always appreciated. I do not utilize pfSense but willing to help. The first piece is obtaining logs from pfSense via syslog-ng
a3ilson
on 23 Mar 2021
@a3ilson Ok i will extract logs,
and send it
mrahmatellah
on 24 Mar 2021
@a3ilson would you like the (log file) of pfblocker ? i can send you this today
i found signiant log on dnsbl.log & ip_block.log
mrahmatellah
on 20 Apr 2021
@mrahmatellah - that would be appreciated but need to figure out solution to send the log. I do not utilize pfSense but syslog-ng should be able to send that log remotely for enrichment/incorporation into pfelk.
1 - Send pfblocker log to remote server
2 - enriched log for utilization with pfelk
a3ilson
on 20 Apr 2021
@a3ilson, i will try this on my virtual lab,
give you soon an update (if i meet problems with syslog-ng, i will tell you)
mrahmatellah
on 22 Apr 2021
@3ilson i need your help im not familiar with syslog-ng,
I have tried to send logs from pfsense to a remote log but i meet error syntax, can you help ?
the goal is to send pfblocker logs from pfsense using syslog-ng
i have follow https://github.com/pfelk/pfelk/wiki/How-To:-Suricata-on-pfSense, but on source we need just to send a file dnsbl.log and ip_block.log located on /var/log/pfblockerng
mrahmatellah
on 8 May 2021
Can you provide the errors? Are the logs being sent?
a3ilson
on 11 May 2021
Hello Andrew, i will work on it this evening.
Finally last week, i was able to do it, i have to take back what i have done.
Best
mrahmatellah
on 25 May 2021
Attached is a guide based on how suricata is sent from pfsense via syslog-ng. I modified it for pfblocker-ng but need someone to test if it'll work...Once configured and since there isn’t any filter built with pfelk, no data will be processed nor sent to elasticsearch. However, we can test to see if this will send the logs remotley which it should. To do this, I would recommend changing the port to something else (e.g. 5055). Then we can run a tcpdump of the instance where pfelk is installed (e.g. sudo tcpdump -vvv -A -i any port 5055 > pfblocker.tcp).
I'll need some raw log files from the TCP dump to build and devlope the grok pattern...once developed, we can build visulizations.
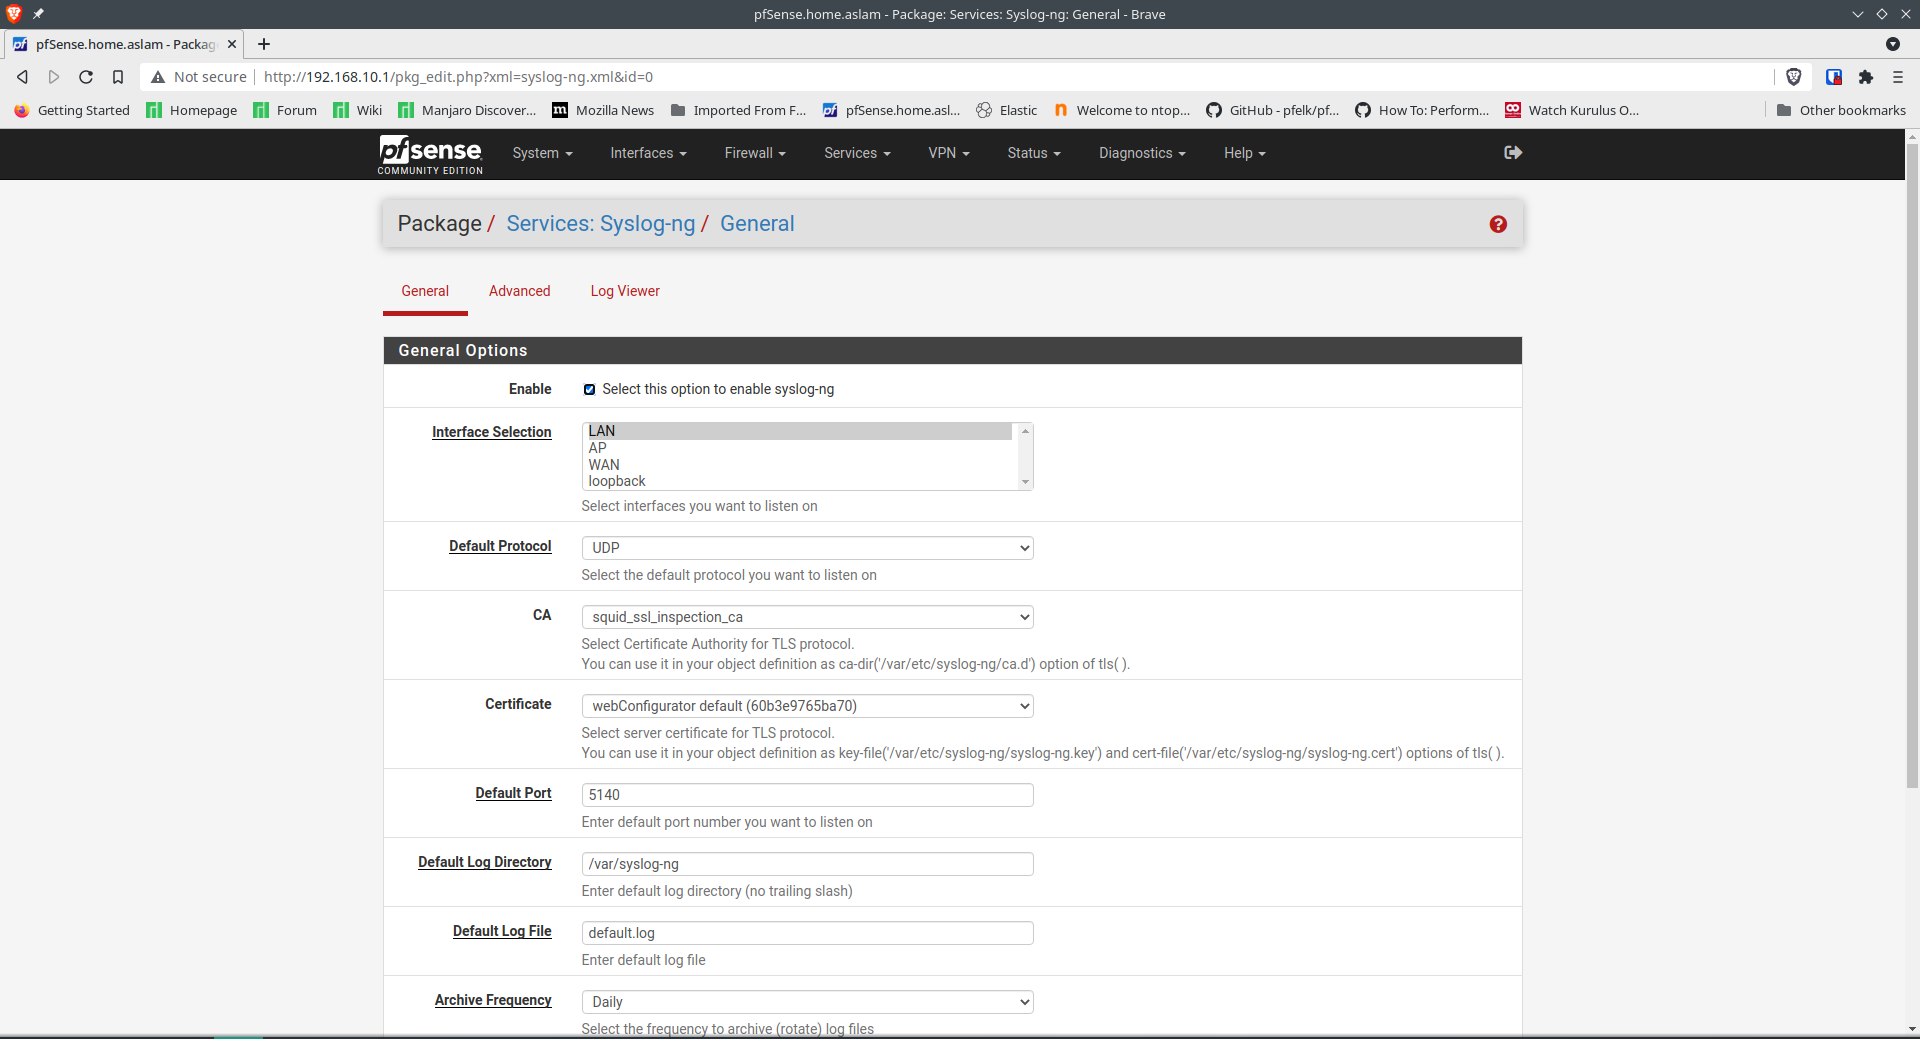
Hello @a3ilson. I am a user of PFsense that may be able to help, I have pfELK in a Debian Server VM currently, today or tomorrow I will try to send the tcpdump, I just need to setup syslogng first. Do you mean change the port in the syslogng "Destination" object parameters?
 yusi1
on 14 Jun 2021
yusi1
on 14 Jun 2021
I don't know if I set up syslogng wrong but I am receiving these errors:
Jun 14 09:21:56 pfSense syslog-ng[20004]: Error resolving hostname with getaddrinfo(); host='debian.local', error='8', error_str='Name does not resolve'
Jun 14 09:21:56 pfSense syslog-ng[20004]: Initiating connection failed, reconnecting; time_reopen='60'
Jun 14 09:22:56 pfSense syslog-ng[20004]: Current failover server is inaccessible, sending the messages to the next failover server; next_failover_server='192.168.10.16', location='/usr/local/etc/syslog-ng.conf:5:2'
Jun 14 09:22:56 pfSense syslog-ng[20004]: Syslog connection failed; fd='22', server='AF_INET(192.168.10.16:5055)', error='Connection refused (61)', time_reopen='60'
yusi1
on 14 Jun 2021
Here's a picture of the menu for syslogng, in case I did something wrong:
yusi1
on 14 Jun 2021
@yusi1 have you tried using udp? Is the ELK listing on the specified port? Maybe make a tcpdump on the elk Server for this port to see if something is coming in
 maof97
on 14 Jun 2021
maof97
on 14 Jun 2021
Yes @maof97, thank you, you fixed the issue. The problem was that logstash wasn't running and the syslogng config had the wrong port on it, I am now using port 5140 for syslogng and it says that the connection was established. Should I change the logstash listening port like @a3ilson said above, or should I just capture right now? The relevant lines in /etc/pfelk/conf.d/01-input.conf use udp on port 5140, so I will stick with that I guess. Sry for the inconvenience, I am a beginner at the ELK stack in general.
yusi1
on 14 Jun 2021
Never change a running system ;)
No for real, you can change the port to the one you like, it’s just important to change them on both ends (01-inputs config and SyslogNG config).
A tcpdump now on the ELK host and/or a packet capture on Pfsense would be the next step. tcpdump port 5140
maof97
on 14 Jun 2021
@maof97, this is what I will do now, thanks
yusi1
on 14 Jun 2021
Also, for some reason it has trouble resolving the hostname of the ELK server, but not the ip:
Jun 14 15:38:26 pfSense syslog-ng[4915]: Error resolving hostname with getaddrinfo(); host='debian.local', error='8', error_str='Name does not resolve'
Jun 14 15:39:26 pfSense syslog-ng[4915]: Syslog connection established; fd='22', server='AF_INET(192.168.10.16:5140)', local='AF_INET(0.0.0.0:0)'
yusi1
on 14 Jun 2021
@yusi1 Does the domain actually resolve to your ELK server IP? (nslookup debian.local)
maof97
on 14 Jun 2021
It seems it doesn't:
(output of nslookup debian.local)
** server can't find debian.local: NXDOMAIN
yusi1
on 14 Jun 2021
@yusi1 Ok then either make a DNS entry in your DNS resolver or just use the IP directly. I think you have this debian.local from the example right? You are supposed to use your servers domain here if you have one.
maof97
on 14 Jun 2021
@maof97, yeah I used the example hostname, I think I will use the ip then, the ip gets resolved anyway as a fallback so I guess I won't change the config of syslogng and I also saw packets in pfblocker.tcp on the server. My patience is low today, lol
yusi1
on 14 Jun 2021
I'll just run a few internet adblock tests and stuff for the blocked packets to start coming in aswell
yusi1
on 14 Jun 2021
Ran into another issue, vmware doesn't allow the virtual adapter to go into promiscuous mode, so I can't even capture packets lol now I have to fix that as well, I will just have to run vmware as root
yusi1
on 14 Jun 2021
tcpdump doesn't seem to be receiving anything??? Or do I have to wait longer???
Here's a message from the syslogng log that comes up every 10 mins:
Jun 14 17:35:19 pfSense syslog-ng[46357]: Log statistics; processed='destination(_DEFAULT)=5', dropped='global(internal_source)=0', queued='global(internal_source)=0', processed='source(_DEFAULT)=5', processed='global(msg_clones)=0', processed='global(sdata_updates)=0', truncated_bytes='dst.udp(pfblocker#0,udp,debian.local:5055)=0', truncated_count='dst.udp(pfblocker#0,udp,debian.local:5055)=0', processed='global(payload_reallocs)=0', dropped='dst.udp(pfblocker#0,udp,debian.local:5055)=0', processed='dst.udp(pfblocker#0,udp,debian.local:5055)=0', queued='dst.udp(pfblocker#0,udp,debian.local:5055)=0', written='dst.udp(pfblocker#0,udp,debian.local:5055)=0', processed='center(queued)=5', processed='destination(pfblocker)=0', queued='global(scratch_buffers_count)=0', processed='src.internal(_DEFAULT#0)=5', stamp='src.internal(_DEFAULT#0)=1623688039', processed='source(pfblocker)=0', processed='center(received)=5', processed='global(internal_queue_length)=0', queued='global(scratch_buffers_bytes)=0'
BTW, I changed the logstash and syslogng dest ports to 5055 for debugging, it didn't do anything, no packets received again.
yusi1
on 14 Jun 2021
What does the packet capture in Pfsense reveal?
maof97
on 14 Jun 2021
Related issues
 InvokerFury
·
20Comments
InvokerFury
·
20Comments
 ledge39
·
7Comments
myrsecurity
·
12Comments
ledge39
·
7Comments
myrsecurity
·
12Comments
 wylde780
·
12Comments
wylde780
·
12Comments
 vakarthik
·
11Comments
vakarthik
·
11Comments