Pfelk: Most of the dashboard no longer gets data
Looks like a number of the fields have changed causing issues with a large portion of the dashboard. Also the path to the GeoIP db files wasn't /usr/share/GeoIP for my install it was /var/lib/GeoIP/.
Thanks

 wylde780
All 12 comments
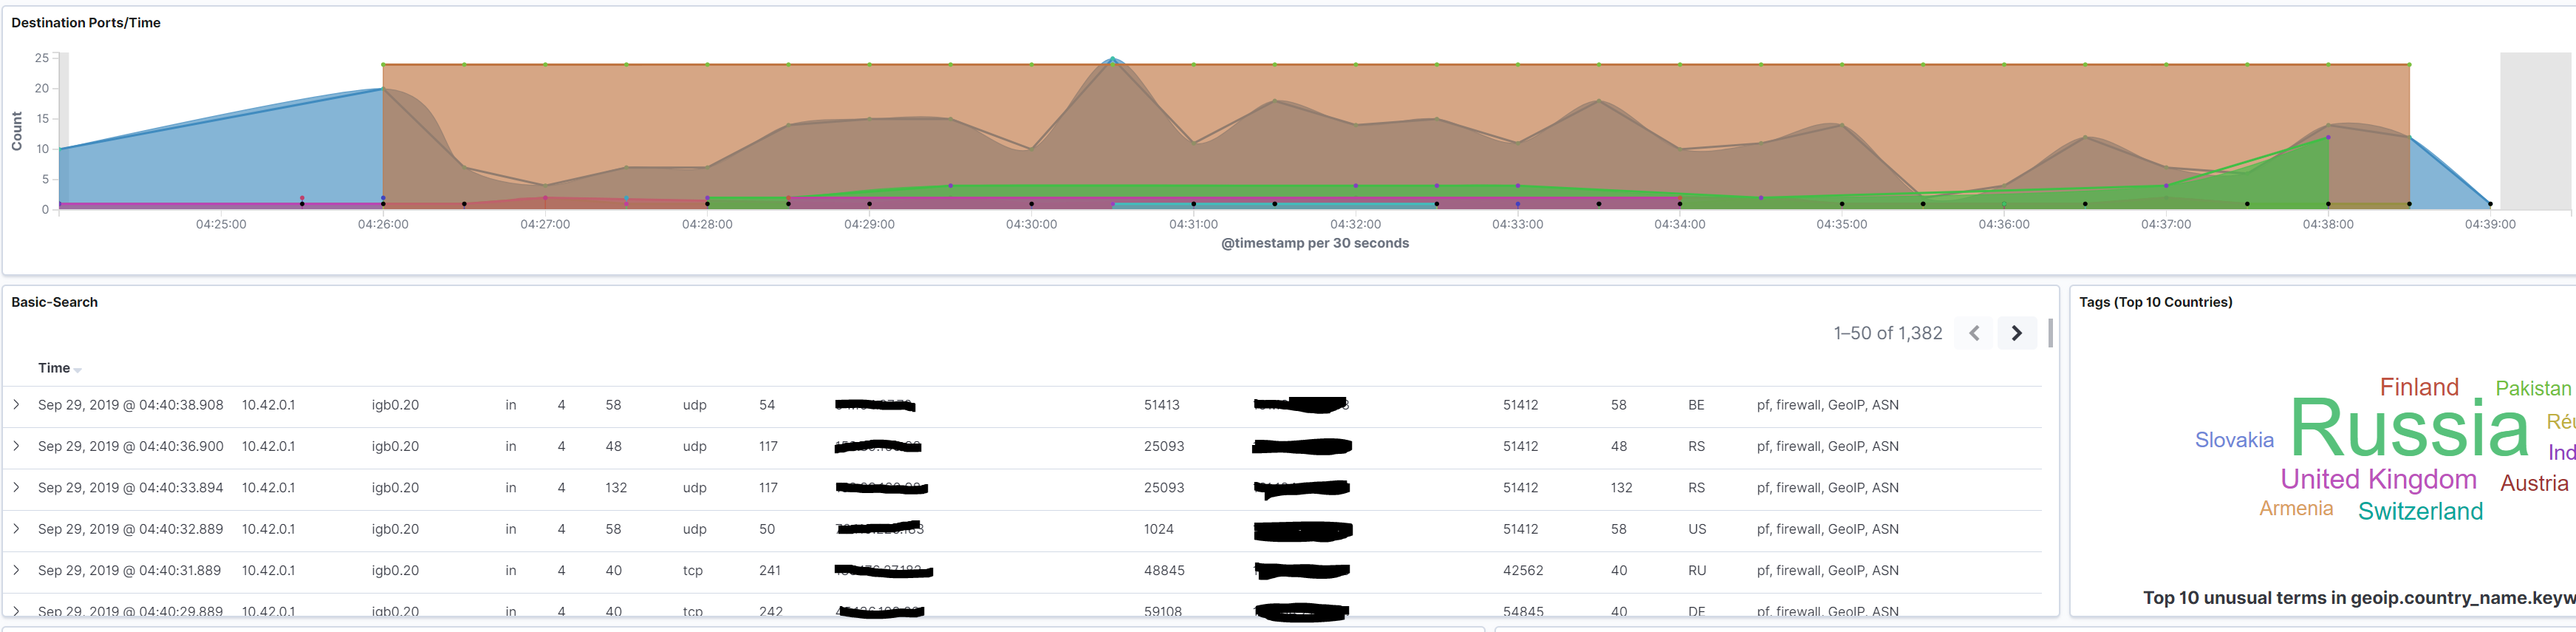
So I found the issue and started to do a search / replace on the json file for the fields but now the headers have disappeared from the basic-search visualization. I'm not sure how I go about fixing this without doing it in a slow and painful way of search and replacing each field name one at a time. So I'm hoping you'll be able to post a new .json before I muster up the energy to do it.
wylde780
on 29 Sep 2019
I'll re-create the search, visualization and dashboard. I wanted to make sure all the fields were kosher first.
 a3ilson
on 29 Sep 2019
a3ilson
on 29 Sep 2019
Yesterday I've followed the guide to setup opnsense+pfelk it somewhat worked. Now I updated changed files and most of dashboards stopped working, Surricata one didn't work at all. No suricata count, maps or other panels. It's complaining it's missing index-pattern-filed ids_sig_id.keyword. Dashboard dashboard is also missing lots of data today. Since updating grok file i'm also getting this error:
tags:pf, _grokparsefailure @timestamp:Sep 29, 2019 @ 14:38:26.682 type:syslog host:192.168.0.1 message:%{msg} @version:1 _id:9usHfW0BMMBUkIkLgUkN _type:_doc _index:pf-2019.09.29 _score: -
 xpliz
on 29 Sep 2019
xpliz
on 29 Sep 2019
@XplizitBe
I am in the process of updated the GeoIP data to conform with ECS. Once corrected, I'll update the dashboards.
-Andrew
a3ilson
on 29 Sep 2019
Yesterday I've followed the guide to setup opnsense+pfelk it somewhat worked. Now I updated changed files and most of dashboards stopped working, Surricata one didn't work at all. No suricata count, maps or other panels. It's complaining it's missing index-pattern-filed ids_sig_id.keyword. Dashboard dashboard is also missing lots of data today. Since updating grok file i'm also getting this error:
tags:pf, _grokparsefailure @timestamp:Sep 29, 2019 @ 14:38:26.682 type:syslog host:192.168.0.1 message:%{msg} @version:1 _id:9usHfW0BMMBUkIkLgUkN _type:_doc _index:pf-2019.09.29 _score: -
Just to clarify, your dashboards are not working but if you go to "Discover" is it working? Can you post a screenshot.
a3ilson
on 29 Sep 2019
Just to clarify, your dashboards are not working but if you go to "Discover" is it working? Can you post a screenshot.
Sure. Check lines 5, 6 of discover - this happens with todays updated grok. Also did screenshots of dashboards. And error that is always present with suricata visuals.
Maybe I should say I'm runing latest ELK stack on Ubuntu 18.04 LTS built in VM on 28.09.2019
xpliz
on 29 Sep 2019
Updated the Dashboard....However, I'll need to install and tinker a bit with Suricata.
I'm also working to get the GeoIP to map correctly....but have not made any progress...shelving for another day.
a3ilson
on 29 Sep 2019
I was trying different commits every now and then, some with more some with less success. I'll have to wait and try to help with any debugging needed. Now latest -1 commit just has no surricata at al. But I think geoip is somewhat working.
xpliz
on 30 Sep 2019
I rarely get any suricate hits and didn’t spend much time debugging. When I get
more time (November) I’ll configure some simple rules and finish tweaking
the suricate portion.
Feel free to send any progress and I’ll help when possible - thanks!
Andrew
On Sun, Sep 29, 2019 at 21:18 xplizit notifications@github.com wrote:
I was trying different commits every now and then, some with more some
with less success. I'll have to wait and try to help with any debugging
needed. Now latest -1 commit just has no surricata at al. But I think geoip
is somewhat working.—
You are receiving this because you were assigned.
Reply to this email directly, view it on GitHub
https://github.com/a3ilson/pfelk/issues/34?email_source=notifications&email_token=AEA2HR5QDMZMTVDFECLYSTLQMFHUVA5CNFSM4I3Q7ER2YY3PNVWWK3TUL52HS4DFVREXG43VMVBW63LNMVXHJKTDN5WW2ZLOORPWSZGOD74EIMY#issuecomment-536364083,
or mute the thread
https://github.com/notifications/unsubscribe-auth/AEA2HR5TLISNHCV35VVSV2TQMFHUVANCNFSM4I3Q7ERQ
.
a3ilson
on 30 Sep 2019
opened under a new issue, issue #42
a3ilson
on 10 Oct 2019
i'm still getting this issue with the new dashboard templates. Most of the fields specified by the visualisations don't seem to exist from my opnsense logs that have been gathered. Any ideas? When I add pf* Index Pattern I only have 24 fields, but when I add the dashboard template it adds another pf-* Index pattern with 134 fields. Any help would be appreciated.
 jameski83
on 8 Dec 2019
jameski83
on 8 Dec 2019
Check the 10-pf.conf file and make sure you have the right grim pattern set
(competed out). But default it is set to pfsense.
On Sun, Dec 8, 2019 at 12:49 jameski83 notifications@github.com wrote:
i'm still getting this issue with the new dashboard templates. Most of the
fields specified by the visualisations don't seem to exist from my opnsense
logs that have been gathered. Any ideas? When I add pf* Index Pattern I
only have 24 fields, but when I add the dashboard template it adds another
pf-* Index pattern with 134 fields. Any help would be appreciated.—
You are receiving this because you modified the open/close state.
Reply to this email directly, view it on GitHub
https://github.com/a3ilson/pfelk/issues/34?email_source=notifications&email_token=AEA2HR4X6OAJETPYG3L7LBLQXUXUJA5CNFSM4I3Q7ER2YY3PNVWWK3TUL52HS4DFVREXG43VMVBW63LNMVXHJKTDN5WW2ZLOORPWSZGOEGHE2RA#issuecomment-562974020,
or unsubscribe
https://github.com/notifications/unsubscribe-auth/AEA2HR7TPXV5BBZWI2K4HILQXUXUJANCNFSM4I3Q7ERQ
.
a3ilson
on 8 Dec 2019
Related issues
 fktkrt
·
5Comments
fktkrt
·
5Comments
 squirrelboot
·
12Comments
squirrelboot
·
12Comments
 rrosson
·
14Comments
rrosson
·
14Comments
 vakarthik
·
11Comments
vakarthik
·
11Comments
 maof97
·
14Comments
maof97
·
14Comments