Pfelk: Logstash stopped processing because of an error
Describe the bug
Pfelk sadly never worked for me yet. I found out that the reason is most likely Logstash not starting because of an alleged syntax error.
To Reproduce
I have to say that I want to use pfelk on an already existing ELK stack (mainly for SIEM purposes).
The step to reproduce for me is just to try "systemctl start logstash" => Error
Firewall System (please complete the following information):
- pfSense
- 2.5.0
Operating System (please complete the following information):
Linux 5.8.0-45-generic x86_64
NAME="Ubuntu"
VERSION="20.04.2 LTS (Focal Fossa)"
ID=ubuntu
ID_LIKE=debian
PRETTY_NAME="Ubuntu 20.04.2 LTS"
VERSION_ID="20.04"
HOME_URL="https://www.ubuntu.com/"
SUPPORT_URL="https://help.ubuntu.com/"
BUG_REPORT_URL="https://bugs.launchpad.net/ubuntu/"
PRIVACY_POLICY_URL="https://www.ubuntu.com/legal/terms-and-policies/privacy-policy"
VERSION_CODENAME=focal
UBUNTU_CODENAME=focal
Installation method (manual, ansible-playbook, docker, script):
Tried script at first and it said it worked but actually it basically erased my Kibana.yaml so I replaced it with my old yaml and after that Kibana was accessible again. After that I only followed all manual steps as described here (remote syslog, wgets, Kibana etc.).
Elasticsearch, Logstash, Kibana (please complete the following information):
- Version of ELK components (
dpkg -l [elasticsearch]|[logstash]|[kibana])
 elasticsearch/stable,now 7.11.2 amd64 [installed]
 kibana/stable,now 7.11.2 amd64 [installed]
 logstash/stable 1:7.11.2-1 amd64 [upgradable from: 1:7.11.0-1]
Elasticsearch, Logstash, Kibana logs:
- Elasticsearch logs
```
at org.elasticsearch.common.util.concurrent.ThreadContext$ContextPreservingAbstractRunnable.onFailure(ThreadContext.java:720) [elasticsearch-7.11.2.jar:7.11.2]
at org.elasticsearch.common.util.concurrent.AbstractRunnable.run(AbstractRunnable.java:28) [elasticsearch-7.11.2.jar:7.11.2]
at java.util.concurrent.ThreadPoolExecutor.runWorker(ThreadPoolExecutor.java:1130) [?:?]
at java.util.concurrent.ThreadPoolExecutor$Worker.run(ThreadPoolExecutor.java:630) [?:?]
at java.lang.Thread.run(Thread.java:832) [?:?]
Caused by: org.elasticsearch.action.NoShardAvailableActionException: [fn-node-1][192.168.178.83:9300][indices:data/read/search[phase/query]]
at org.elasticsearch.action.search.AbstractSearchAsyncAction.onShardFailure(AbstractSearchAsyncAction.java:448) ~[elasticsearch-7.11.2.jar:7.11.2]
at org.elasticsearch.action.search.AbstractSearchAsyncAction.onShardFailure(AbstractSearchAsyncAction.java:397) [elasticsearch-7.11.2.jar:7.11.2]
... 18 more
[2021-03-19T22:19:17,993][INFO ][o.e.c.r.a.AllocationService] [fn-node-1] Cluster health status changed from [RED] to [YELLOW] (reason: [shards started [[.kibana_1][0]]]).
(Elasticsearch is working)

 - Logstash logs (`tail -f /var/log/logstash/logstash-plain.log`)
[2021-03-20T00:03:36,291][INFO ][logstash.runner ] Starting Logstash {"logstash.version"=>"7.11.0", "jruby.version"=>"jruby 9.2.13.0 (2.5.7) 2020-08-03 9a89c94bcc OpenJDK 64-Bit Server VM 11.0.8+10 on 11.0.8+10 +indy +jit [linux-x86_64]"}
[2021-03-20T00:03:42,328][ERROR][logstash.agent ] Failed to execute action {:action=>LogStash::PipelineAction::Create/pipeline_id:pfelk, :exception=>"LogStash::ConfigurationError", :message=>"Expected one of [ \t\r\n], "#", "{" at line 26, column 5 (byte 1278) after output {n ################################################################################n ### firewall ###n ################################################################################n if "firewall" in [tags] {n elasticsearch {n hosts => ["http://192.168.178.83:9200"]n index => "pfelk-firewall-%{+YYYY.MM}"n#ILM# ilm_enabled => truen#ILM# ilm_rollover_alias => "pfelk-firewall"n#ILM# ilm_pattern => "000001"n#ILM# ilm_policy => "pfelk-ilm"n#ILM# ecs_compatibility => "v1"n manage_template => falsen ### X-Pack Username and Password ###n user => elasticn password => upsn ", :backtrace=>["/usr/share/logstash/logstash-core/lib/logstash/compiler.rb:32:in compile_imperative'", "org/logstash/execution/AbstractPipelineExt.java:184:ininitialize'", "org/logstash/execution/JavaBasePipelineExt.java:69:in initialize'", "/usr/share/logstash/logstash-core/lib/logstash/java_pipeline.rb:47:ininitialize'", "/usr/share/logstash/logstash-core/lib/logstash/pipeline_action/create.rb:52:in execute'", "/usr/share/logstash/logstash-core/lib/logstash/agent.rb:367:inblock in converge_state'"]}
[2021-03-20T00:03:42,641][INFO ][logstash.agent ] Successfully started Logstash API endpoint {:port=>9600}
[2021-03-20T00:03:47,526][INFO ][logstash.runner ] Logstash shut down.
[2021-03-20T00:03:47,566][FATAL][org.logstash.Logstash ] Logstash stopped processing because of an error: (SystemExit) exit
org.jruby.exceptions.SystemExit: (SystemExit) exit
at org.jruby.RubyKernel.exit(org/jruby/RubyKernel.java:747) ~[jruby-complete-9.2.13.0.jar:?]
at org.jruby.RubyKernel.exit(org/jruby/RubyKernel.java:710) ~[jruby-complete-9.2.13.0.jar:?]
at usr.share.logstash.lib.bootstrap.environment.
(this repeats itself)


**Additional context**
Already made sure with tcpdump that log files are going in:
listening on wg0, link-type RAW (Raw IP), capture size 262144 bytes
00:17:58.958985 IP 10.0.3.254.syslog > localhost.5140: SYSLOG local0.info, length: 187
00:17:58.959020 IP 10.0.3.254.syslog > localhost.5140: SYSLOG local0.info, length: 187
00:18:00.019374 IP 10.0.3.254.syslog > localhost.5140: SYSLOG cron.info, length: 114
00:18:03.965002 IP 10.0.3.254.syslog > localhost.5140: SYSLOG local0.info, length: 187
00:18:03.965290 IP 10.0.3.254.syslog > localhost.5140: SYSLOG local0.info, length: 187
00:18:04.963302 IP 10.0.3.254.syslog > localhost.5140: SYSLOG auth.notice, length: 392
00:18:04.963509 IP 10.0.3.254.syslog > localhost.5140: SYSLOG auth.notice, length: 410
00:18:04.963965 IP 10.0.3.254.syslog > localhost.5140: SYSLOG auth.notice, length: 480
00:18:04.964198 IP 10.0.3.254.syslog > localhost.5140: SYSLOG auth.notice, length: 480
^C85 packets captured
145 packets received by filter
60 packets dropped by kernel
```
Logstash log says its about some syntax error in the grok file, while systmctl says Logstash is "running". I don't know what's going on. I researched everywhere but no luck.
Attach the pfELK Error Log (error.pfelk), for
error.pfelk.log
Better Assistance*
- Do not copy/paste log; attach as a file
 maof97
All 14 comments
I don't know if this is relevant, but I looked at top and found out that Logstash uses 100%+ cpu then about 12% then again 100%+ etc. So it is definitely doing _something_ but I guess it is just restarting over and over again because of the error.
maof97
on 20 Mar 2021
In the logstash error your stack username and password are visible, you may want to redact that.
Also the user has a backslash in it, not sure if logstash balks at things like that, but you may need to escape the backslash with an extra backslash. Just a preliminary thought
[Edit] i was on mobile and mistook the newline marks as a "" in the name - sorry about that
 revere521
on 20 Mar 2021
revere521
on 20 Mar 2021
The error is with syntax in the 50-outputs.conf
it refers specifically to this top section of the file (line 26 column 5) which is the bracket at the bottom of the section below - and its where its supposed to be.
I don't use Xpack, but does the user and pass need to be in quotes here? Either that or try pulling the 50-outputs.conf down again, and configuring it; its balking at that line for some reason.
# 50-outputs.conf
################################################################################
# Version: 21.03                                                               #
# Required: Yes                                                                #
# Description: Sends enriched logs to Elasticsearch. Remove "#ILM#" to enable  #
# ILM                                                                          #
################################################################################
#
output {
  ################################################################################
  ###                               firewall                                   ###
  ################################################################################
  if "firewall" in [tags] {
    elasticsearch {
      hosts => ["http://192.168.178.83:9200"]
      index => "pfelk-firewall-%{+YYYY.MM}"
#ILM#      ilm_enabled => true
#ILM#      ilm_rollover_alias => "pfelk-firewall"
#ILM#      ilm_pattern => "000001"
#ILM#      ilm_policy => "pfelk-ilm"
#ILM#      ecs_compatibility => "v1"
      manage_template => false
      ### X-Pack Username and Password ###
      user => removed
      password => removed
    }
  }
@maof97
Two identified issues:
- You have multiple grok files:
pfelk.grok,pfelk_bckp.grok,openvpn.grok
- if
pfelk_bckp.grokis a backup, recommend you relocate to alternate location, as it is still being referenced and utilized
- if
- as @revere521 indicated, to leverage x-pack (i.e. user and password), you'll need to wrap both within quotations
user => "usernamehere"
password => "supersecretpasswordhere"
Reference: https://www.elastic.co/guide/en/elasticsearch/reference/current/get-started-logstash-user.html
 a3ilson
on 20 Mar 2021
a3ilson
on 20 Mar 2021
Nice thanks it works now!
The only thing missing is the parsing of Suricata alerts. I tried to use the syslog-ng and pfsense own new "syslog" method that is described here. Both didn't work. Which is the way to go?
maof97
on 21 Mar 2021
@maof97 - have you tried following this?
a3ilson
on 21 Mar 2021
@a3ilson yes, step by step
maof97
on 21 Mar 2021
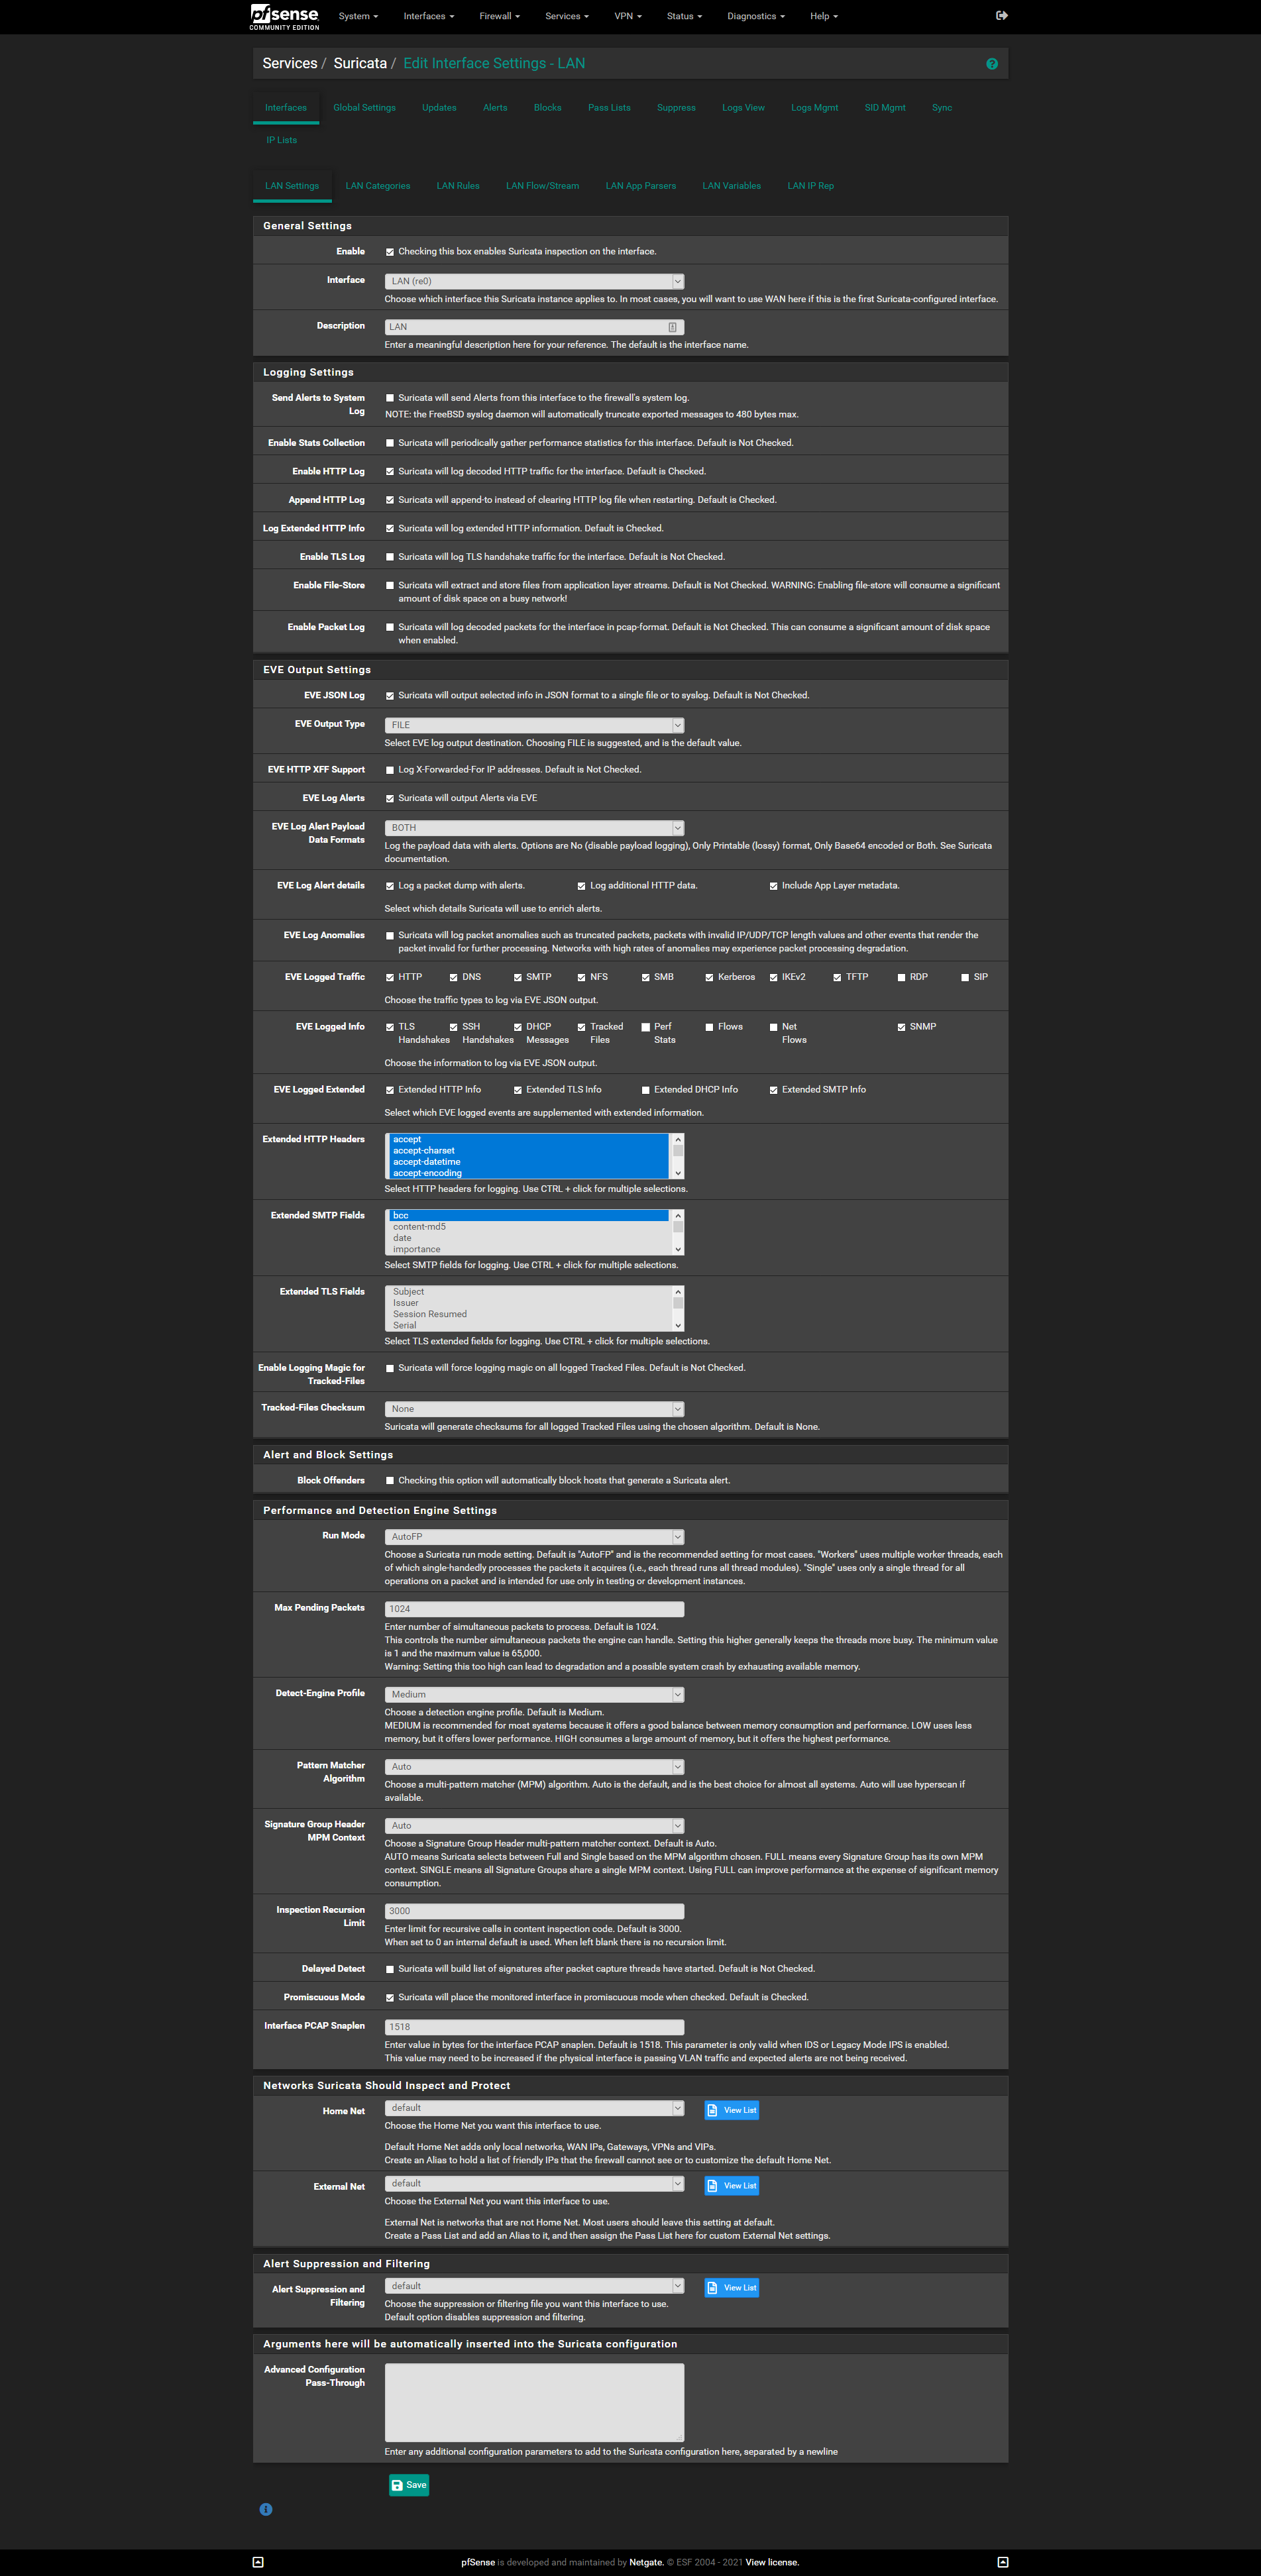
Here is a screenshot from issue #276. Please check your settings against the settings within which was confirmed to be working by @revere521
a3ilson
on 21 Mar 2021
@a3ilson Is there a guide/Wiki for OPNsense too? I figured out that OPNsense has very limited settings in the IDS Module so most of the settings described here are just not there.
Im case you are wondering: I had to switch to OPNsense because I need to use WireGuard and it’s no longer supported in Pfsense (Bad code etc.).
Edit: Figured it out.:) It seems like it is way easier in OPNsense then I thought..
Only thing missing is the extended Payload/Packet stream in the alert. But I guess that is more of a Suricata problem and not related to Pflelk isn't it?
By the way I want to thank you again for your epic project and of course the help I got here!
If you want I will buy you a coffee (https://www.buymeacoffee.com) :)
maof97
on 22 Mar 2021
@maof97 - thanks and I agree OPNsense was a ton easier to configure. I was in the process of responding but glad you figured it out. In regards to suircata on OPNsense, I have mine set as follows:
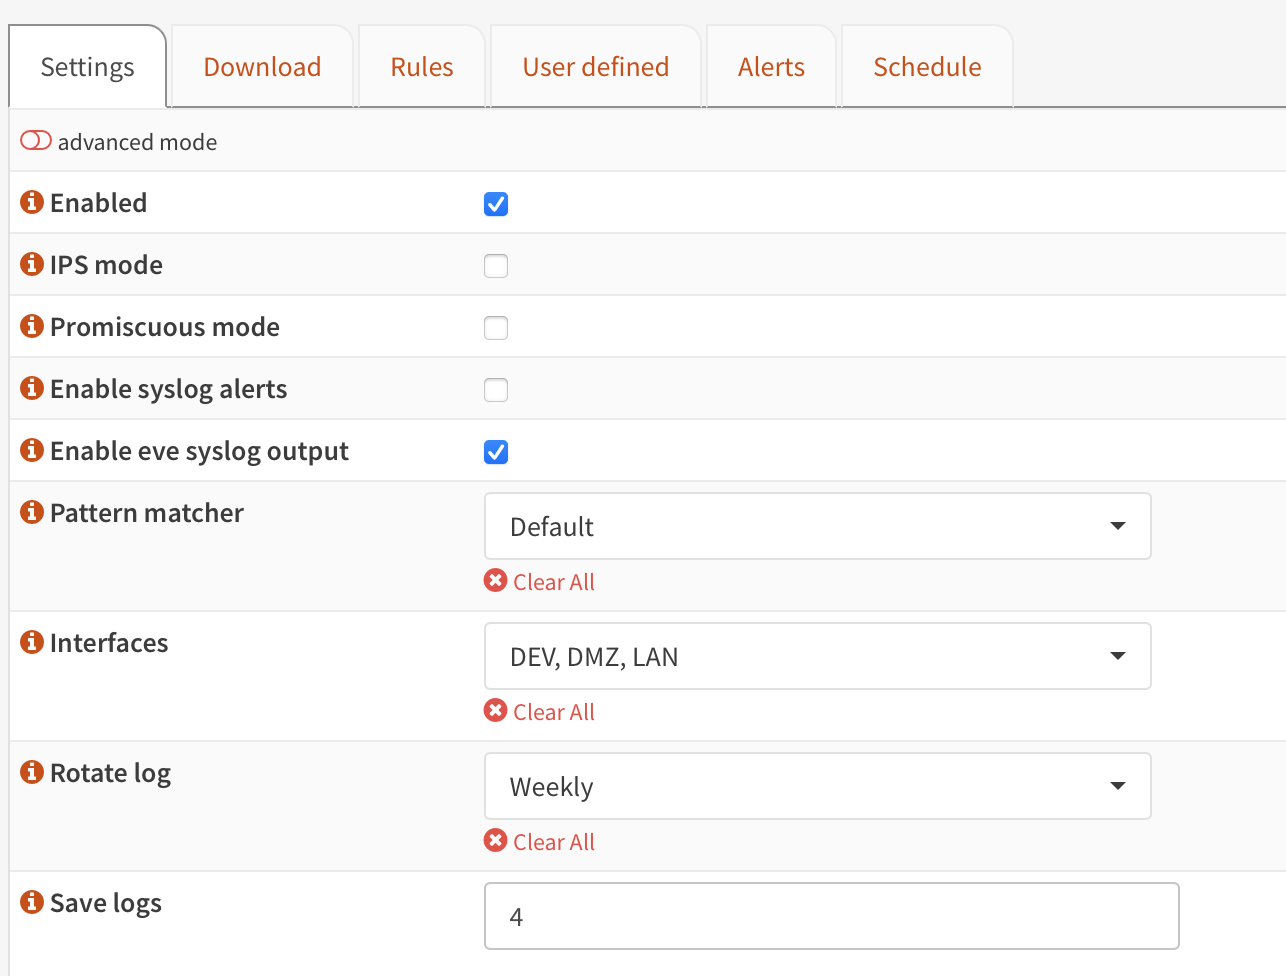
Also, pfelk will enrich both "Enabled syslog alerts" and "Enable eve syslog output" but I elect to use eve log as it contains the same info and a lot more.
a3ilson
on 22 Mar 2021
I currently have the problem that the Kibana SIEM won't register the Suricata alerts. (Suricata dashboard shows the alert but SIEM don't). I followed the wiki guide to add the pfelk-... entries and on the "Network" tab it already show all connections from the firewall.
Anything I missed here?
maof97
on 22 Mar 2021
So this is or may be dependent upon your version (e.g. paid vs free). For instance, in the overview tab, the detection alert trend leverages the AI which is only available within the paid version but you should see all pfelk entries within the events separated by type (e.g. pfelk.unbound, pfelk.firewall etc...). Next, the hosts tab should populate along with the events sub tab. The network tab should also be populate.
I do not find the built-in SIEM useful unless other data sources are being ingested and/or aggregated.
a3ilson
on 22 Mar 2021
Yeah I use winlogbeat packetbeat etc. and push everything to the Siem. I actually only need the alerts to be displayed in the „Detections“ tab to be further evaluated/pushed via E-Mail etc.. For visuals the pfelk dashboards are better anyway. ;)
maof97
on 22 Mar 2021
Gotcha...I have not dabbled within that tab (detections) due to subscription limitations.
Reference:
https://www.elastic.co/guide/en/security/7.11/detections-permissions-section.html
https://www.elastic.co/subscriptions
a3ilson
on 22 Mar 2021
Related issues
 ledge39
·
7Comments
ledge39
·
7Comments
 mango1122
·
3Comments
mango1122
·
3Comments
 rrosson
·
14Comments
rrosson
·
14Comments
 s7thamon
·
14Comments
s7thamon
·
14Comments
 myrsecurity
·
12Comments
myrsecurity
·
12Comments
Most helpful comment
The error is with syntax in the 50-outputs.conf
it refers specifically to this top section of the file (line 26 column 5) which is the bracket at the bottom of the section below - and its where its supposed to be.
I don't use Xpack, but does the user and pass need to be in quotes here? Either that or try pulling the 50-outputs.conf down again, and configuring it; its balking at that line for some reason.