Pfelk: After the installation is completed my VMs performance is maxed out
Hi guys, ive run the SH installation OK but look at the VM performance
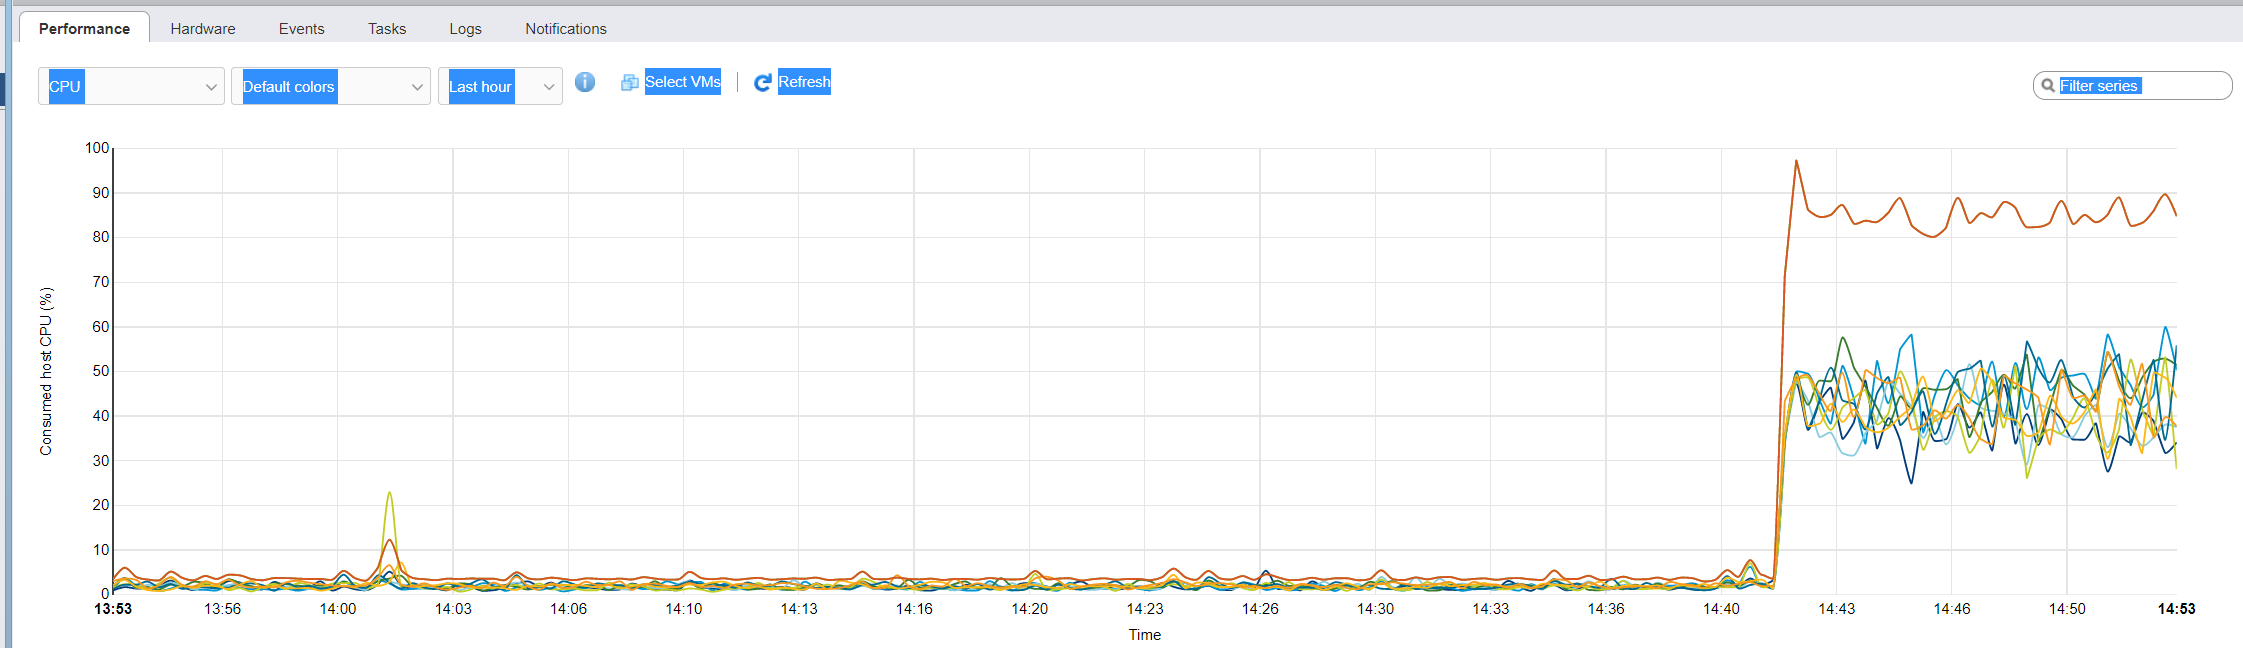
Is something I can tweak out?
 myrsecurity
All 12 comments
top
myrsecurity
on 9 Nov 2020
How many vCPU's did you give the VM? What are the specs of the host (bare metal) that you are running this VM on? Roughly how much EPS is this VM processing?
In short need more details.
 rrosson
on 9 Nov 2020
rrosson
on 9 Nov 2020
I can say on a lower powered physical machine, making sure swap was completely disabled made a big difference in performance for me.
 revere521
on 9 Nov 2020
revere521
on 9 Nov 2020
8vCPUs and 16GB RAM - I dont know why, on previous version projects it came that hard coded 8.8.8.8 dns query was taking lots of CPU time
myrsecurity
on 9 Nov 2020
@myrsecurity - The DNS lookup was okay but as you pointed out it created a huge increase in inquires (CPU load) with little value added. It is no longer included but utilizing Unbound is a preferred alternate for DNS queries.
As @revere521 stated, disabling your swap should help out. Once done, please check back and provide an update.
I'm currently running logstash and kibana on one VM (2xCPUs nad 8GB RAM). I have another VM running elasticsearch via Docker (three clusters) where I'm sending pfELK logs and Moloch data too...both these VMs are currently sitting under 10% CPU load but again they are also a home lab where traffic is minimal.
 a3ilson
on 9 Nov 2020
a3ilson
on 9 Nov 2020
sorry chaps enhancing swap (disable) on my Ubuntu didnt work neither - machine is massively taken - I have stopped for now this project and will come back again to check for updates.
by the way how is the syslog 1024 char limitation going? I saw a thread some time ago about a workaround tweaking some settings but didnt test myself .. cheers
myrsecurity
on 15 Nov 2020
The 1024 char limitation was solved which was specific to pfSense sending suricata logs via syslog. The remedy/solution was sending suricata logs separately via json file and the solution was posted here.
I believe this will solve your issue:
Adjust the JVM heap sizes for both logstash and elasticsearch. As noted by Elastic for both Logstash and Elasticsearch. Once you've adjusted and restarted both logstash and elasticsearch, let us know if it worked and we'll update the repository to emphasis this requirement.
By default, I believe they (Logstash and Elasticsearch) are both set for 1GB. I would recommend increasing to 4GB and checking the CPU usage.
Reference:
Logstash no less than 4GB and no more than 8GB
Elasticsearch no more than 50% of your physical ram (that's assuming elasticsearch is the only process being ran) as memory is also required for purposes other than the JVM heap.
a3ilson
on 15 Nov 2020
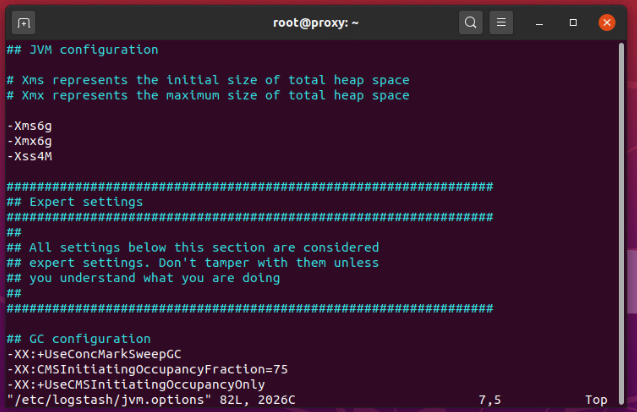
Hi Ives tested this editing /etc/losgstash/jvm.options and /etc/elasticsearch/jvm.options
Logstash
Elastic
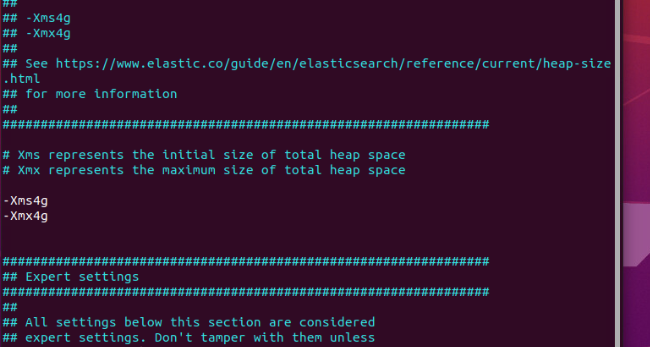
After the changes it seems Elastic behaves better, problem is on Logstash still starving from CPU, Ive reduced the CPUs to 2 Ram is on 8GB
any other changes I can tweak? Cheers
myrsecurity
on 16 Nov 2020
@myrsecurity - you could remove the 35-rules-desc.conf and 36-ports-desc.conf files as they constantly refresh. Although, they enhance the log messages, they are not required. Once removed, you'll need to restart logstash.
a3ilson
on 16 Nov 2020
same unfortunately
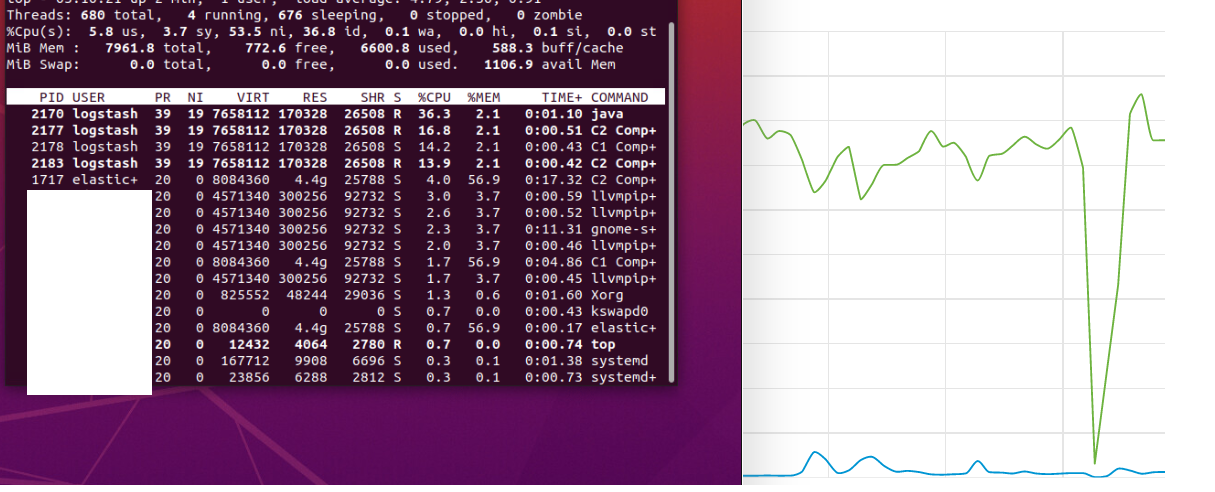
thanks for your support
myrsecurity
on 17 Nov 2020
@myrsecurity - Thanks for trying. Below is a screen shot of mine which idles around 10%.
Here are a couple of observations which I believe may be contributing to the increased usage:
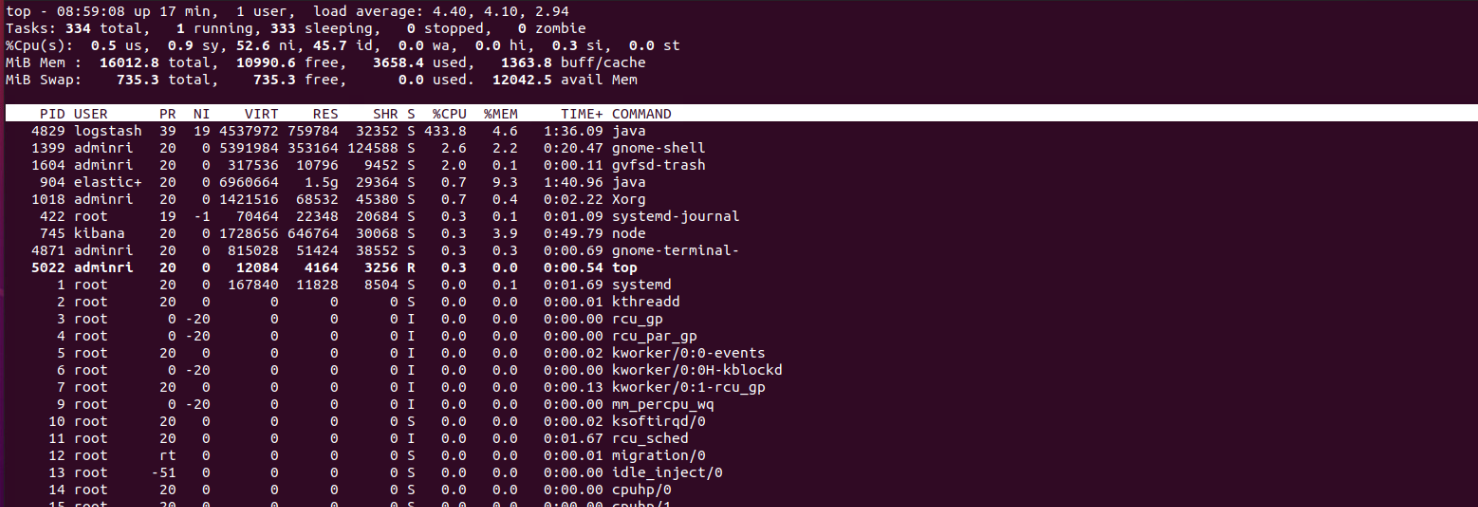
- Your system has 8G of RAM and it is nearly all consumed (mine is also 8G of RAM with just over 5.5G free)
- You have four instances of logstash (how much ram is each instance configured for...you are increasing swapping from disk to ram)
- It appears that you have three of more instances of elasticsearch running (all with 4.4G of ram reserved on a system with 8G...this will increase swapping to/from the disk degrade performance and a slew of other issues)
Recommendation: not knowing the specifics of your setup but as @rrosson indicated earlier...we need to know more specifics. I have a high degree of confidence that if pfELK was running on a VM or dedicated system with the specs you previously provided that this would not be an issue. It appears that your running multiple instances of logstash/elasitcsearch on the same machine and those processes are struggling (competing) over available resources. I would suspect your hard drive is thrashing as a result of the ram being allocated well beyond what's available. Give the following a try:
- Stop all other instances and see if the problem persist (I'll bet it goes away)
Suggestion:
- Increase allocated RAM to meet the requirements for the number of logstash/elasticsearch instances you have running
- Consider running one instance of elasticsearch (you likely don't need separate instances on the same machine) or run elasticsearch in a container (docker)
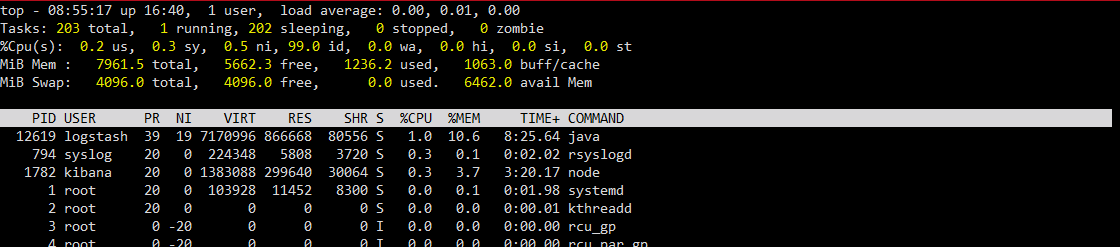
a3ilson
on 17 Nov 2020
Ive reinstalled on Ubuntu 18 and works well - still im unable to use syslog NG for parsing suricata alerts
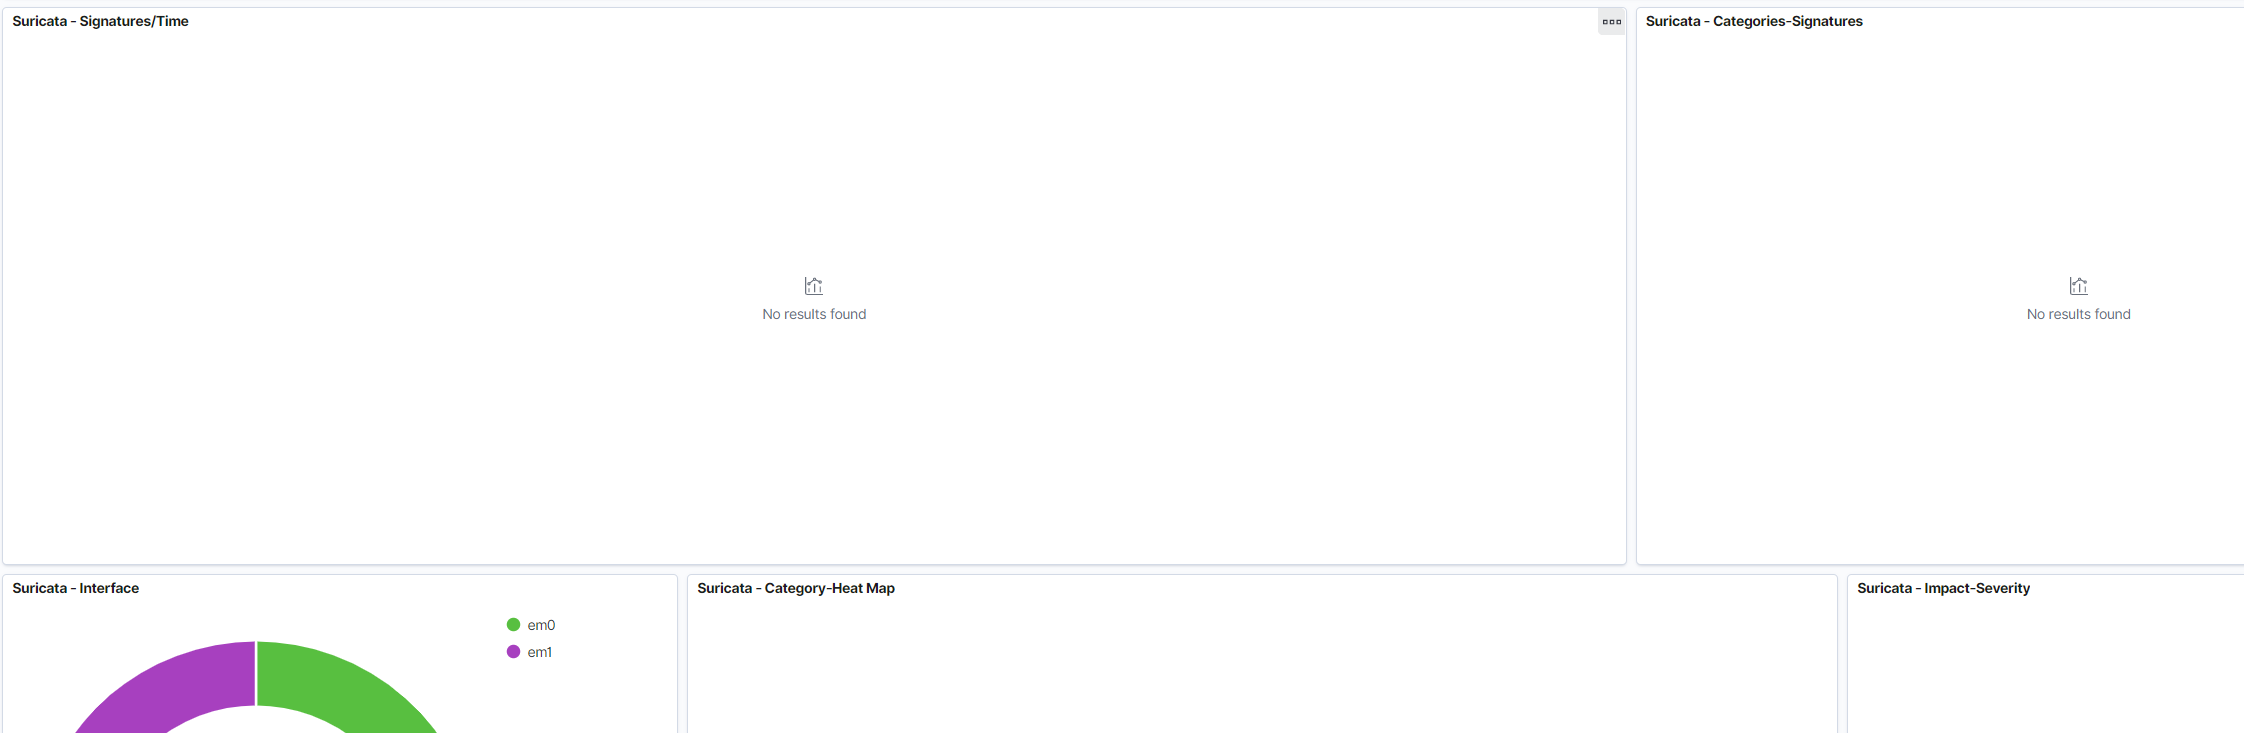
the syslog ng service attempts to start but then fails and stops back

myrsecurity
on 25 Nov 2020
Related issues
revere521
·
17Comments
 vakarthik
·
11Comments
vakarthik
·
11Comments
 InvokerFury
·
20Comments
InvokerFury
·
20Comments
 ledge39
·
7Comments
ledge39
·
7Comments
 geomaraugusto
·
13Comments
geomaraugusto
·
13Comments