Pfelk: Squid-Proxy data onboarding (OPNsense)
Here is the feature request for the Squid-Proxy Logs as discusses :)
My config and logs are generated under OPNsense 20.7.1
Here is a part of the squid config. I use my own CA for certificates on the OPNSense and play "Man-in-the-middle" with ssl interceptions inside squid. I also use Clam-AV via ICAP to scan for Viruses. If needed, i can describe the whole setup.
Here is the need information for the output and some settings for the log:
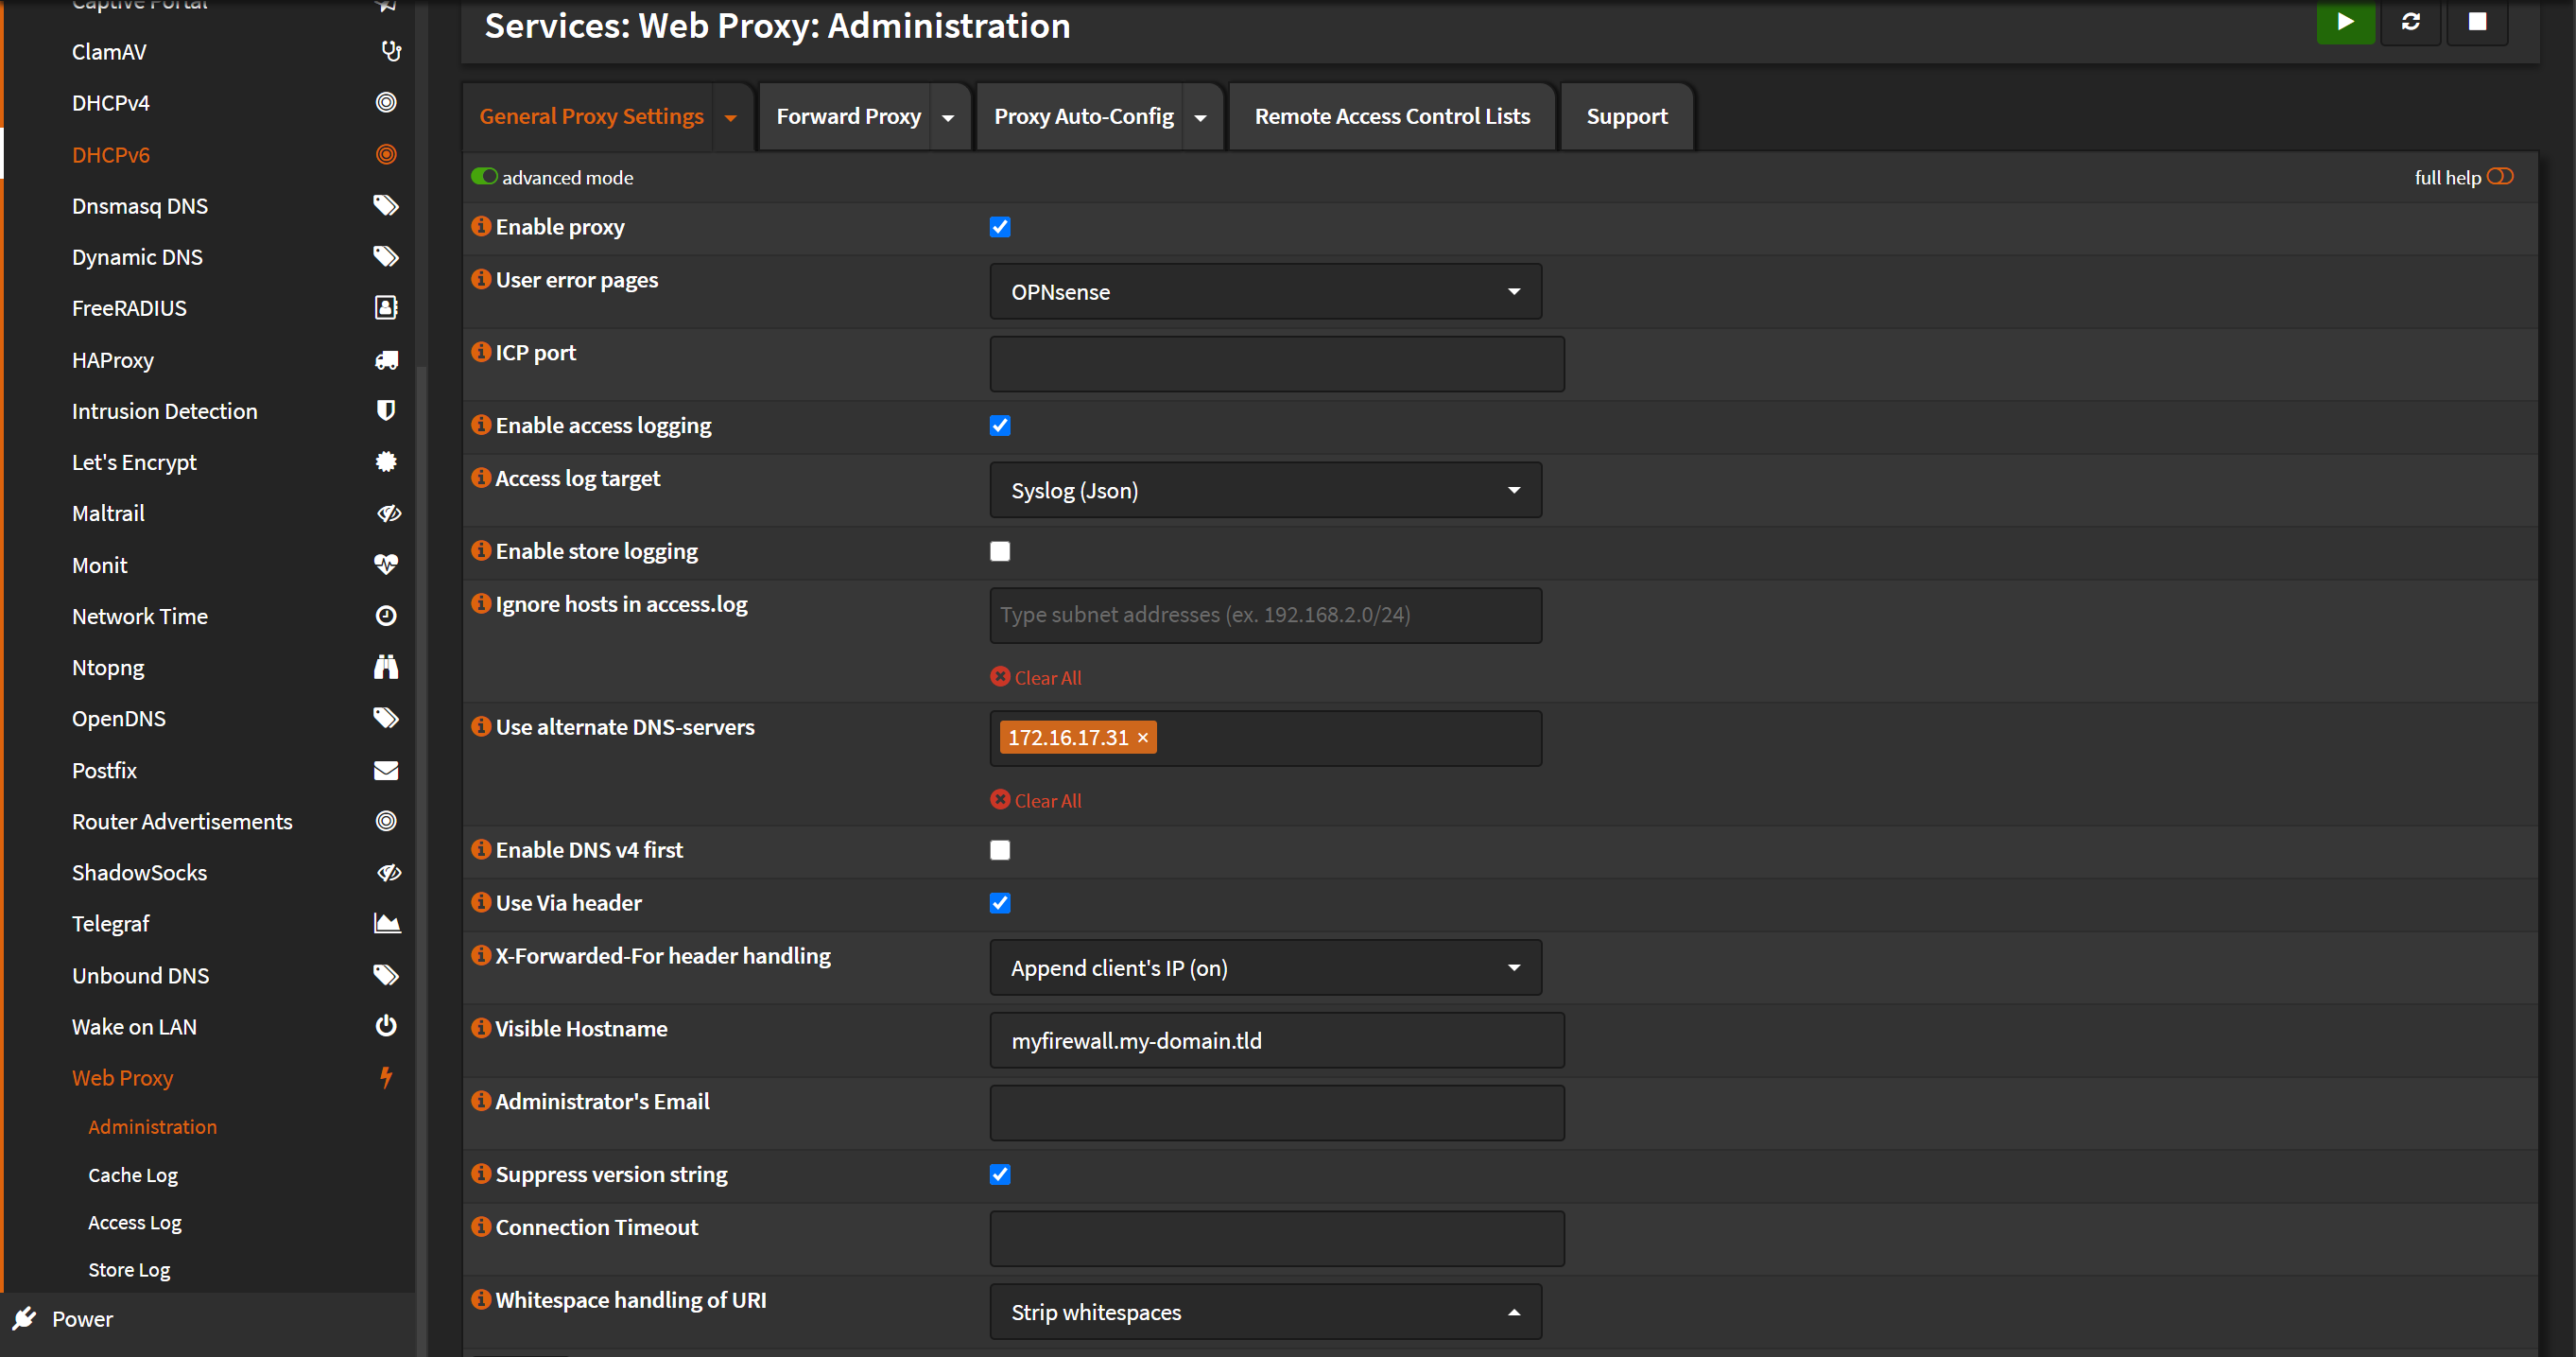
These settings are not the default settings. I adjusted them to my needs (but should fits to the most setups if you want collect the data)
* 1.) RAW Squid Event in default Syslog:*
<166>Aug 21 22:08:13 myfirewall.my-domain.tld (squid-1)[6802]: 1598040493.253 325 172.16.17.119 TCP_MISS/304 2912 GET https://github.com/3ilson/pfelk/file-list/master - HIER_DIRECT/140.82.121.4 -
GROK Pattern for the default Syslog format
<%{NUMBER:number}>%{SYSLOGTIMESTAMP:timestamp} %{DATA:hostname} %{GREEDYDATA:squid_process} %{NUMBER:epoch_timestamp}\s+%{NUMBER:response_time} %{IPORHOST:src_ip} %{NOTSPACE:squid_request_status}/%{NUMBER:http_status_code} %{NUMBER:transfer_size} %{NOTSPACE:http_method} (%{URIPROTO:url_scheme}://)?(?<url_host>\S+?)(:%{INT:url_port})?(/%{NOTSPACE:url_path})?\s+%{NOTSPACE:client_identity}\s+%{NOTSPACE:peer_code}/%{NOTSPACE:peerhost}\s+%{NOTSPACE:content_type}
Beware, the grok patterns is as bad as my first haproxy pattern. Means, without naming scheme to conform to ECS or extra tags.
2.) RAW Squid Events in Syslog JSON (-> a lot more fields and my preferred Version)
<166>Aug 21 22:30:02 myfirewall.my-domain.tld (squid-1)[38379]: {"@timestamp":"2020-08-21T20:30:02+0000","ecs":{"version":"1.0.0"},"event":{"id":"-","dataset":"squid.access","duration":"92"},"http":{"version":"1.1","request":{"method":"GET","referrer":"-"},"response":{"body":{"bytes": 1115, "status_code": 301}}},"host":{"hostname":"DESKTOP-BBHCLCR.my-domain.tld"},"service":{"name":"proxy","type":"squid"},"source":{"ip":"172.16.17.119"},"url":{"original":"https://netflix.com/"},"user":{"name":"-"},"user_agent":{"original":"Mozilla/5.0 (Windows NT 10.0; Win64; x64) AppleWebKit/537.36 (KHTML, like Gecko) Brave Chrome/84.0.4147.135 Safari/537.36"},"labels":{"request_status":"TCP_MISS","hierarchy_status":"HIER_DIRECT"},"message":"GET https://netflix.com/ HTTP/1.1"}
I´m not sure if the JSON output also needs a default GROK pattern (since the fields are defined) or just a template.
I prefer the Syslog JSON format (2.) because it has a lot more fields and they are in a structured JSON Format.
But that´s just my personal opinion and i don´t want to set such default settings for logging on your project here.
Please tell me if you need more information.
Thanks.
 BeNeDeLuX
All 13 comments
Those curvy brackets surrounding squid-1 may be problematic. Currently it will filter (squid-1) as the value for the field application but this is the only application containing curvy brackets and amending the filter will break all others. However, for right now, I think I'll just leave it as (squid-1) and rename it.
Give this a try:
Create a new conf file called 15-squid.conf and amend as follows:
# 15-squid.conf
filter {
  if [application] == "(squid-1)" {
    mutate {
     rename => ["(squid-1)" => "squid"]
    }
  }
  if [type] == "firewall" {
    if "pf" in [tags] and [application] =~ /^squid$/ {
      mutate {
        add_tag => [ "squid" ]
      }
      if [pf_message] =~ /^{.*}$/ {
        json {
          source => "pf_message"
          target => "squid"
          add_tag => "squid_json"
        }
      }
#      if "squid_json" not in [tags] {
#        grok {
#          patterns_dir => ["/etc/logstash/conf.d/patterns"]
#          match => [ "pf_message", "%{SQUID}"]
#        }
#      }
      mutate {
        remove_tag => "squid_json"
      }
    }
  }
}
Going through this I noted two updates within the 03-filter.conf and pfelk.grok files needed to correct/fix proper enrichment of suricata logs and attached to this comment.
03-filter & pfelk-grok.zip
 a3ilson
on 22 Aug 2020
a3ilson
on 22 Aug 2020
Here is a just quick information. Logstash won´t start with the added 15-squid.conf:
Aug 22 07:18:22 elk01 logstash[5215]: [2020-08-22T07:18:22,465][ERROR][logstash.agent           ] Failed to execute action {:action=>LogStash::PipelineAction::Create/pipeline_id:main, :exception=>"LogStash::ConfigurationError", :message=>"Expected one of [ \\t\\r\\n], \"#\", \"{\", \",\", \"]\" at line 5, column 29 (byte 103) after filter {\n  if [application] == \"(squid-1)\" {\n    mutate {\n     rename => [\"(squid-1)\" ", :backtrace=>["/usr/share/logstash/logstash-core/lib/logstash/compiler.rb:58:in `compile_imperative'", "/usr/share/logstash/logstash-core/lib/logstash/compiler.rb:66:in `compile_graph'", "/usr/share/logstash/logstash-core/lib/logstash/compiler.rb:28:in `block in compile_sources'", "org/jruby/RubyArray.java:2577:in `map'", "/usr/share/logstash/logstash-core/lib/logstash/compiler.rb:27:in `compile_sources'", "org/logstash/execution/AbstractPipelineExt.java:181:in `initialize'", "org/logstash/execution/JavaBasePipelineExt.java:67:in `initialize'", "/usr/share/logstash/logstash-core/lib/logstash/java_pipeline.rb:44:in `initialize'", "/usr/share/logstash/logstash-core/lib/logstash/pipeline_action/create.rb:52:in `execute'", "/usr/share/logstash/logstash-core/lib/logstash/agent.rb:356:in `block in converge_state'"]}
Aug 22 07:18:22 elk01 logstash[5215]: [2020-08-22T07:18:22,650][INFO ][logstash.agent           ] Successfully started Logstash API endpoint {:port=>9600}
Aug 22 07:18:27 elk01 logstash[5215]: [2020-08-22T07:18:27,760][INFO ][logstash.runner          ] Logstash shut down.
Aug 22 07:18:28 elk01 systemd[1]: logstash.service: Main process exited, code=exited, status=1/FAILURE
Aug 22 07:18:28 elk01 systemd[1]: logstash.service: Failed with result 'exit-code'.
Made an adjustment to the 15-squid file:
# 15-squid.conf
filter {
  if [application] == "(squid-1)" {
    mutate {
     rename => {"(squid-1)" => "squid"}
    }
  }
  if [type] == "firewall" {
    if "pf" in [tags] and [application] =~ /^squid$/ {
      mutate {
        add_tag => [ "squid" ]
      }
      if [pf_message] =~ /^{.*}$/ {
        json {
          source => "pf_message"
          target => "squid"
          add_tag => "squid_json"
        }
      }
#      if "squid_json" not in [tags] {
#        grok {
#          patterns_dir => ["/etc/logstash/conf.d/patterns"]
#          match => [ "pf_message", "%{SQUID}"]
#        }
#      }
      mutate {
        remove_tag => "squid_json"
      }
    }
  }
}
If that doesn't work can you provide the rest of your squid configuration...I'll install and work on my end too.
I can also include your setup within the wiki pages, so that others can replicate this setup, once finalized.
a3ilson
on 22 Aug 2020
Logstash is coming up with the last config above!
Here is the first screenshot with the raw data inside Elastic / Kibana
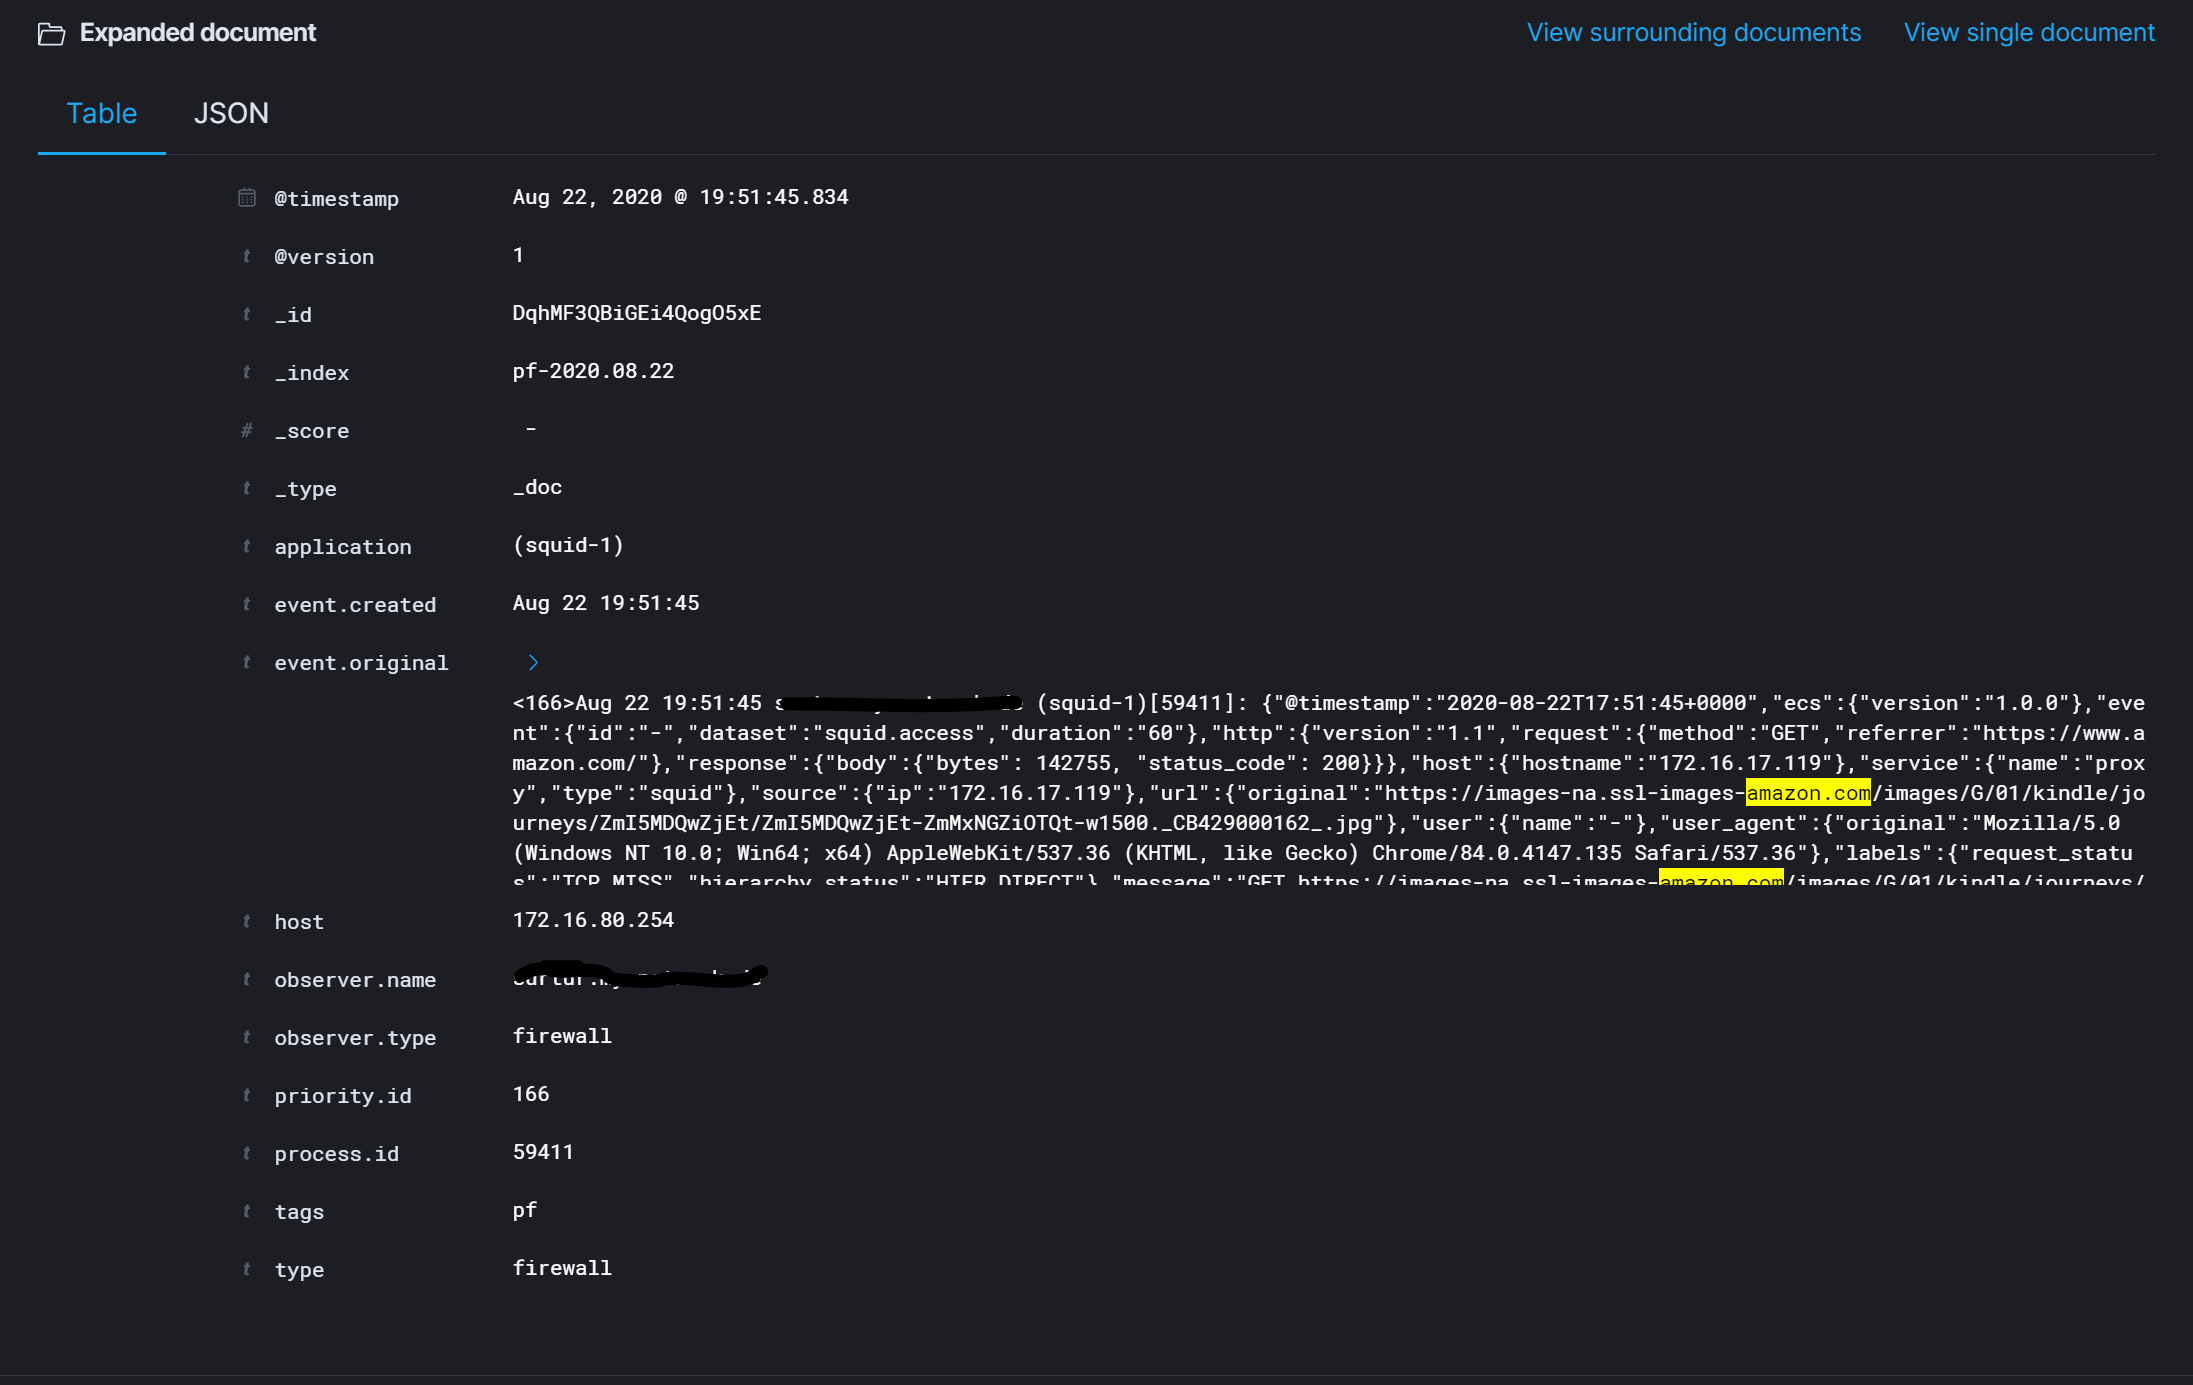
Looks like the renaming won't work for the application field.
BeNeDeLuX
on 22 Aug 2020
Let's give this a try:
# 15-squid.conf
filter {
  if [application] == "(squid-1)" {
    mutate {
    replace => [ "application", "squid" ]
    }
  }
  if [type] == "firewall" {
    if [application] =~ "squid" {
      mutate {
        add_tag => [ "squid" ]
      }
      if [pf_message] =~ /^{.*}$/ {
        json {
          source => "pf_message"
          target => "squid"
          add_tag => "squid_json"
        }
      }
      mutate {
        remove_tag => "squid_json"
      }
    }
  }
}
Tested and working! Next, I'll build the template for haproxy fields.
a3ilson
on 22 Aug 2020
I also update the grok file...adjusted fields to match their beats module equivalents
# pfelk.zip
a3ilson
on 23 Aug 2020
Yes, confirmed! 👍
All squid fields are extracted trough the JSON Format and the Application is also "squid" now.
Perfect, that was way more easier than the HAProxy Logs.
Thank you very much!
I will try to create some useful dashboards and share them, of course.
BeNeDeLuX
on 23 Aug 2020
I've been running mine for ~12hours. After you've confirmed everything is working - please close this issue. Otherwise, we'll keep refining.
a3ilson
on 23 Aug 2020
Works also fine for me. I close this issue.
Thank you!
BeNeDeLuX
on 23 Aug 2020
@BeNeDeLuX - Curious about your setup? Are you capturing the SSL traffic to/from squid and decrypting with your SSL? I'm looking to build a setup that'll allow for PCAP capture, decrypt and analysis.
a3ilson
on 28 Aug 2020
I enabled SSL inspection inside squid which replace all SSL Certs with my own SSL Certs from the OPNSense CA.
Here is an example from github.com:
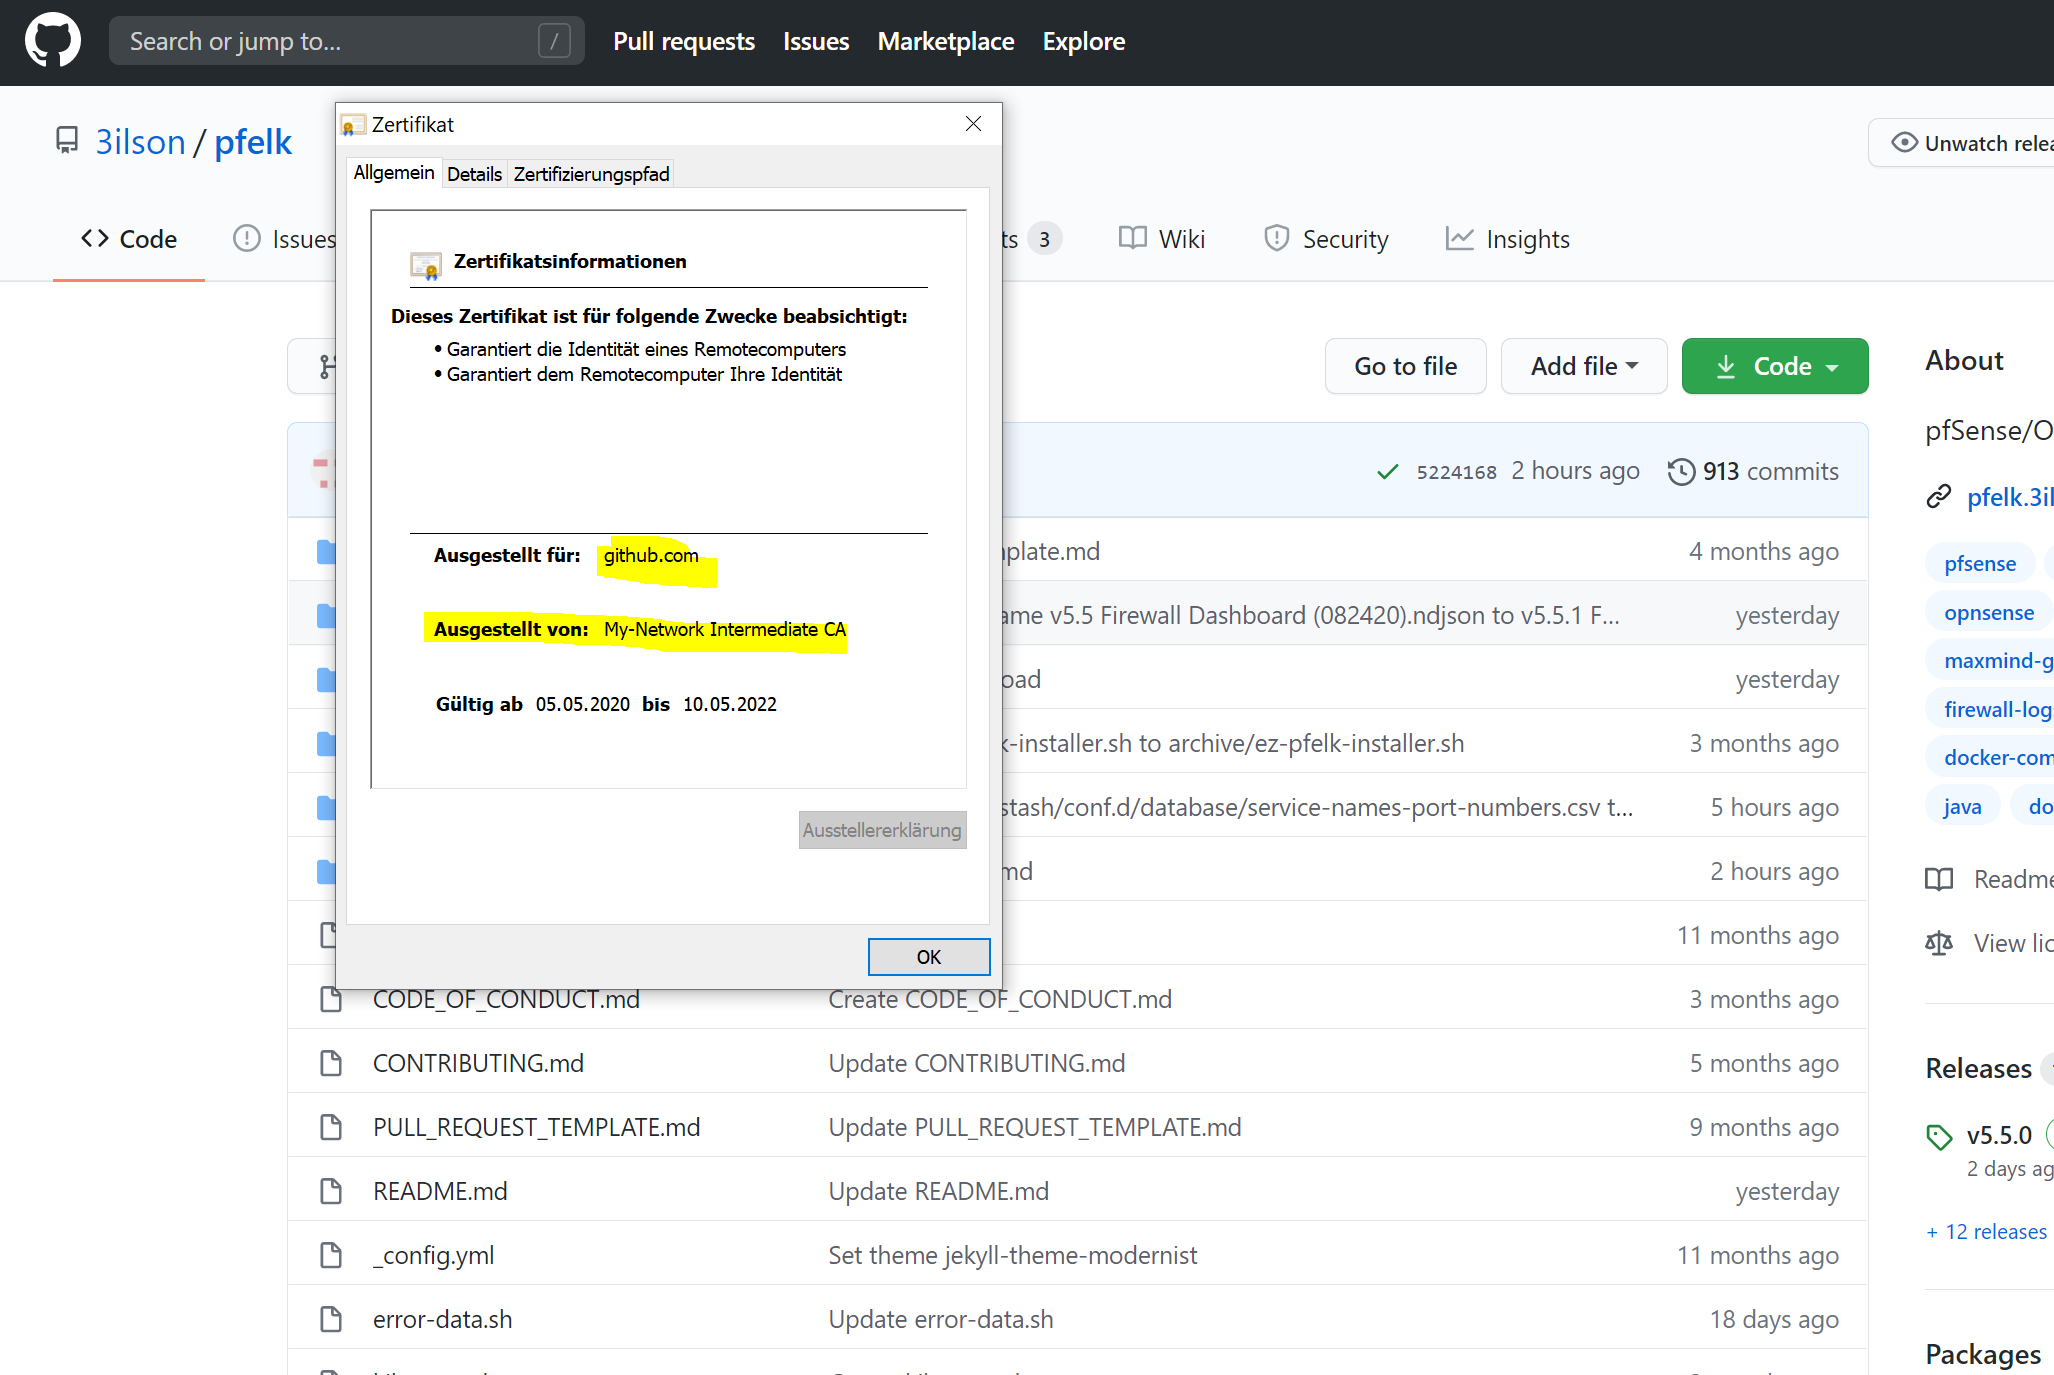
Here are some screenshots about my configuration. I use this method to scan the ssl traffic for viruses via the ICAP Server and ClamAV. But it should be possible to decrypt this TLS Traffic again since you have the private key for. I have Moloch (https://molo.ch/) as PCAP capture and analysis still on my todo list.
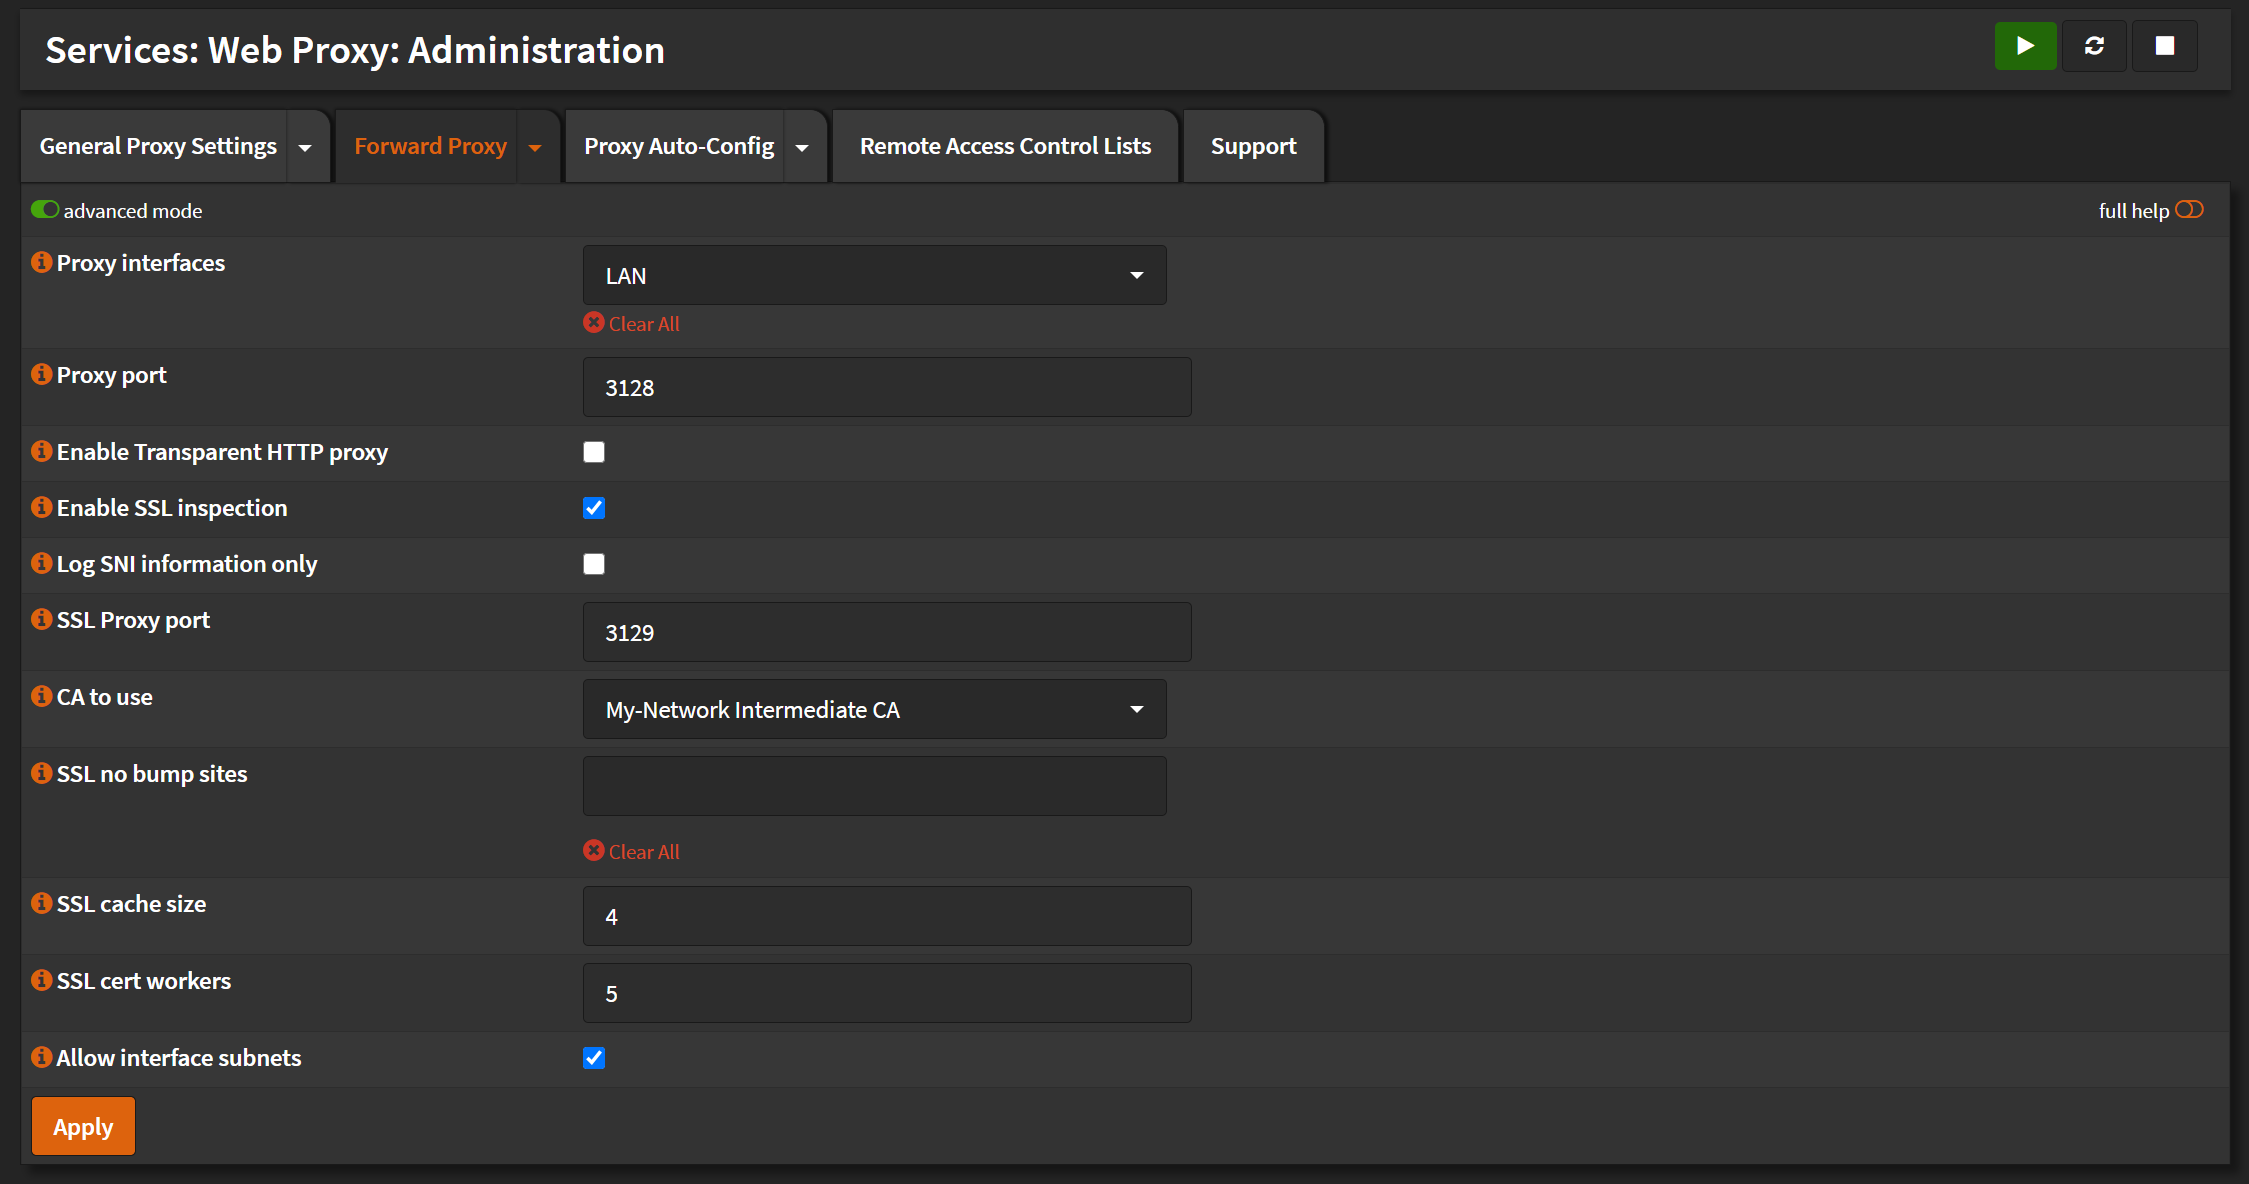

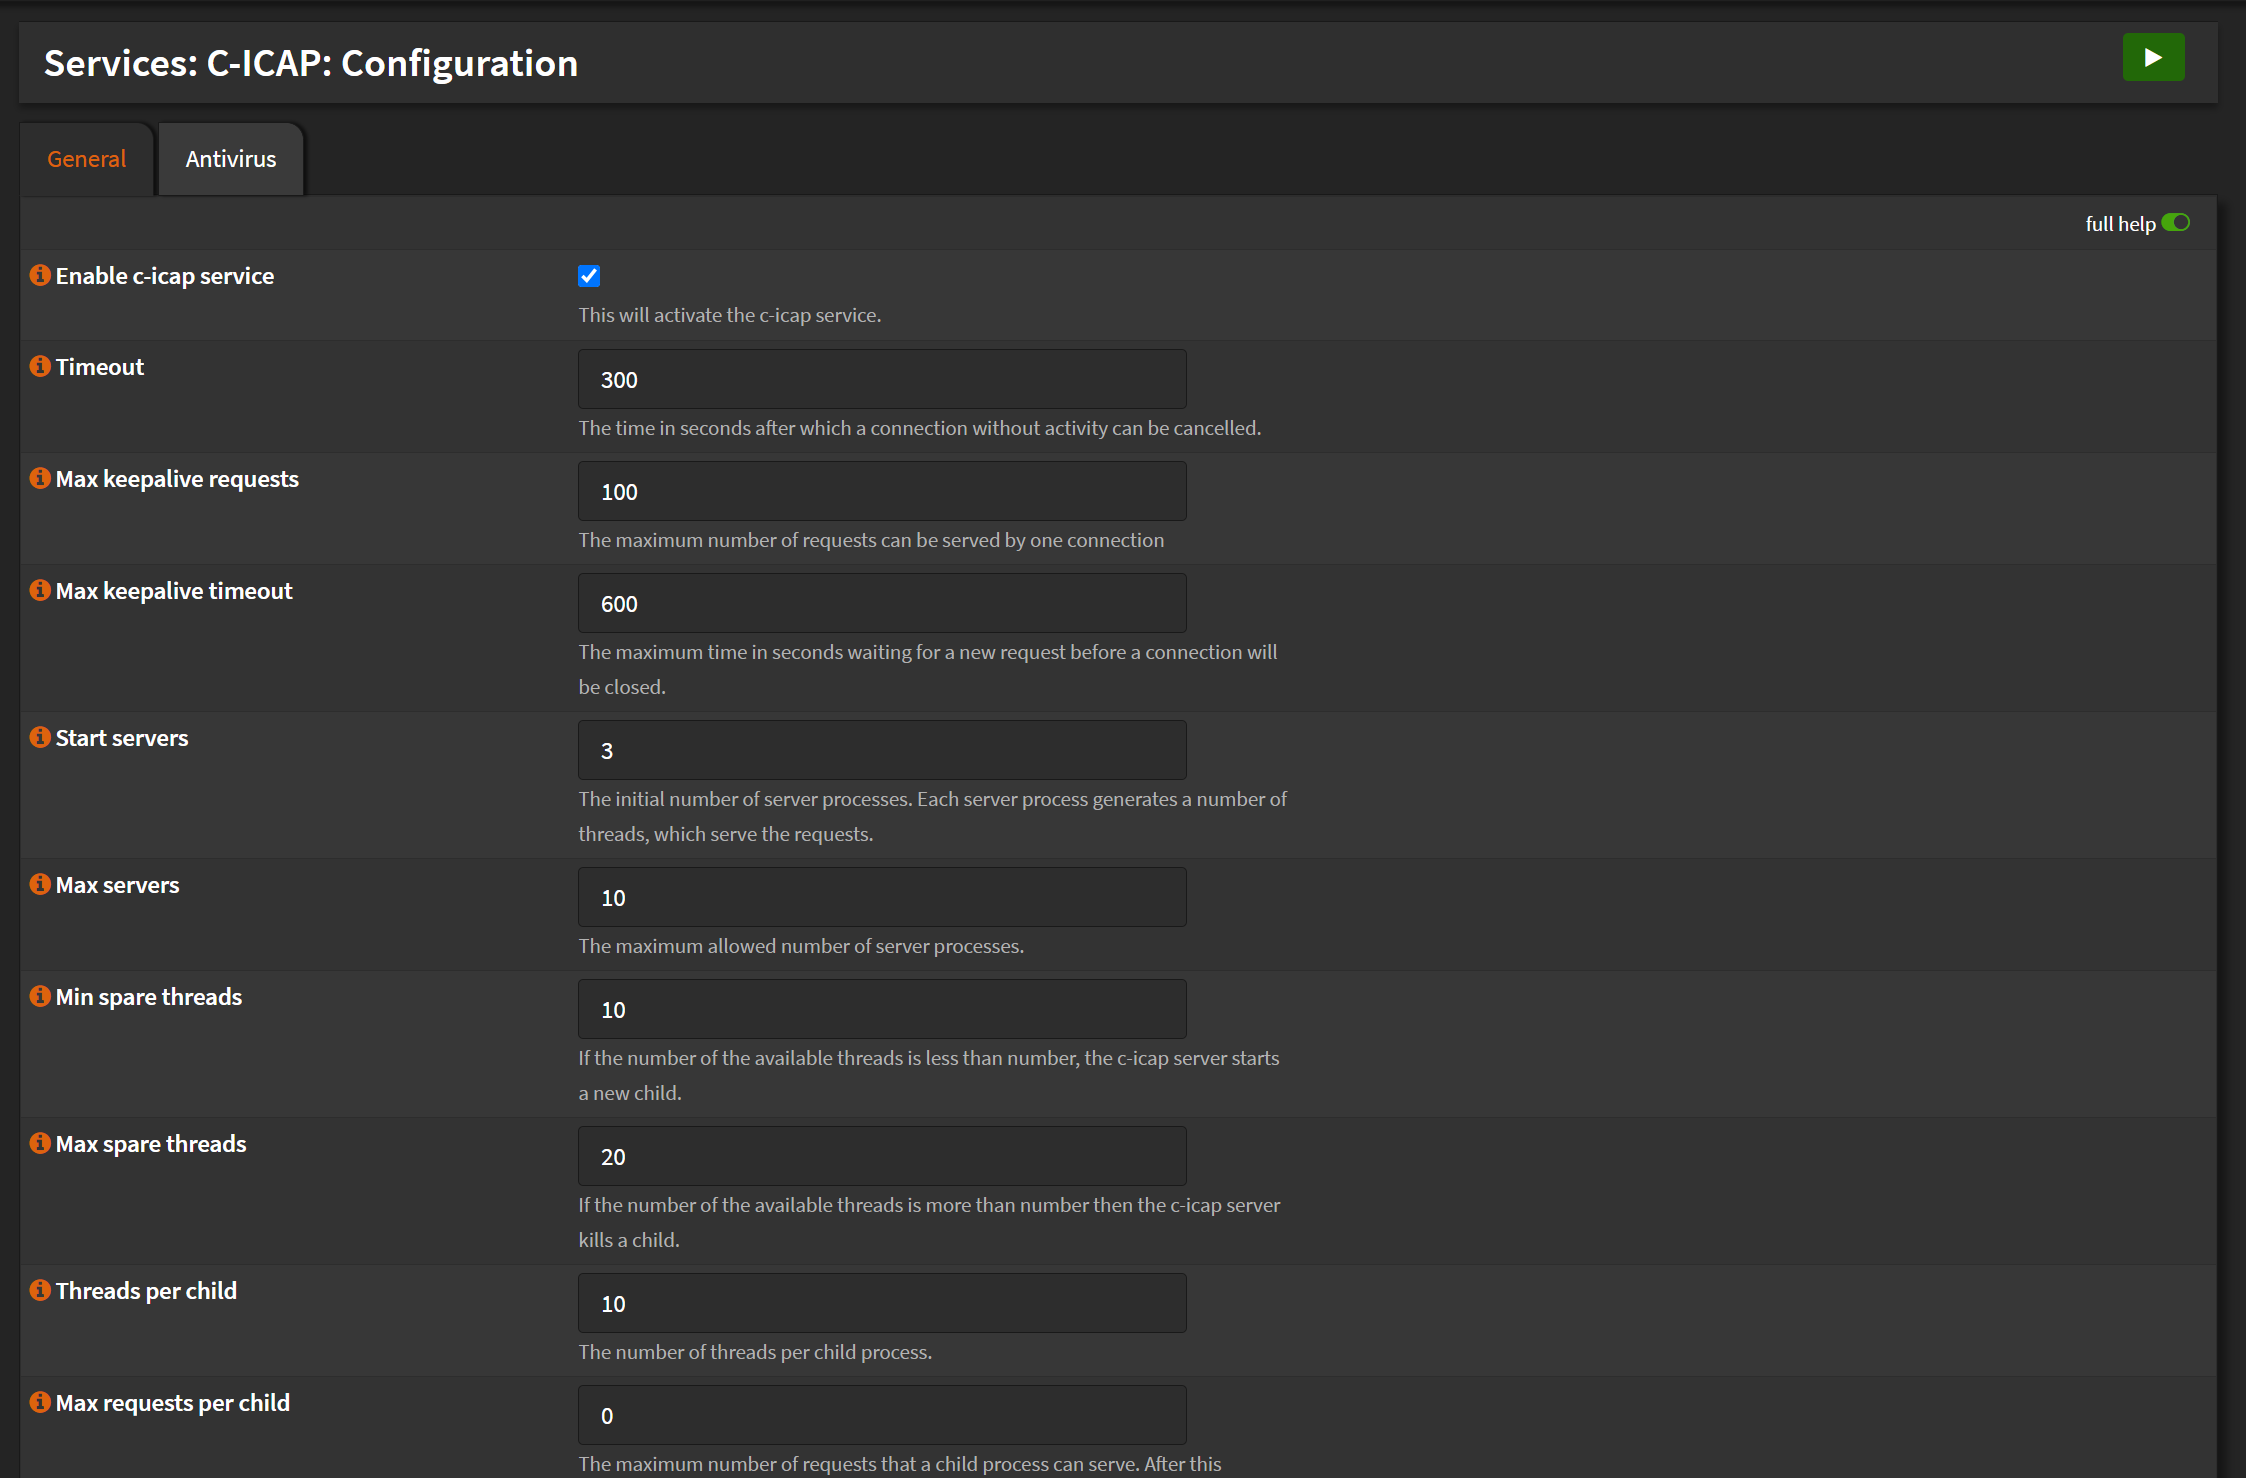
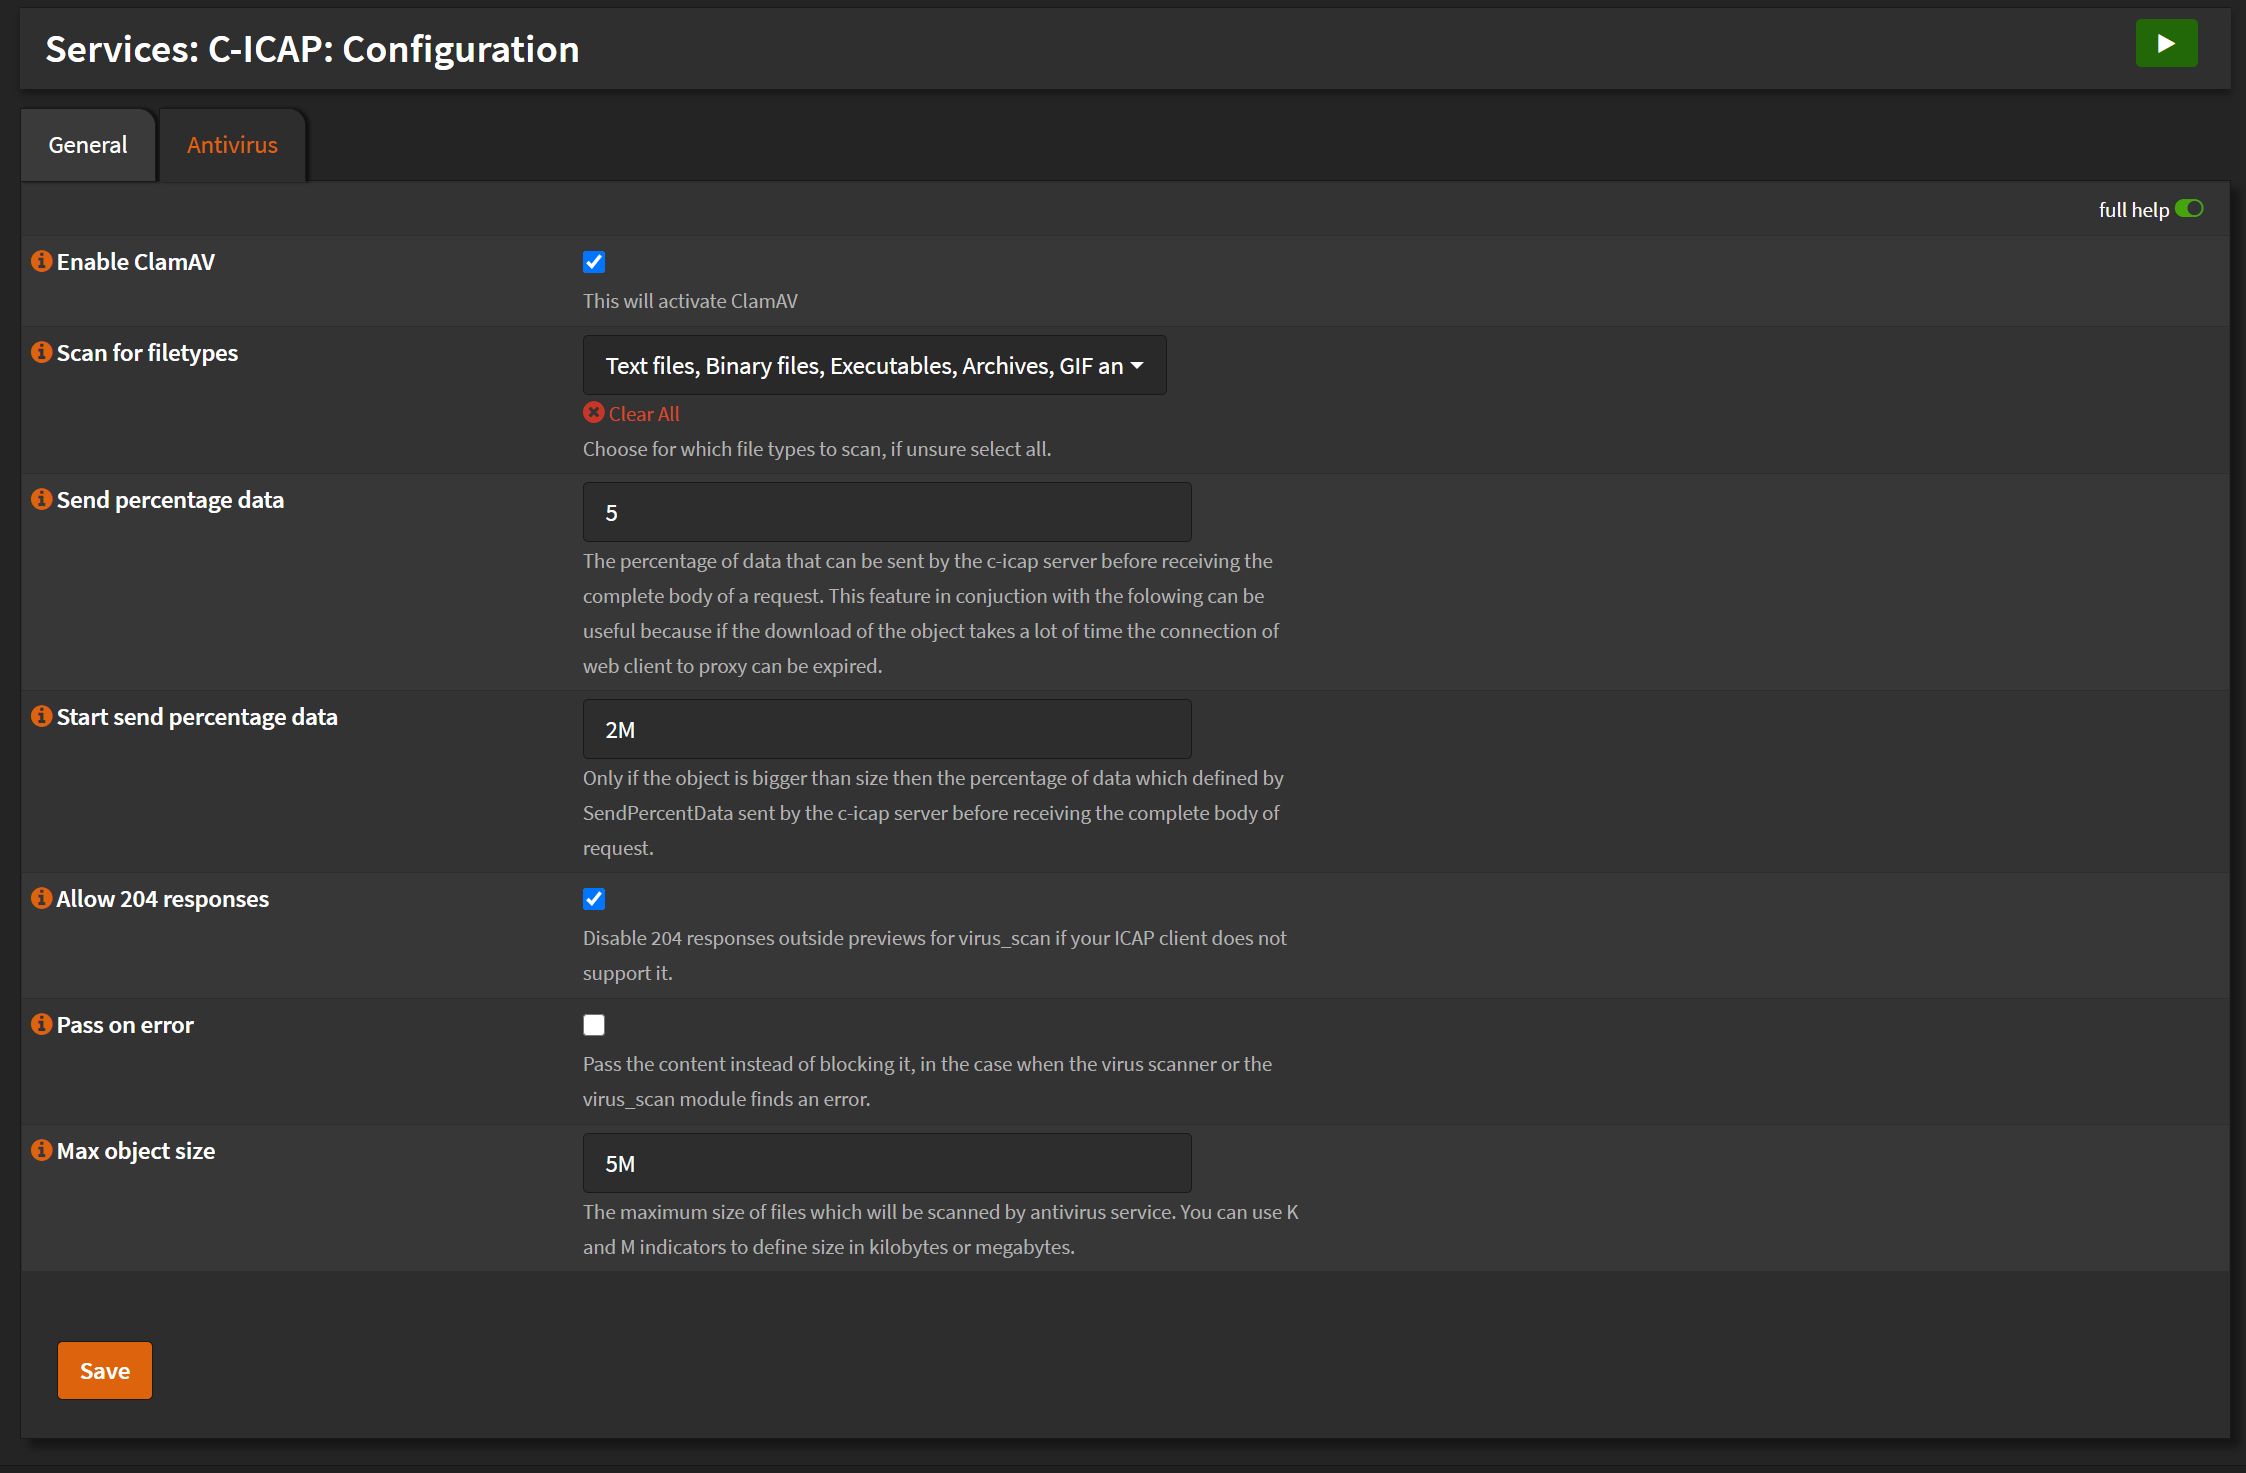
You could try to capture the traffic on the OPNsense directly for a test as PCAP under Interfaces -> Diagnostic -> Packet Capture and try to decrypt it in wireshark. Hope that helps you out.
BeNeDeLuX
on 28 Aug 2020
Thanks! I have a similar setup and was hoping for a way to offload (unencrypted) traffic but I'll stick with my tap (mirrored) port sitting between the firewall. I'm running Moloch and was looking for a solution to send/store the data unencrypted.
a3ilson
on 28 Aug 2020
Related issues
 vakarthik
·
11Comments
vakarthik
·
11Comments
 s7thamon
·
14Comments
s7thamon
·
14Comments
 keshif
·
26Comments
keshif
·
26Comments
 ledge39
·
7Comments
ledge39
·
7Comments
 bNg91
·
30Comments
bNg91
·
30Comments