Pfelk: Filebeat based pfelk (and fully based on containers)
Is your feature request related to a problem? Please describe.
Not related to a problem.
Describe the solution you'd like
I'm rather new to ELK, I used to be a Splunk user.
After reading quite a bit I tried collecting my OPNSense logs using the Filebeat syslog collector.
I works rather well and simplifies quite a bit the code. The file "01-inputs.conf" is almost unnecessary. I just tag the packet with "pf" directly at filebeat level.
filebeat/filebeat.docker.yml (extract)
```filebeat.inputs:
- type: syslog
tags: ["pf","Ready"]
processors:
- add_locale: ~
protocol.tcp:
host: "0.0.0.0:1515"
```
- add_locale: ~
The Filebeat outputs to Logstash and everything is docker based.
So this could be something. you could use.
I have only one problem (https://discuss.elastic.co/t/pfsense-data-and-ecs-data-fetch-failure/222525), the logs are "multi-fields" in Elastic while they should be keywords to work with the SIEM. I didn't solve that yet.
Describe alternatives you've considered
/
Additional context
/
 somm15
All 35 comments
It is solved. I didn't load the templates in elastic.
So I have a working filebeat based solution.
I'm just working on streamlining the https setup (required for the SIEM).
somm15
on 10 Mar 2020
Great! Please share your solution and I’ll look into incorporating it.
On Tue, Mar 10, 2020 at 05:27 Simon Gillet notifications@github.com wrote:
It is solved. I didn't load the templates in elastic.
So I have a working filebeat based solution.
I'm just working on streamlining the https setup (required for the SIEM).—
You are receiving this because you are subscribed to this thread.
Reply to this email directly, view it on GitHub
https://github.com/3ilson/pfelk/issues/75?email_source=notifications&email_token=AEA2HR3X5BF6PHRZX7UGPQDRGYBZXA5CNFSM4LDOHPW2YY3PNVWWK3TUL52HS4DFVREXG43VMVBW63LNMVXHJKTDN5WW2ZLOORPWSZGOEOKUTXI#issuecomment-596986333,
or unsubscribe
https://github.com/notifications/unsubscribe-auth/AEA2HR6HUVBHLGBEPX2CX5DRGYBZXANCNFSM4LDOHPWQ
.
 a3ilson
on 10 Mar 2020
a3ilson
on 10 Mar 2020
Great @somm15!
@a3ilson, I am wondering if Filebeat was tested earlier, and if yes what were the results? I guess running a beat on the firewall host might has some overhead regarding performance, but I'm not completely sure how much. It might be a good idea to take some measurements with these setups.
 fktkrt
on 10 Mar 2020
fktkrt
on 10 Mar 2020
@fktkrt I run on a quite powerful machine so it's not important in my case. But I'll check.
I'm new to Elastic but I understood that Filebeat is newer and could maybe replace Logstash in the future.
My setup actually uses 2 Filebeats, one collecting syslog and feed Logstash, another collecting netflow and feeding directly elastic (no Logstash in he pipe).
somm15
on 10 Mar 2020
I'm new to Elastic but I understood that Filebeat is newer and could maybe replace Logstash in the future.
Filebeat in elastic is a light implementation available if you are not enriching your data. Logstash is not going away it is just being pushed up the stack. Logstash is now an option when filbert is not and/or if you need to enrich your data. I am following this thread because there is always the option of having filebeat installed on your syslog host and processing the syslog as well as the netflow.
 rrosson
on 10 Mar 2020
rrosson
on 10 Mar 2020
My setup actually uses 2 Filebeats, one collecting syslog and feed Logstash, another collecting netflow and feeding directly elastic (no Logstash in he pipe).
Well, I would try to avoid running 2 filebeat instances on a single machine, even if it is not a definitive anti pattern. Using filebeat modules and logstash helped me in this every time.
fktkrt
on 10 Mar 2020
It keeps the configuration much simpler. I search the forum and that's the solution there were recommending because output routing is not available in filebeat. I first had a solution shipping everything to Logstash (1 filebeat). Logstash was routing to different indexes based on tags. It did work as well.
somm15
on 10 Mar 2020
Yes, but once you need the functionality of Logstash and/or you have a bit more complex setup (different beats, many endpoints each with multiple logs to fetch), a mature logstash pipeline can make a lot sense on the long run.
fktkrt
on 10 Mar 2020
I'm relatively new to Elasticstack, so this guide using Logstash was great to help me get started. A colleague of mine told me about Filebeat about a week ago and how it was a much more lightweight approach than Logstash, so I started to dig in.
I just wrapped up my configuration here (for now). On pfSense, I am running Filebeat with the system module to collect syslog data (filterlog, dhcpd, unbound, openvpn) and the suricata module to collect Suricata EVE logs. I'm also running Packetbeat to collect metrics. Both beats deliver results directly to Elasticsearch without requiring the additional overhead of Logstash. Softflowd is also running on pfSense, but it's shipping the IPFIX data directly to a Filebeat running on my monitoring node, where it's processed with the netflow module.
There were a few really tricky pieces to this:
Compiling beats natively on FreeBSD. There were a few guides that got me most of the way there, but this was a lot trickier than it seems, since the latest version of beats (7.6.1) is not being actively maintained for BSD.
Parsing pfSense syslogs. This was the major hurdle. It seems that the normal syslog formats things REALLY weird, and I couldn't get them ingested properly. So I installed the syslog-ng module and configured pfSense to deliver syslogs locally to syslog-ng, which is then dumping them to file so that Filebeat can pick them up. But even with Filebeat's system module, I wanted more information from the logs than just the normal syslog message. This is normally where Logstash would come into play, but luckily Filebeat supports grok processors in pipelines. @a3ilson's grok patterns were a GODSEND here. I was able to modify the standard syslog pipeline and add specifics for the individual pfSense processes, so now my logs look just like what Logstash was showing.
I've attached the modified syslog pipeline module that parses pfSense logs using grok. Keep in mind that the pipeline is built using JSON, so you'll need to be careful to escape things properly. I hope this helps!
pipeline.json.zip
@a3ilson I had to modify the DHCPREQUEST and DHCPINFORM processors, as they were not correctly parsing my log output.
EDIT: I forgot to mention, beats has native dashboards that can be imported into Kibana. That's probably the next phase for me now that I am getting some good data to play with.
 gregg1ep00
on 31 Mar 2020
gregg1ep00
on 31 Mar 2020
@gregg1ep00
If using beats you should be able to use the built-in Kibana dashboards.
You installed filebeat on the same system as your pfSense?
I started looking into this (filebeat) since this issues was created by @somm15 and looking to create the following:
pfSense/OPNsense >> filebeats >> logstash >> elasticsearch. I haven't started but looking to fire up an instance this week. Thanks for sharing your pipeline template. If you (@gregg1ep00) or @somm15 have additional configuration or insight, feel free to share.
a3ilson
on 31 Mar 2020
@a3ilson here's my small setup.
Ubuntu 18.04 monitoring box
- Elasticstack 7.6.1
- Kibana 7.6.1
- Filebeat 7.6.1
- Netflow module (receiving from softflowd on pfSense)
pfSense 2.4.5
- Filebeat 7.6.1
- System module (picking up syslog-ng logs locally, outputs to elasticstack directly)
- Suricata module (picking up EVE logs locally, outputs to elasticstack directly)
- Packetbeat 7.6.1
- Outputs to elasticstack directly
I compiled beats on a FreeBSD VM, then shipped the binaries to pfSense. The other supporting files (modules, dashboards, etc.) were just extracted from the Linux archive, since those seemed to be more complete than the stuff I pulled from source. Getting beats to compile on BSD was not straightforward at all.
On pfSense, I had to place things on the filesystem in areas that would remain safe during system upgrades:
- /usr/local/etc: beats configs (filebeat.yml, packetbeat.yml)
- /var/db/beats: data, logs, kibana dashboards, and modules
- /usr/local/sbin: beats binaries (filebeat, packetbeat, *beat)
- /usr/local/etc/rc.d: beats startup scripts
There is actually an old beats pkg that I was able to install (not in pfSense, but just regular BSD) to help me out with these paths, but since I wanted to use 7.6.1, the binaries were replaced, and the supporting folders were brought over from the Ubuntu box.
Of course there are 47 billion ways to slice the onion, but since I'm using the syslog ingest pipeline to grok the pfSense logs, I really don't need the overhead of running Logstash.
gregg1ep00
on 31 Mar 2020
@gregg1ep00 Thanks for sharing.
Why did you separate beats (i.e. one instance running on your pfSense instance and a remote session)? I'm guessing it was a result of netflow (limitations)? I dabbled with the netflow module last year and had the issue of not being able to run anything other than netflow. Although, my preferred method might be to run multiple instances of beats, within docker. Overall, it sounds like filebeats simplifies and automates a few things.
Looking forward to giving filebeats a whirl - thanks!
a3ilson
on 31 Mar 2020
@a3ilson the only purpose filebeat (on the monitoring node) is serving is to listen for incoming netflows from softflowd. But honestly, I'm probably going to trash that. Packetbeat and Suricata are giving me everything I need. I figured I'd just start playing around with everything and trying to get it all happy, and then scale back to eliminate the redundant data based on what was giving me the most success.
I think the recommended configuration would be to have the beats running where the data originates, and then ship it over to Elasticsearch directly (or make it pass through Logstash if you need to refine the incoming data).
gregg1ep00
on 31 Mar 2020
@a3ilson I'd be happy to share my complete config with you if it helps you to get up and running quickly. Just let me know what you want to see and how to get it to you.
This discussion and this blog post talks about compiling beats for FreeBSD. Both were extremely valuable. I spun up a complete FreeBSD VM to do my compilation, as I wouldn't consider myself a FreeBSD expert.
There was a snag building Packetbeat on FreeBSD, and it had to do with dhcp:
root@freebsd_11-2_dev:~/go/src/github.com/elastic/beats/packetbeat # gmake
go build -ldflags "-X github.com/elastic/beats/libbeat/version.buildTime=2020-03-31T04:59:52Z -X github.com/elastic/beats/libbeat/version.commit=c1c49432bdc53563e63e9d684ca3e9843626e448"
../vendor/github.com/insomniacslk/dhcp/dhcpv4/client.go:93:8: undefined: BindToInterface
../vendor/github.com/insomniacslk/dhcp/dhcpv4/client.go:116:8: undefined: BindToInterface
gmake: *** [../libbeat/scripts/Makefile:121: packetbeat] Error 2
In that folder, there's bindtodevice_darwin.go and bindtodevice_linux.go, but no bindtodevice_freebsd.go. So I used bindtodevice_darwin.go as a starting point, copied that to bindtodevice_freebsd.go, and changed to this:
// +build freebsd

package dhcpv4

import (
        "net"
        "syscall"
)

func BindToInterface(fd int, ifname string) error {
        iface, err := net.InterfaceByName(ifname)
        if err != nil {
                return err
        }
        return syscall.SetsockoptInt(fd, syscall.IPPROTO_IP, syscall.IP_RECVIF, iface.Index)
}
Once I made this change, packetbeat was able to build properly.
This article and this mailing list helped.
gregg1ep00
on 31 Mar 2020
@gregg1ep00 - Would you mind sharing your completed config with a basic overview?
a3ilson
on 25 Apr 2020
Hi all
@somm15 thanks for posting the hint about parsing logs to local socket.
I'm struggling to send pfsense syslog information to this new filebeats socket listening on 9000 in my lab: see below
No matter what settings I put in the syslog pfsense configuration page, syslog info doesnt hit the socket
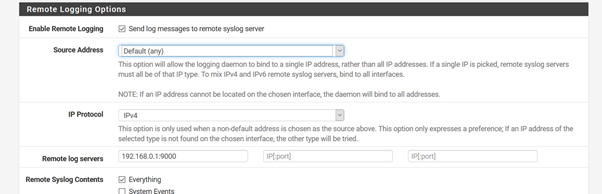
Filebeats config

I have tested and guaranteed information input in filbeats socket 9000 actually reaches kibana
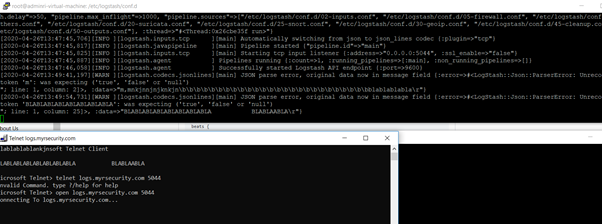
so doing a telnet from my computer to local ip address in pfsense on 9000 and sending the message BLABLABLA you can see actually it hits kibana, and it keeps the coding

I dont really understand how to force the syslog stream generated at pfsense level to hit the socket instanced with filebeats... appreciate your help here..
cheers guys!
 myrsecurity
on 26 Apr 2020
myrsecurity
on 26 Apr 2020
Disregard the above, SYSLOG is injecting into Filebeats port 9000 and sending to Kibana, the message is wrongly coded, which tells me syslog is sending in a weird collation .

myrsecurity
on 26 Apr 2020
@myrsecurity - Are you using syslog or syslog-ng? Everything I've read/seen points to having syslog-ng installed for beats to work.
a3ilson
on 26 Apr 2020
Ok, syslogng wasnt enabled (installed only ) Ive just enabled it.
The thing is I dont really know how syslogng should be configured beyond the defaults:
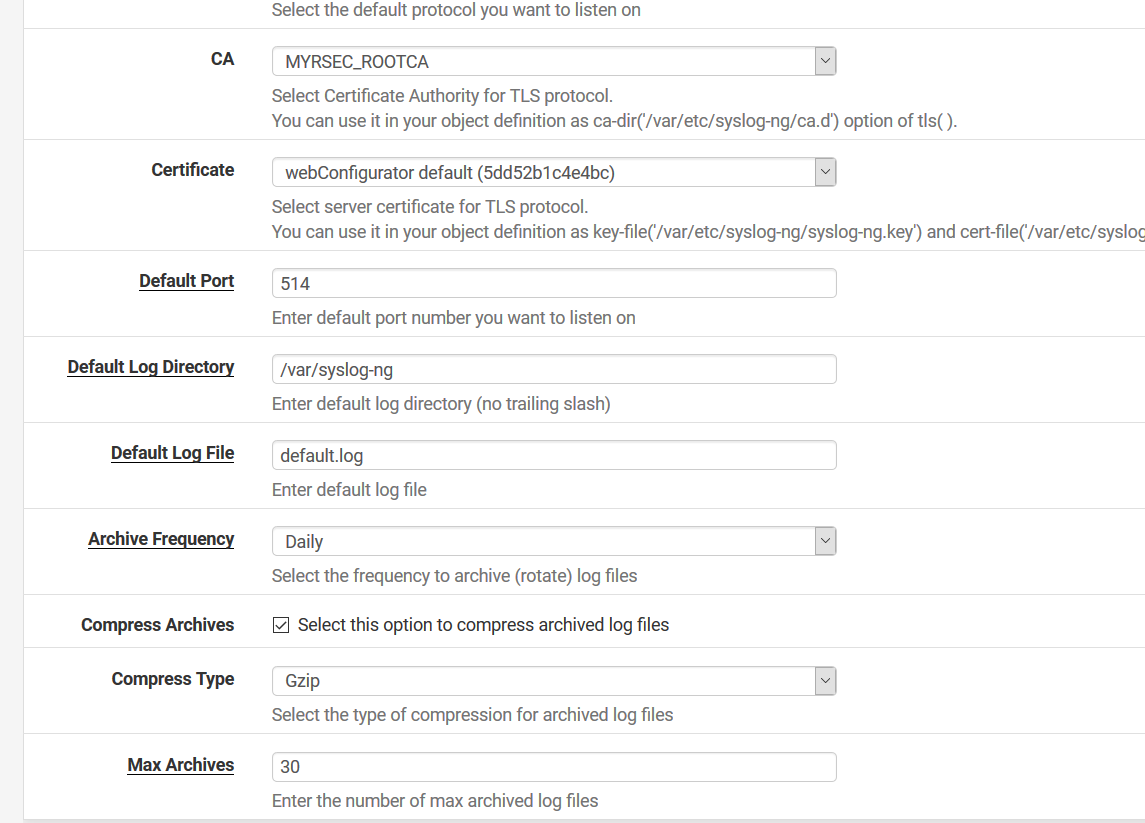
The content of the file that is being created on the referred path isnt comprehensive - none of the key information fields Im expecting to see over syslog ( dns, dhcpt, source destintations, suricatas snorts etc ) isnt there
Also Im not sure whether PFsense running beats, instancing a socket on 9000 from which syslog (normal syslog is received ) then upstream output to Elastic etc how and where syslogng will hook
myrsecurity
on 26 Apr 2020
@myrsecurity - I believe that is good...just need to have beats reference the default log directory and/or change the default log directory for beats to do it's magic.
a3ilson
on 26 Apr 2020
I am installing a pfSense VM and further assist and will likely have time throughout the week to.
a3ilson
on 26 Apr 2020
In other tests Ive donde Ive realized 2 things: \
a) when following by the book your method, input files take syslog UDP information, push it to filters - then upstream to elastic. Everything works and ELK is able to display te fancy dashboards (except some suricata info that is being parsed on the way.
b) In all my attempts replacing syslog UDP source as (filebeats source reading from file to filebeats destination ) or (filebeats source reading from file towards tcp socket destination ) the charset codification is changed along the 'encapsulation' introudcing filebeats 6.x specific information hence all your filters break being unable to put the parsed info in elastic..
I havent tested the new filter referenced above, that might make the trick...
Our overall objective is being able to read from remote firewalls - send via encrypted tunnel - filter in the way - insert it to a large elastic db - use your fancy dashboards for data mining
myrsecurity
on 27 Apr 2020
What is your ELK stack's version?
I believe that should match your Filebeat's version to avoid inconsistency.
Anyway the main purpose of Filebeat is to parse log files and when you are using the modules, you don't even need Logstash as a middle-man, because the (suricata) module itself take care of the parsing.
If you go this way, this configuration of filebeat might do the trick:
output.elasticsearch:
  hosts: ["myEShost:9200"]
Or do you need additional manipulation of the raw logs?
fktkrt
on 27 Apr 2020
It is the latest 7.5.2 ELK
I understand latest filebeats for freebsd 11 is 6.7 hence I went with that version, I agree it might breaks things on the way.
My assumption was that I for the suricata and firewall logs to be processed via pfelk project they need to hit the logstash filtering stack first, so then they are transformed in a way that the Kibana Dashboards are able to display it in a fancy manner.
I can send Filebeat to Elastic straight without hitting logstash, but I will loose all of the beautiful reporting this project is about. Also to be honest I couldnt make Suricata default ELK module to work.. when I click on Siem, Import Data, Suricata type, and clicked in logs, I see this
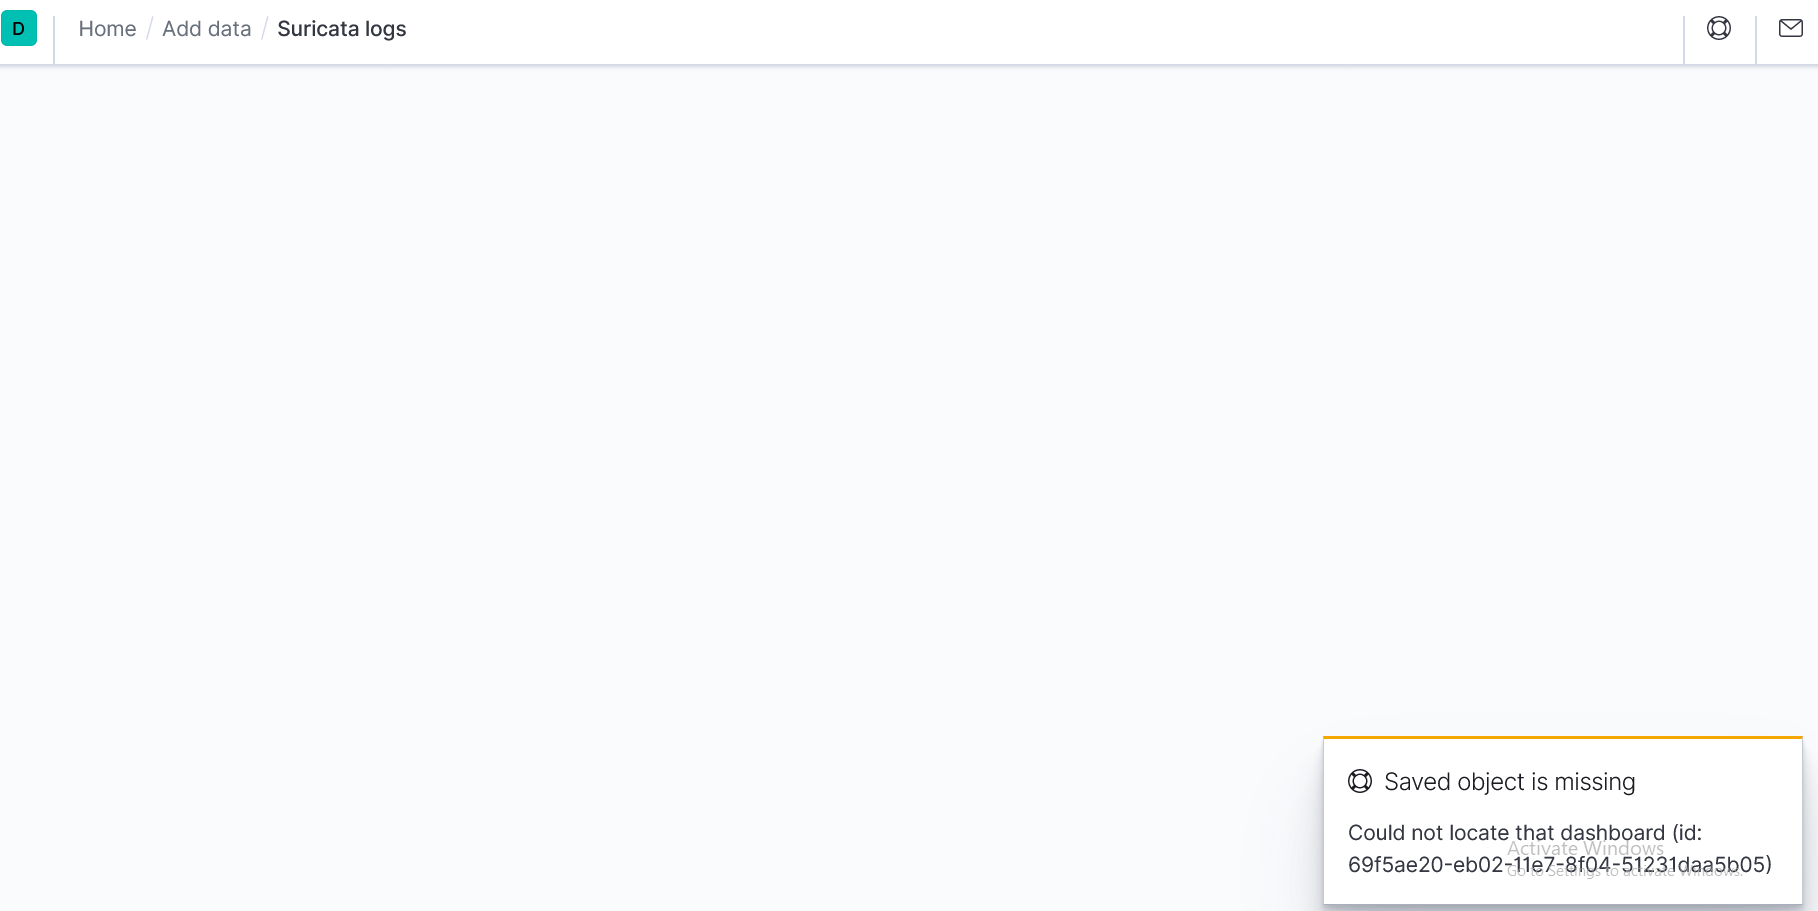
So it seems Suricata big data mining doesnt want to come up!
I wont give up until I get this done.
Cheers
myrsecurity
on 27 Apr 2020
Well, in that case yes. It appears compiling your own Filebeat on freebsd is the only way to go.
Apart from this, I think most of the pfelk users are forwarding ther logs via syslog by default, not sure if using syslog-ng can break things.
fktkrt
on 28 Apr 2020
configuring filebeats to talk directly to elastic I receive huge 'message' frames:

This is essentially from Filebeats module to elastic.
So messages are there, in the right charset, The problem is I dont have any of the nice reporting neither the pfelk reports nor the out of the box ELK suricata reports (must be an issue sending from 6.7 to 7.2, altered data structure )
Seems I need to hire a developer to pick and choose the right fields the message frame pushes to elastic so all of the unnecessary ones (from cyber security perspective) are filtered out. ...
Ive learned a lot spinning up this instance - from 0 to hero
myrsecurity
on 28 Apr 2020
one last thing that Ive just clicked....
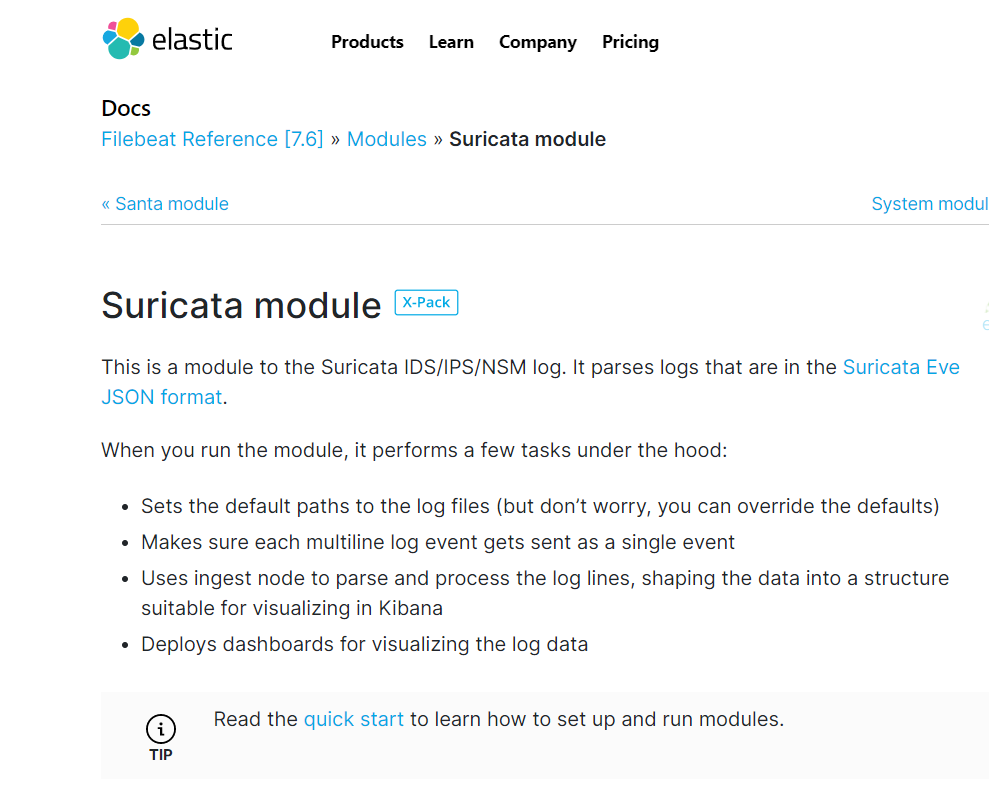
All of the out of the box suricata dashboard is under X-Pack license...
myrsecurity
on 28 Apr 2020
@myrsecurity - What is your timeframe on the need some visualizations? Your 90% there... I'm typically busy with work during the week but I can make time to assist if needed. I finally got around to getting a pfSense instance running (VM) and had planned to replicate and provide instructions (Wiki).
As for dashboards, I am hoping OPNsense will upgrade to Suricata 5 as I plan to utilize the Suricata Dashboards created by SELKS (https://github.com/StamusNetworks/KTS7). You can see a glimpse of them at https://www.youtube.com/watch?v=fMyRfYVcUUI skip to 21:57. Furthermore, Evebox might be another addition...not sure what your end state is.
a3ilson
on 28 Apr 2020
Thank you. I dont have deadline as per yet, we are evaluating Splunk vs Elastic for a cyber sec project hence we need suricata definitions properly displayed. A team of analysts are expected to leverage these short of functioality for Threat Hunting etc.
I tried Splunk and that project SELKs you mention to visualize the suricata alerts, not too bad good thing is that Universal Forwarders are so much simple to install and configure + the traffic is encrypted, by default. Downside is 3 pfsenses fill 500GB daily splunk allowance in 12 hours :)
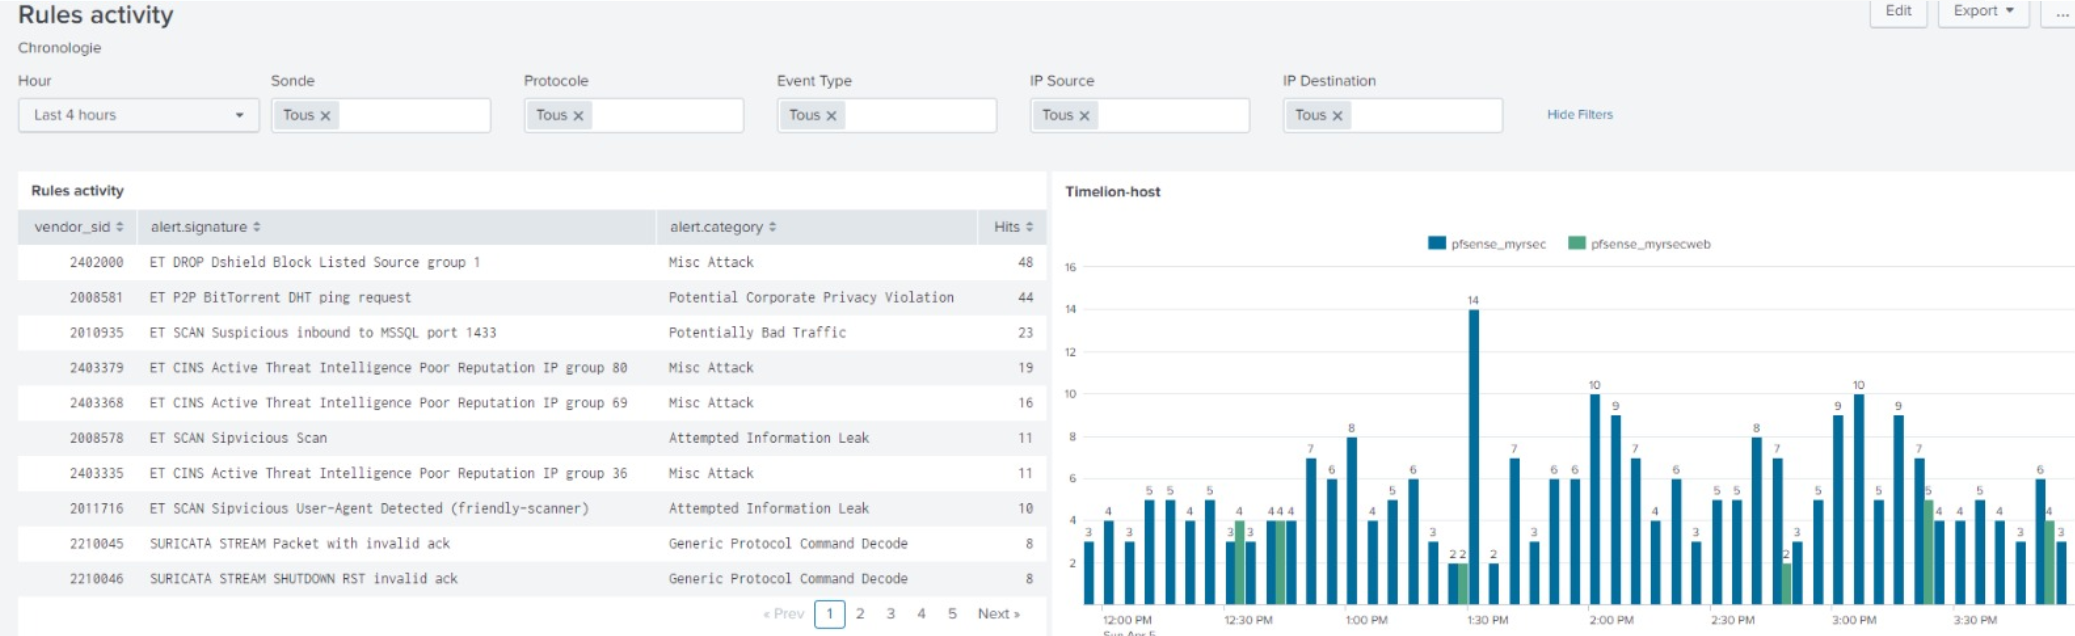
might be other projects coming in too...
myrsecurity
on 28 Apr 2020
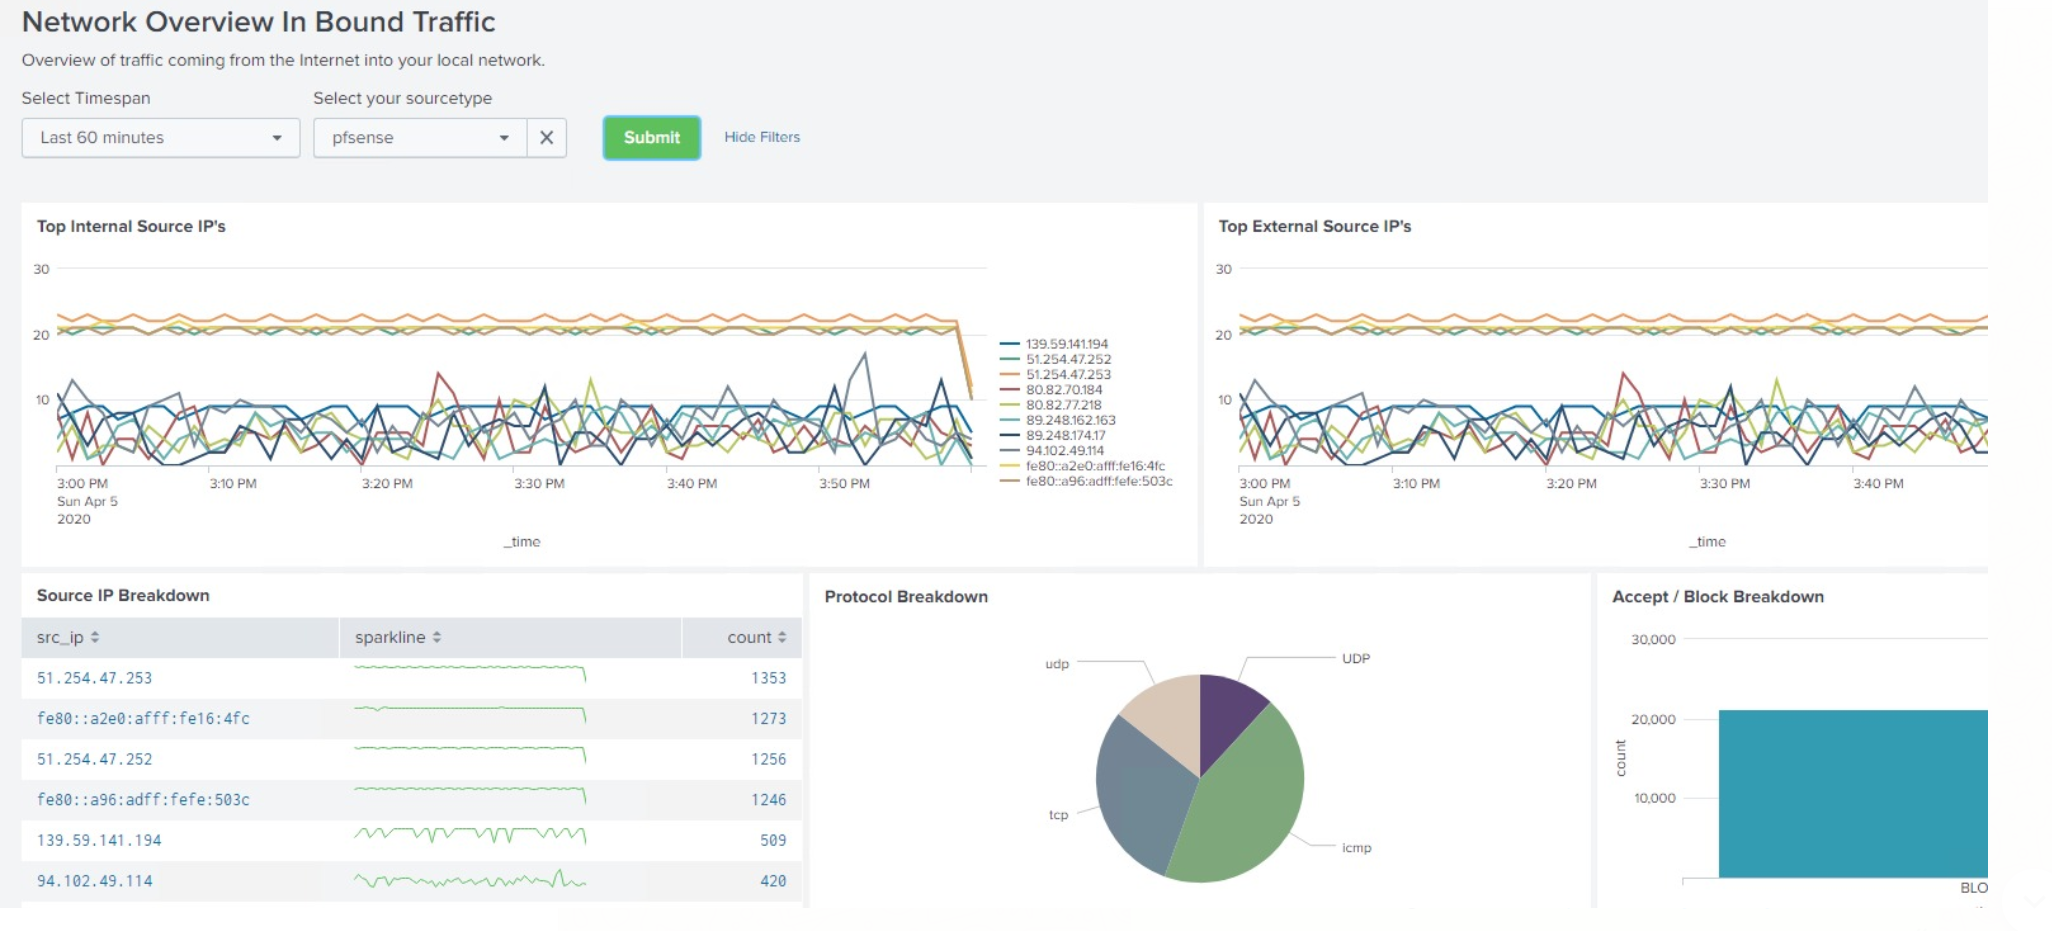
I think I still keep the Splunk instance somewhere, all of that was configured up and running - need to check Splunk prices though vs Elastic prices.
myrsecurity
on 28 Apr 2020
@a3ilson
As for dashboards, I am hoping OPNsense will upgrade to Suricata 5 as I plan to utilize the Suricata Dashboards created by SELKS (https://github.com/StamusNetworks/KTS7).
Have you seen this. https://forum.opnsense.org/index.php?topic=16545.msg75320#msg75320 It looks like Suricata 5 is on the list for the 20.7 release (July 2020). Crossing Fingers
rrosson
on 29 Apr 2020
@a3ilson here's my small setup.
Ubuntu 18.04 monitoring box
- Elasticstack 7.6.1
- Kibana 7.6.1
Filebeat 7.6.1
- Netflow module (receiving from softflowd on pfSense)
pfSense 2.4.5
Filebeat 7.6.1
- System module (picking up syslog-ng logs locally, outputs to elasticstack directly)
- Suricata module (picking up EVE logs locally, outputs to elasticstack directly)
Packetbeat 7.6.1
- Outputs to elasticstack directly
I compiled beats on a FreeBSD VM, then shipped the binaries to pfSense. The other supporting files (modules, dashboards, etc.) were just extracted from the Linux archive, since those seemed to be more complete than the stuff I pulled from source. Getting beats to compile on BSD was not straightforward at all.
On pfSense, I had to place things on the filesystem in areas that would remain safe during system upgrades:
- /usr/local/etc: beats configs (filebeat.yml, packetbeat.yml)
- /var/db/beats: data, logs, kibana dashboards, and modules
- /usr/local/sbin: beats binaries (filebeat, packetbeat, *beat)
- /usr/local/etc/rc.d: beats startup scripts
There is actually an old beats pkg that I was able to install (not in pfSense, but just regular BSD) to help me out with these paths, but since I wanted to use 7.6.1, the binaries were replaced, and the supporting folders were brought over from the Ubuntu box.
Of course there are 47 billion ways to slice the onion, but since I'm using the syslog ingest pipeline to grok the pfSense logs, I really don't need the overhead of running Logstash.
Hi @gregg1ep00 ,
I'm very appreciate if you could share with me how to install Filebeat and Packetbeat on pfSense?
I'm using pfSense 2.4.5 but can't found anyway to install them. Just only port version 6.7.8 of Beats installed and it not work.
Thanks & Regards
 tientmse62290
on 25 May 2020
tientmse62290
on 25 May 2020
Hi
Came across this article blog post on FILEBEAT 7.8 ON PFSENSE 2.4.5 dated August 16, 2020.
Thanks
 donaldf26
on 12 Jan 2021
donaldf26
on 12 Jan 2021
@donaldf26 - here is a recent build for FreeBSD with the latest binaries: https://github.com/omniitgmbh/beats/releases/tag/v7.10.2
However, it is unlikely we’ll support until and unless the install is fully supported - right now it appears to be somewhat of a hodgepodge. Furthermore, those leveraging Filebeat will not likely need pfelk as most processes are supported with various built-in modules (except the firewall and it shouldn’t take much to get this working versus pivoting pfelk to work with filebeat).
it’s possible but currently it would likely yield more issues/troubleshooting than solutions (i.e. is the effort [time] worth the outcome)
a3ilson
on 18 Jan 2021
no longer pursing filebeat citing complexities installing, configuration and lacking support for BSD.
a3ilson
on 18 Jan 2021
Related issues
 s7thamon
·
22Comments
s7thamon
·
22Comments
 geomaraugusto
·
13Comments
s7thamon
·
14Comments
geomaraugusto
·
13Comments
s7thamon
·
14Comments
 BeNeDeLuX
·
13Comments
BeNeDeLuX
·
13Comments
 squirrelboot
·
12Comments
squirrelboot
·
12Comments