Describe the bug
Bar Graphs for _Top Ten Countries_ and _Top IPs Blocked_ appear to always be stacked, despite the setting off in the visualization.
Screenshots
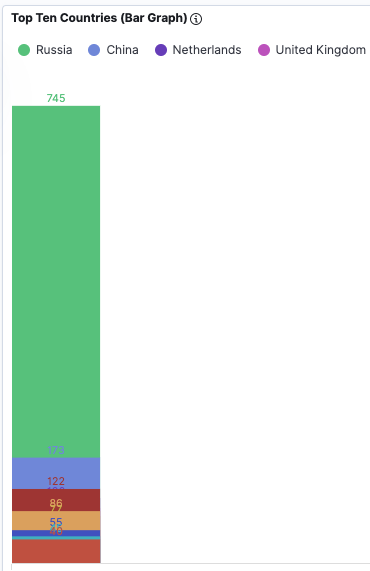
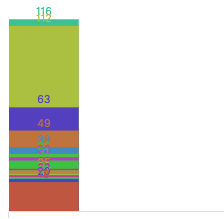
Firewall System (please complete the following information):
OPNsense
Operating System (please complete the following information):
Ubuntu 20.04
Installation method (manual, ansible-playbook, docker, script):
bash install script
Elasticsearch, Logstash, Kibana (please complete the following information):
kibana 7.9.0
 s7thamon
All 22 comments
@s7thamon - This may be related to the 7.9.0 release. I am currently building new dashboards.
 a3ilson
on 26 Aug 2020
a3ilson
on 26 Aug 2020
I rolled back to 7.8.1 and it does appear to work fine with that version. Still tinkering with trying to figure out the issue in 7.9, not able to find anything yet.
I like some of the new stats on the dashboard. The top 10 countries/ips blocked are pretty key on this end.
s7thamon
on 26 Aug 2020
I would delete the visualization from your dashboard. Then create a new visualization...I'd recommend 'Lens-beta' and drag the destination.geo.country_name.keyword field into the area and select the bar graph. You'll also need to adjust the display number by selecting the x-axis value.
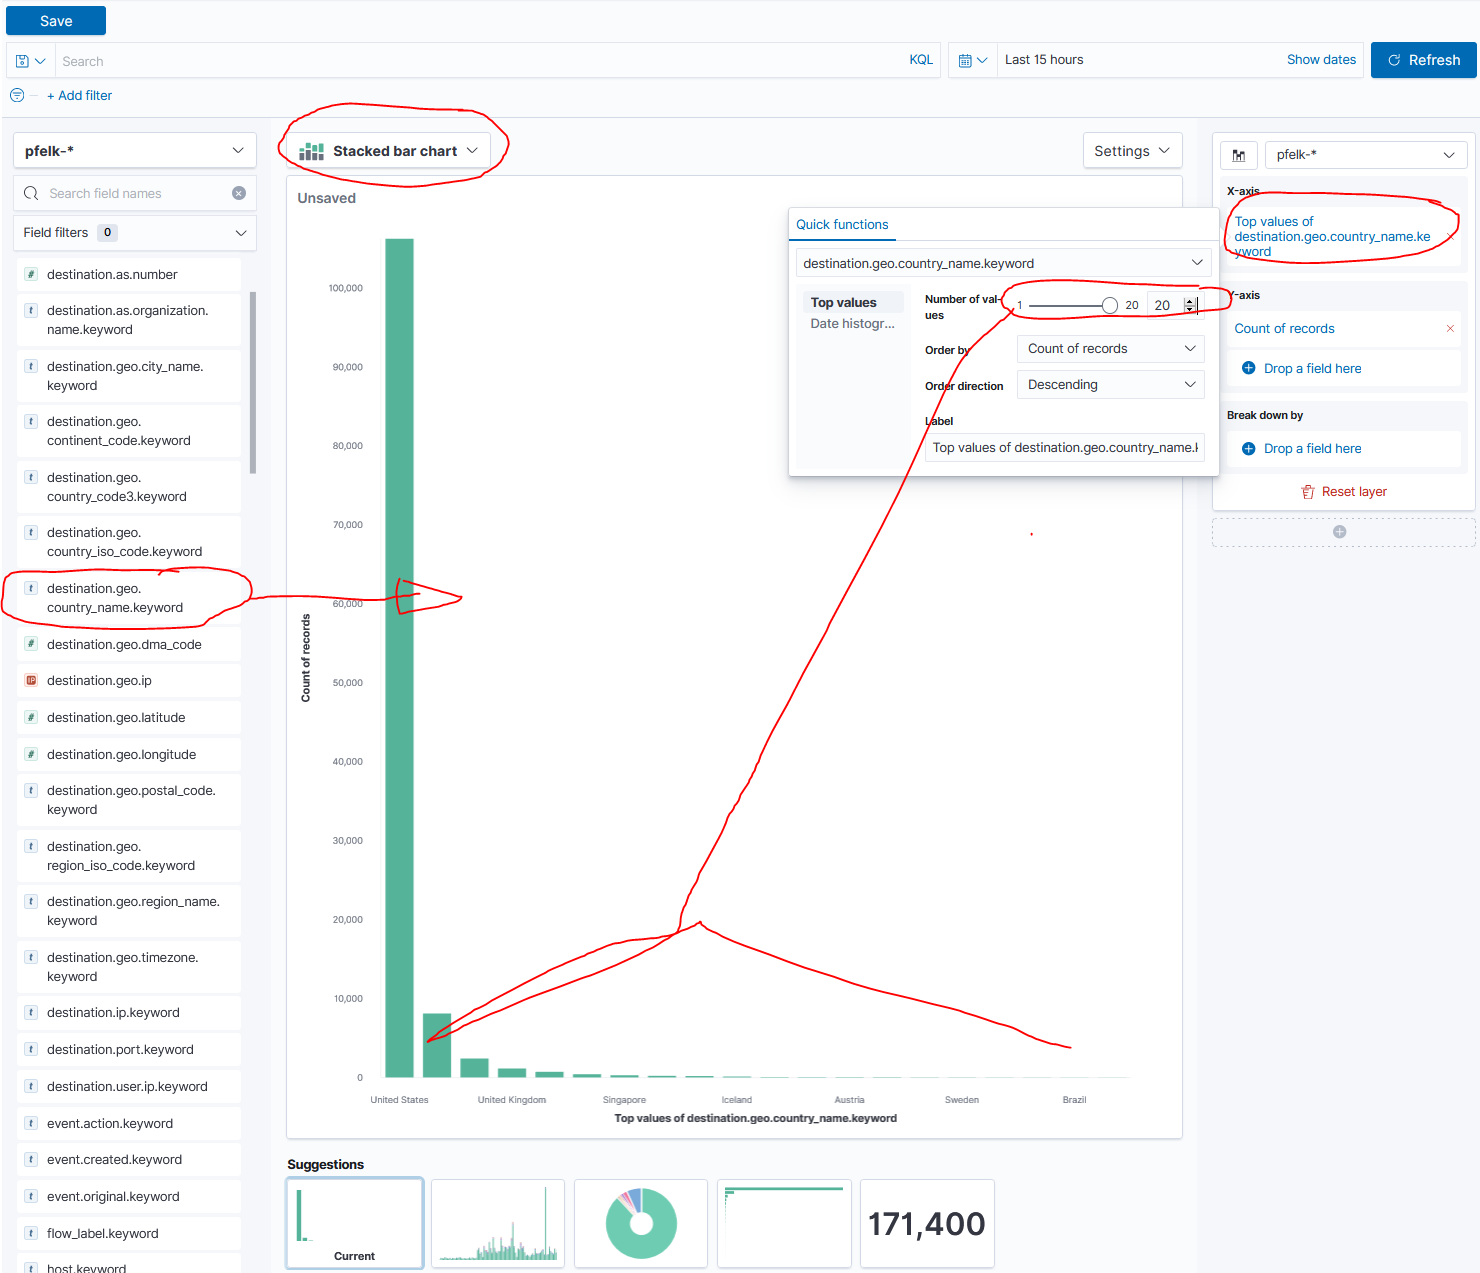
Then go back and edit the dashboard and insert the new visualization.
a3ilson
on 26 Aug 2020
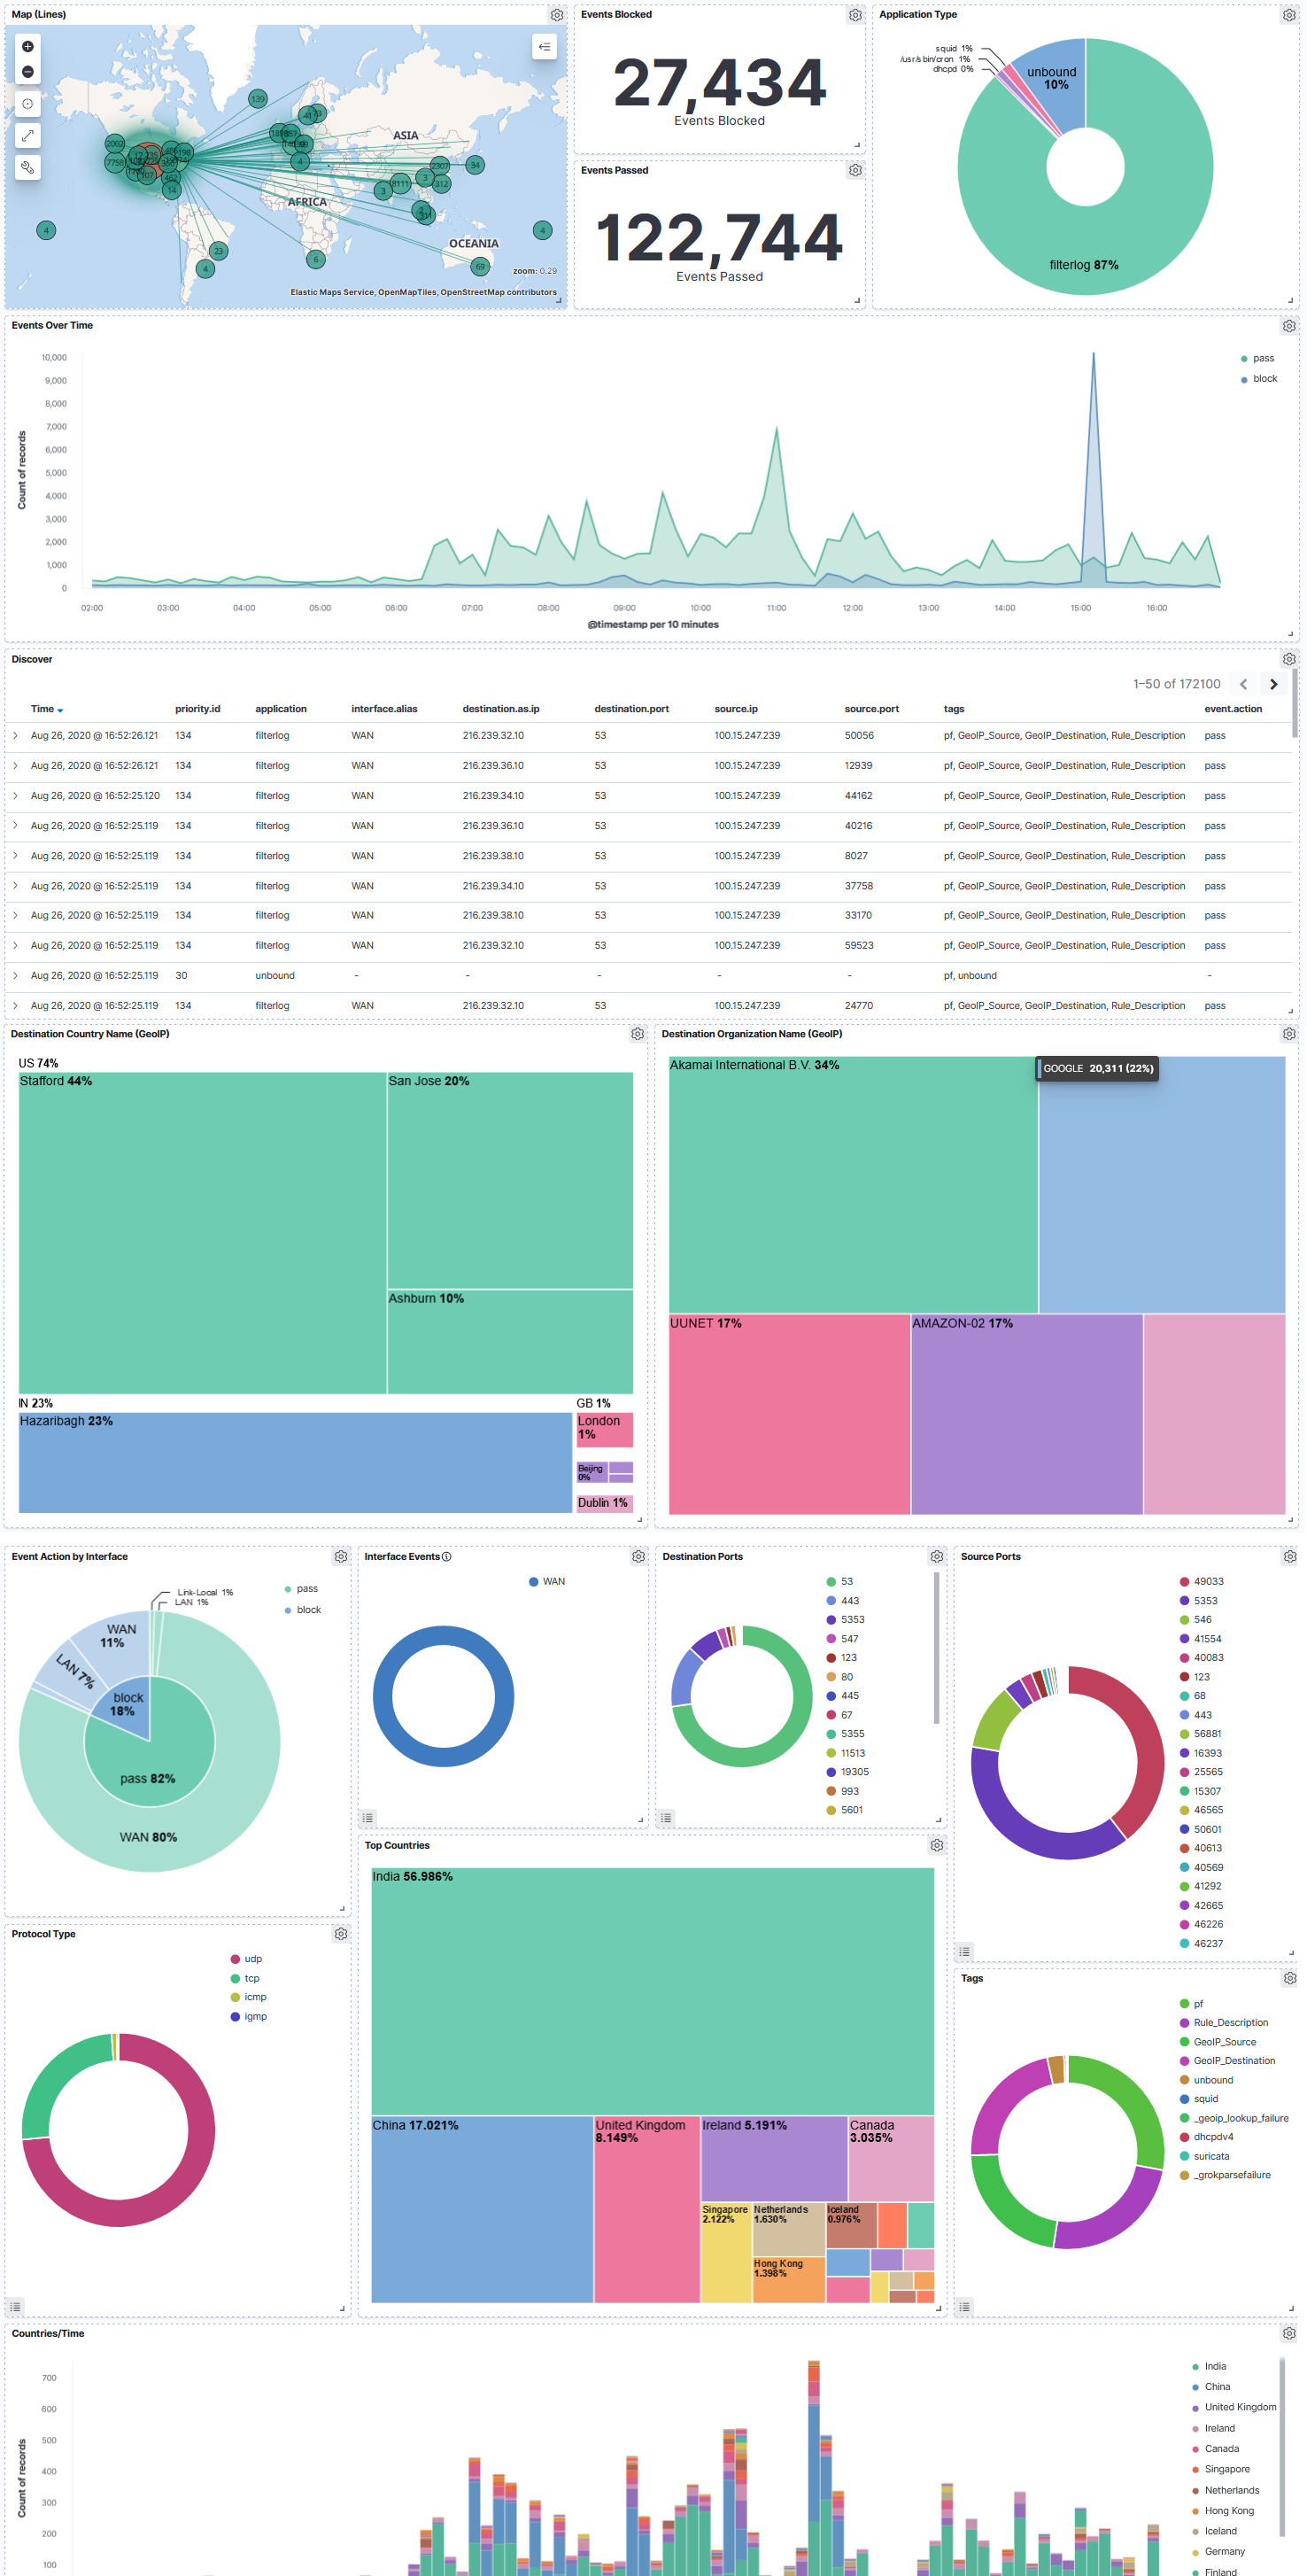
Thanks for the input... below is the dashboard for the updated pfelk.
a3ilson
on 26 Aug 2020
Appreciate it, looks like this will work for now using the lens feature. Not as nice since it's missing the legend - will wait for the updated dashboard. Cheers!
s7thamon
on 26 Aug 2020
@s7thamon - New Dashboard and setup files were updated/posted...it will require re-indexing, due to a number of changes.
a3ilson
on 27 Aug 2020
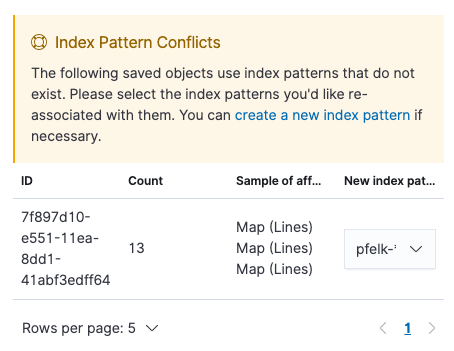
[lens_merge_tables] > [esaggs] > Could not locate that index-pattern (id: 7f897d10-e551-11ea-8dd1-41abf3edff64), [click here to re-create it](management/kibana/indexPatterns)
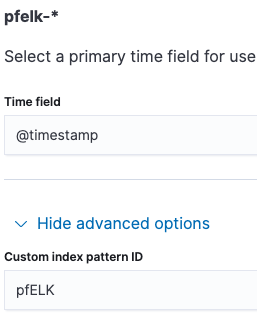
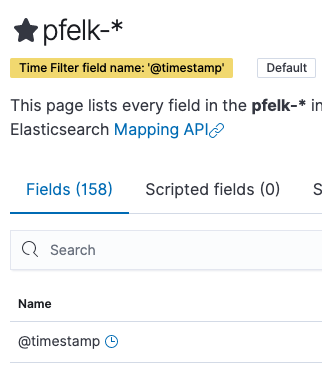
Using the new dashboards, getting a lot of index-pattern errors. I removed the old index and dashboards, and imported everything as new. Conf files all updated and overwritten. The data coming into 'Discover' in Kibana looks fine.
s7thamon
on 27 Aug 2020
@s7thamon - I realized this earlier today. All but the firewall dashboard was rebuilt. Give me a few and I'll have it correct.
a3ilson
on 27 Aug 2020
Updated. Give the Firewall Dashboard another try and sorry for the inconvenience.
a3ilson
on 27 Aug 2020
Thanks, looks like all is working but the last panel for: "Firewall - Map (Lines)"
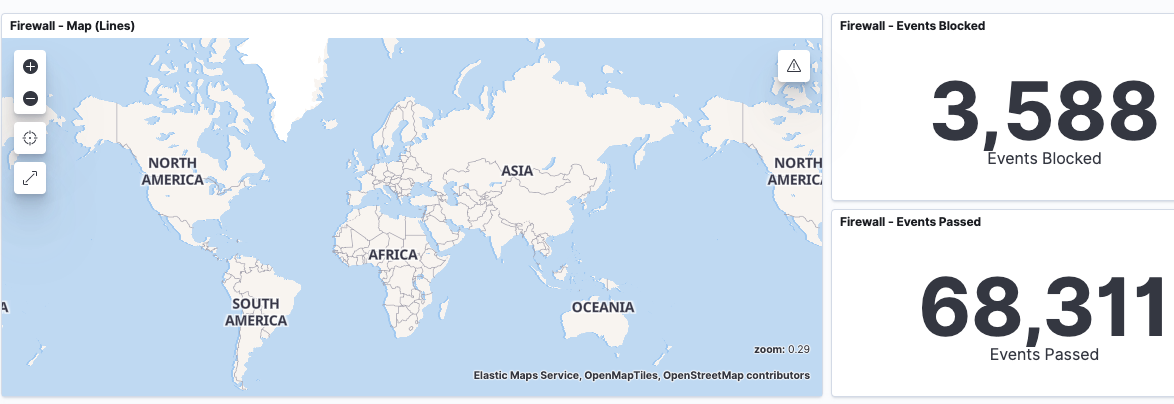
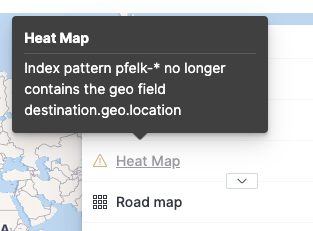
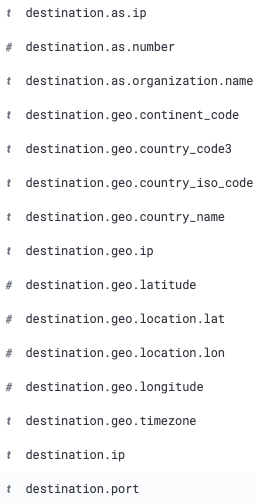
The "Firewall - Map (Country)" seems okay
s7thamon
on 27 Aug 2020
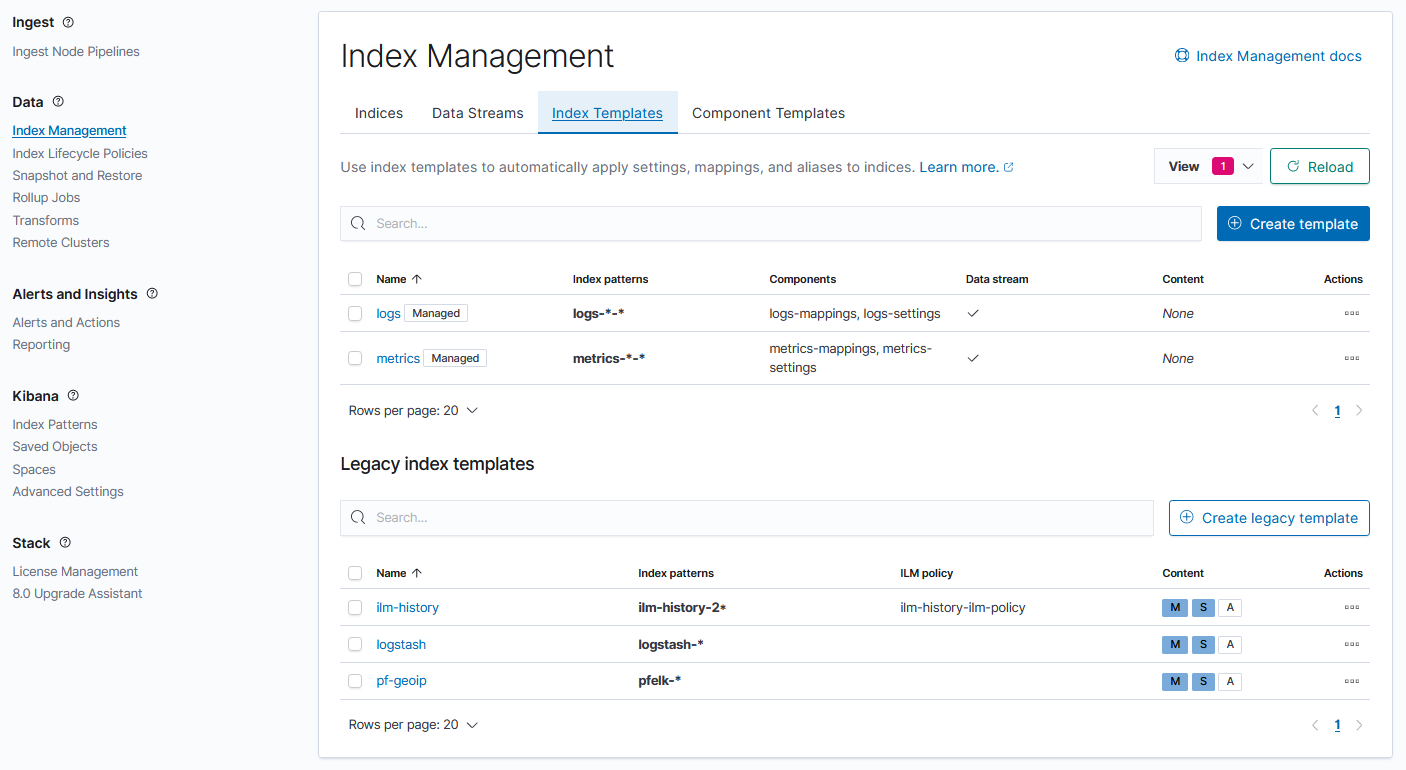
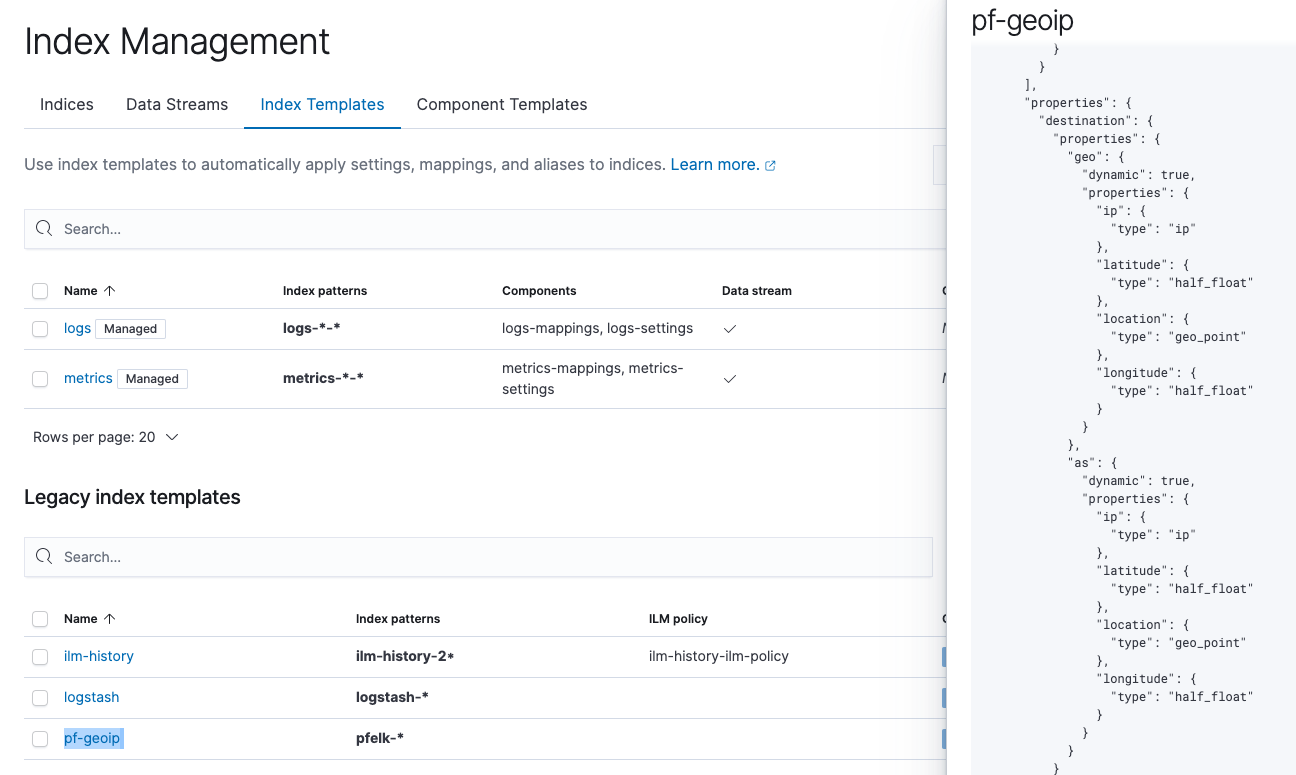
Please check to see if the template (pf-geoip) was installed.
Management>Stack Management>>Data>>Index Management>>Index Template
a3ilson
on 27 Aug 2020
ive deleted and removed the index template, and also removed anything old from the ingest pipelines, and this is still happening for me as well. I'm continuing to dig.
 revere521
on 27 Aug 2020
revere521
on 27 Aug 2020
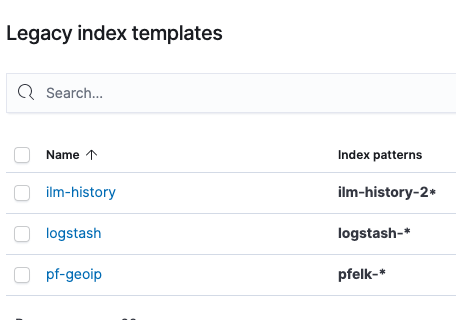
Can confirm it's installed
s7thamon
on 27 Aug 2020
Can you confirm the contents of pf-geoip.conf
{
  "index_patterns" : "pfelk-*",
  "version" : 80001,
  "settings" : {
    "index.refresh_interval" : "5s",
    "number_of_shards": 2
  },
  "mappings" : {
    "dynamic_templates" : [ {
      "message_field" : {
        "path_match" : "message",
        "match_mapping_type" : "string",
        "mapping" : {
          "type" : "text",
          "norms" : false
        }
      }
    }, {
      "string_fields" : {
        "match" : "*",
        "match_mapping_type" : "string",
        "mapping" : {
          "type" : "text", "norms" : false,
          "fields" : {
            "keyword" : { "type": "keyword", "ignore_above": 256 }
          }
        }
      }
    } ],
    "properties" : {
      "destination": {
        "properties": {
          "geo": {
            "dynamic": true,
            "properties": {
              "ip": { "type": "ip" },
              "location" : { "type" : "geo_point" },
              "latitude" : { "type" : "half_float" },
              "longitude" : { "type" : "half_float" }
            }
          }
        }
      },
      "source": {
        "properties": {
          "geo": {
            "dynamic": true,
            "properties": {
              "ip": { "type": "ip" },
              "location" : { "type" : "geo_point" },
              "latitude" : { "type" : "half_float" },
              "longitude" : { "type" : "half_float" }
            }
          }
        }
      }
    }
  }
}
Yes it exists and is identical to what is posted above
s7thamon
on 27 Aug 2020
Give the previous one (below) a try... I only update the index pattern. The original contains the "as" fields which do not contain GeoIP data:
{
  "index_patterns" : "pfelk-*",
  "version" : 80001,
  "settings" : {
    "index.refresh_interval" : "5s",
    "number_of_shards": 2
  },
  "mappings" : {
    "dynamic_templates" : [ {
      "message_field" : {
        "path_match" : "message",
        "match_mapping_type" : "string",
        "mapping" : {
          "type" : "text",
          "norms" : false
        }
      }
    }, {
      "string_fields" : {
        "match" : "*",
        "match_mapping_type" : "string",
        "mapping" : {
          "type" : "text", "norms" : false,
          "fields" : {
            "keyword" : { "type": "keyword", "ignore_above": 256 }
          }
        }
      }
    } ],
    "properties" : {
      "destination": {
        "properties": {
          "geo": {
            "dynamic": true,
            "properties": {
              "ip": { "type": "ip" },
              "location" : { "type" : "geo_point" },
              "latitude" : { "type" : "half_float" },
              "longitude" : { "type" : "half_float" }
            }
          },
          "as": {
            "dynamic": true,
            "properties": {
              "ip": { "type": "ip" },
              "location" : { "type" : "geo_point" },
              "latitude" : { "type" : "half_float" },
              "longitude" : { "type" : "half_float" }
            }
          }
        }
      },
      "source": {
        "properties": {
          "geo": {
            "dynamic": true,
            "properties": {
              "ip": { "type": "ip" },
              "location" : { "type" : "geo_point" },
              "latitude" : { "type" : "half_float" },
              "longitude" : { "type" : "half_float" }
            }
          },
          "as": {
            "dynamic": true,
            "properties": {
              "ip": { "type": "ip" },
              "location" : { "type" : "geo_point" },
              "latitude" : { "type" : "half_float" },
              "longitude" : { "type" : "half_float" }
            }
          }
        }
      }
    }
  }
}
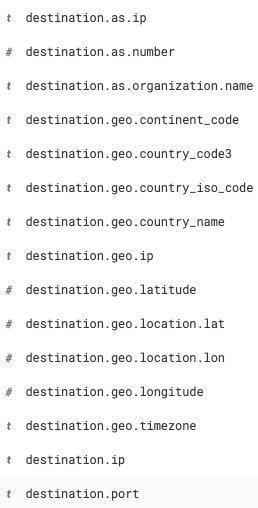
Confirmed 'pf-geoip' now contains "as" in Kibana and logstash conf. Location still appears missing, destination.geo.latitude and destination.geo.longitude appear fine
s7thamon
on 27 Aug 2020
You'll need to purge your index when updating/revising the templates
a3ilson
on 27 Aug 2020
going back an deleting the new pfelk-* index and then waiting and refreshing the index pattern a few times resolved my issue.
revere521
on 28 Aug 2020
Cool beans!
So to remedy in the future:
- stop logstash
systemctl stop logstash.service - delete the Kibana Index Pattern
- delete the Elastic Indices
- start logstash
systemctl start logstash.service
a3ilson
on 28 Aug 2020
That did the trick. I had deleted the index pattern but didn't flush the indices. Looks good now :)
s7thamon
on 28 Aug 2020
Issue resolved
a3ilson
on 28 Aug 2020
Related issues
 squirrelboot
·
12Comments
squirrelboot
·
12Comments
 myrsecurity
·
12Comments
myrsecurity
·
12Comments
 ledge39
·
7Comments
ledge39
·
7Comments
 wylde780
·
12Comments
wylde780
·
12Comments
 mango1122
·
3Comments
mango1122
·
3Comments