Mini-graph-card: Daily aggregration bar failed to display correct number
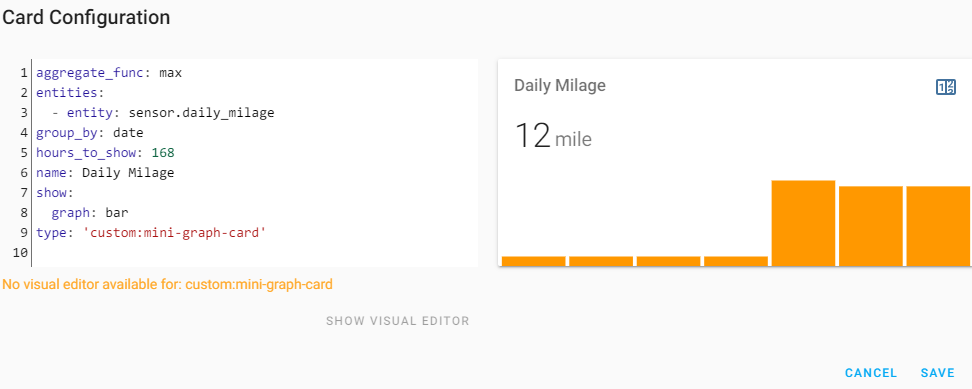
Hello, I'm having an issue to display daily data as shown below.
JS version: 0.8.2
HA Version: 0.100.2
As shown in the below picture, the daily usage can not be displayed correctly. Any suggestions on the config?
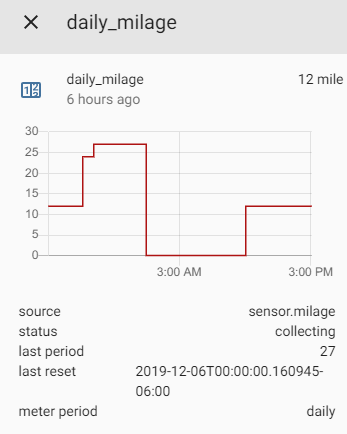
While HA historical shows this.
Appreciate your time looking into this.
 lovejoey11
All 15 comments
Hey,
There are some issues with local caching of history data which I believe is the root of this issue.
It should hopefully be resolved in the latest beta release found here.
After updating to the beta the cache should sort itself out with time, but you can also clear it manually by changing hours_to_show to something else, refresh the page with the card and then change hours_to_show back.
There's also a new option in the beta release to disable cache completely cache: false, which you could try if you're still having issues after trying the above.
 kalkih
on 11 Dec 2019
kalkih
on 11 Dec 2019
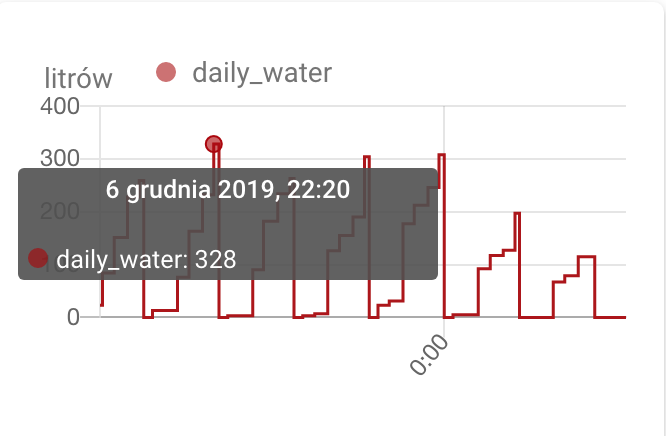
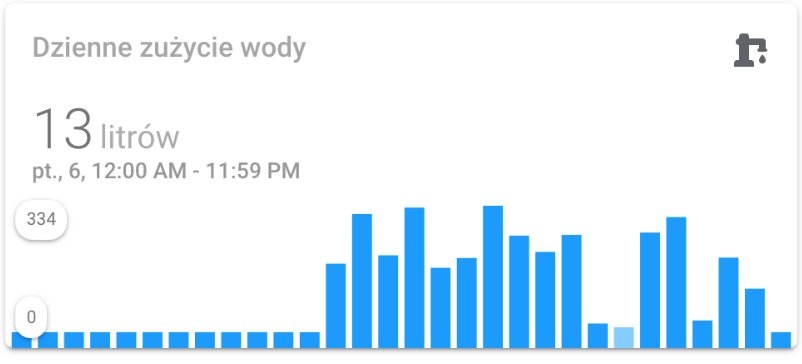
I'm using version from github with new "cache: false" option and the bug is still there. It show especially on last bar but also on others.
aggregate_func: max
cache: false
entities:
  - color: '#0399ff'
    entity: sensor.daily_water
    name: Dzienne zużycie wody
group_by: date
hours_to_show: 720
icon: 'mdi:water-pump'
show:
  graph: bar
type: 'custom:mini-graph-card'
 dzikus
on 12 Dec 2019
dzikus
on 12 Dec 2019
I did observe the same issue with 0.8.2, however, with 0.9.0-beta from releases and cache: false the issue seems to be resolved for me.
 agners
on 29 Dec 2019
agners
on 29 Dec 2019
I was convinced that I was using the latest version, but I used 0.8.2. It works fine after the upgrade.
dzikus
on 30 Dec 2019
@dzikus a bit off-topic question: how do you measure water usage? Dzięki :wink:
 Misiu
on 4 Jan 2020
Misiu
on 4 Jan 2020
@Misiu https://github.com/weetmuts/wmbusmeters Nie ma za co ;)
dzikus
on 6 Jan 2020
Hey,
I have a bit of a different situation, where going to an incognito tab did not solve my problem. I have the following card configuration:
type: 'custom:mini-graph-card'
height: 100
font_size: 70
hours_to_show: 168
aggregate_func: max
lower_bound: 0
group_by: date
show:
  graph: bar
entities:
  - sensor.daily_power_usage
So it should show the daily power usage for 7 days. However, in the bar graph that I have, the first column (so the one from 7 days ago) displays the power usage of yesterday, and the other 6 bars show the power usage of today (all 6 the same value). If I look at the sensor.daily_power_usage, the correct daily values are displayed. What am I missing?
 plangenhuizen
on 9 Jan 2020
plangenhuizen
on 9 Jan 2020
@plangenhuizen
cache: false
@plangenhuizen That kind of sounds like an issue that was fixed in v0.8.2
FIXED
- Invalid rendering when group by date missed data for complete date(s) #183 (#187)
- Rendering of additional bars in one bar graphs (#186)
Can you double check and make sure you're on v0.8.2 or v0.9.0-beta, clearing cache e.t.c. (you tried incognito so cache shouldn't be an issue I guess).
If you've installed the card with HACS also please check this https://github.com/kalkih/mini-graph-card/issues/169
kalkih
on 9 Jan 2020
@dzikus No, I don't think it is a caching problem.
@kalkih Thanks for the reply. From what I see in the fix that you linked, the mini graph card tries to fill in missing data. I guess that is indeed what is happening in my case. The daily power usage is a new sensor, so it is missing data. Indeed, this morning I noticed that the power used yesterday was displayed in the second column, while keeping the usage of the day before in the first column. So, I am guessing that in 5 days I will have a correct bar chart 👍
plangenhuizen
on 10 Jan 2020
@plangenhuizen I had that problem too, the value of the initial day I made the daily power usage graph was "copied" back in history for the complete week. But now it's more a week ago so my graph looks good :-)
FWIW, I see similar behavior also for other graphs. I also have a sensor which goes unavailable every now and then. The built-in history graph then does not display a line, however mini-graph-card just uses the last value and draws the line even though there is no value (which I think is not ideal).
agners
on 11 Jan 2020
I'm using history_stats to get my furnace runtime for the last hour, and I ran into this same issue. Adding cache: false didn't help, but changing the hours to show value to something else and back did. At least for now, I'll check again tonight.
 valantur
on 15 Jan 2020
valantur
on 15 Jan 2020
@valantur
cache: false will only work on the latest beta version v0.9.0-beta, If you've updated to the beta version make sure you're actually loading the new version and not the old version from cache, try clearing the browser cache or if you've installed with HACS check https://github.com/kalkih/mini-graph-card/issues/169.
kalkih
on 15 Jan 2020
@kalkih Thanks for looking into this. Clearing cache and new version both works for me. I will now close the comment. Thanks for your effort to make this nice widget! Have a good one.
lovejoey11
on 29 Jan 2020
Thanks @lovejoey11,
I think closing this issue is the right call.
There will be a new "stable" release soon and if you face this or any other issue after updating to that release please open another issue 🙏
Thank you all!
kalkih
on 29 Jan 2020
Related issues
 skarfacegc
·
7Comments
skarfacegc
·
7Comments
 yadenisenko
·
4Comments
yadenisenko
·
4Comments
 pejotigrek
·
6Comments
pejotigrek
·
6Comments
 hajo62
·
6Comments
hajo62
·
6Comments
 balloob
·
4Comments
balloob
·
4Comments