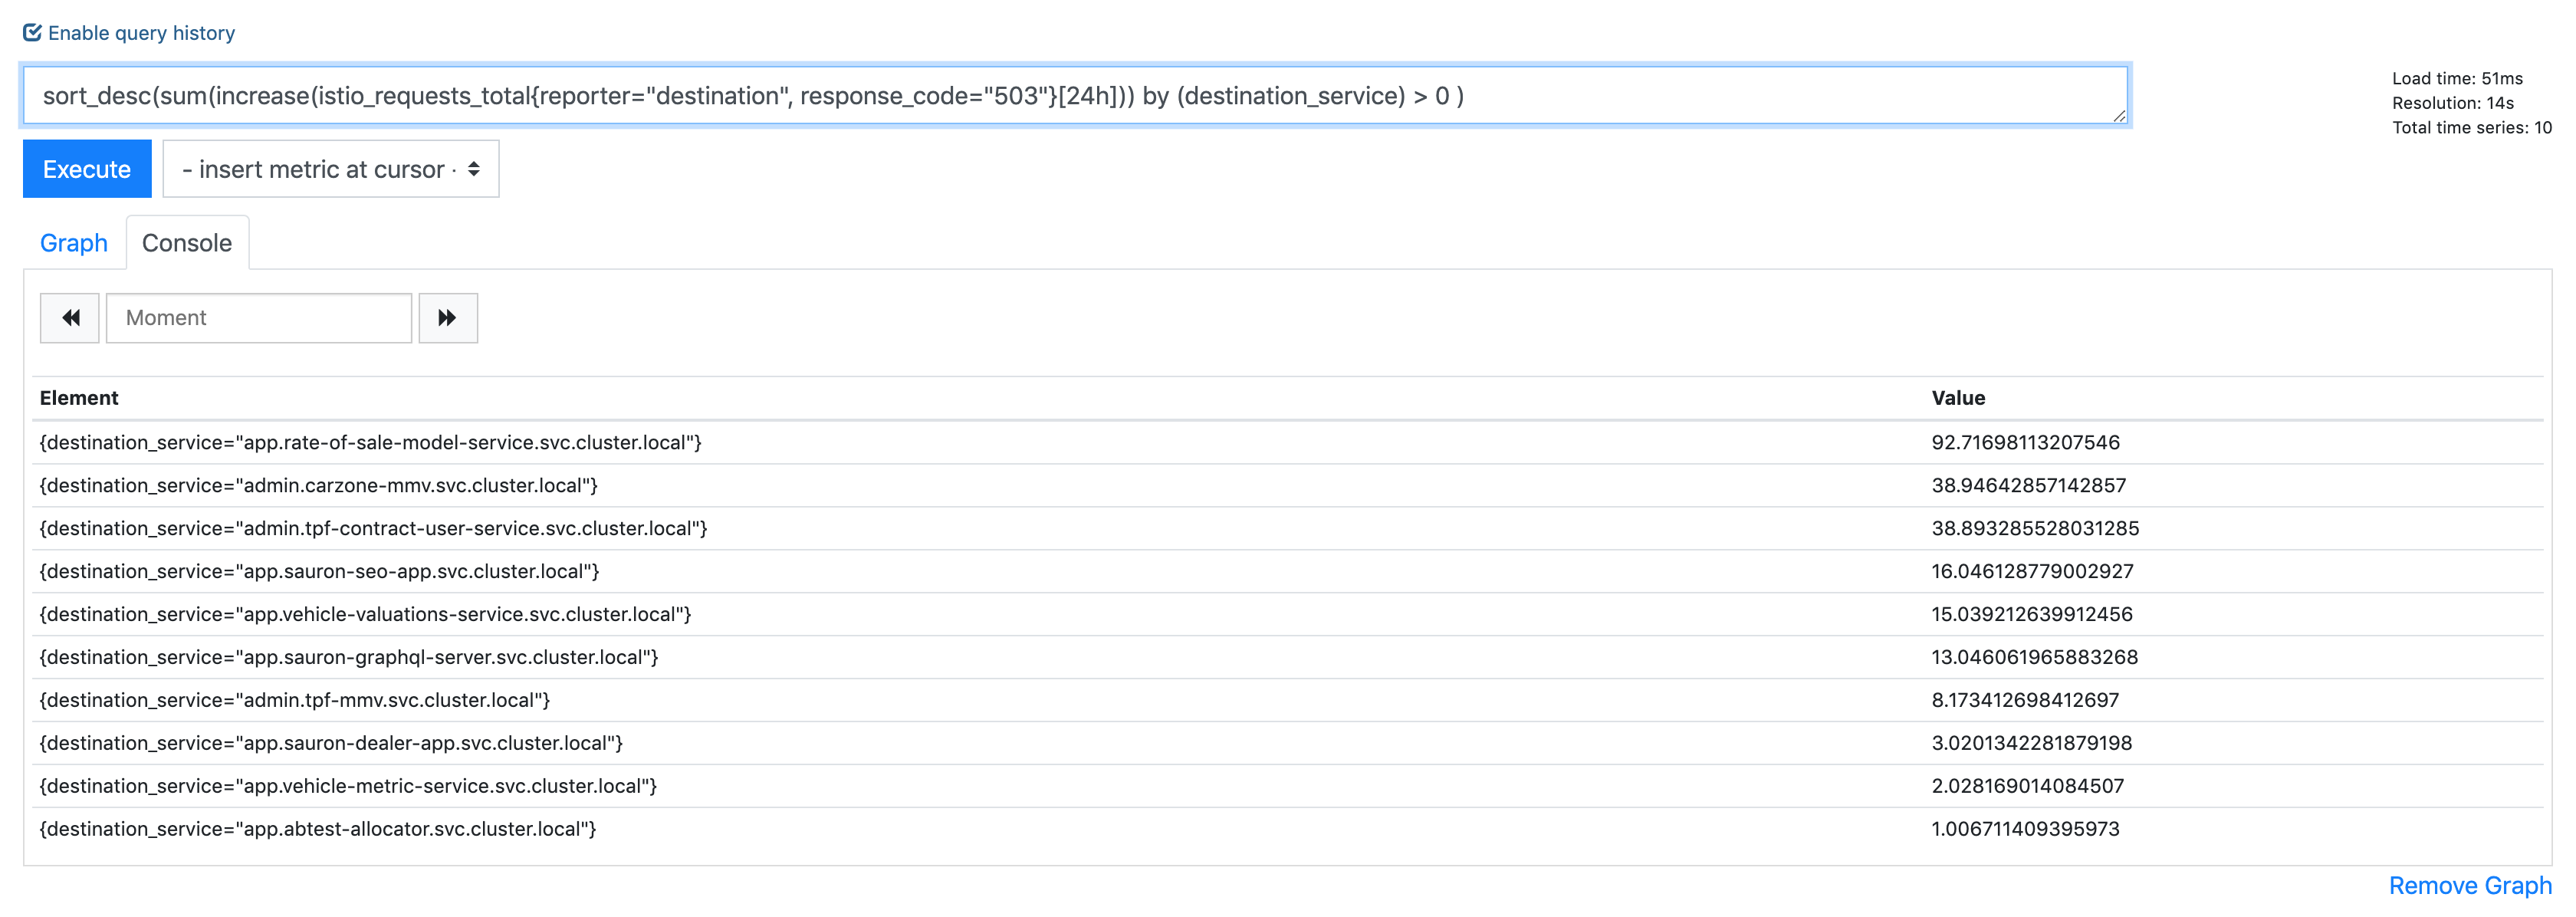
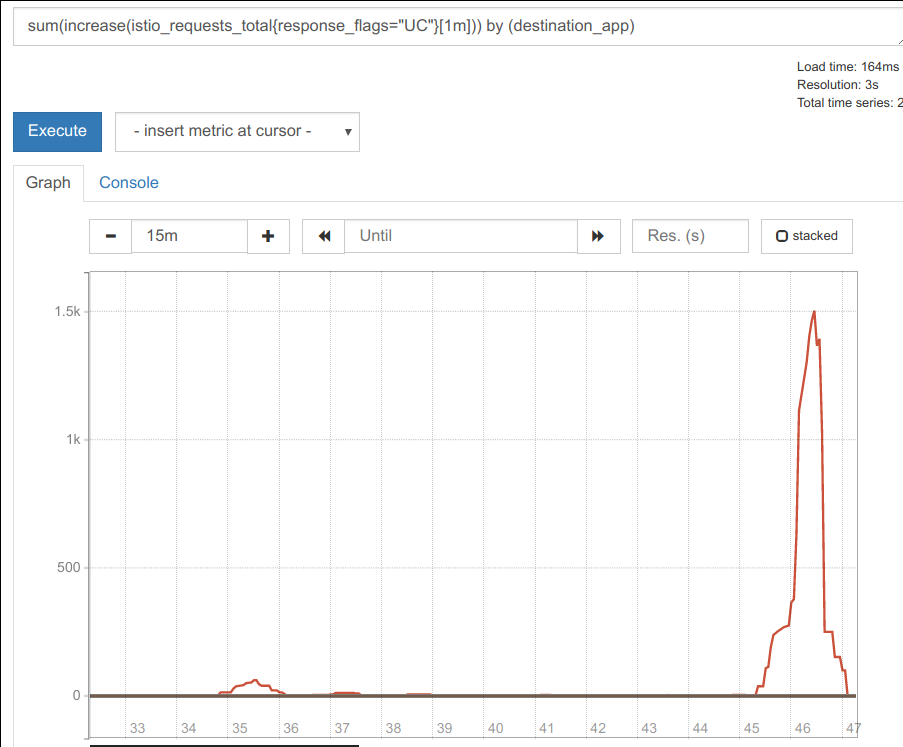
Istio: Almost every app gets UC errors, 0.012% of all requests in 24h period
I've noticed pretty much every application periodically gets this, a 503 with the envoy code UC.

It's retried as you can see, but it's bothering me that I cannot get to the bottom of why it is happening. My destinationrule should deal with any connection timeouts etc:
apiVersion: networking.istio.io/v1alpha3
kind: DestinationRule
metadata:
  name: sauron-graphql-server
spec:
  host: app
  trafficPolicy:
    connectionPool:
      http:
        http1MaxPendingRequests: 1024
        http2MaxRequests: 10240
        idleTimeout: 5m
        maxRequestsPerConnection: 1024
      tcp:
        maxConnections: 10240
        tcpKeepalive:
          interval: 1m
          time: 3m
    loadBalancer:
      simple: LEAST_CONN
    outlierDetection:
      baseEjectionTime: 5s
      consecutiveErrors: 5
      interval: 5s
      maxEjectionPercent: 50
      minHealthPercent: 50
    tls:
      mode: ISTIO_MUTUAL
The frequency of these bothers me, because across a distributed service graph, we can get spikes in latency on client requests as a result.
 Stono
Stono
All 93 comments
Do you know if this is a new issue you are experiencing?
 howardjohn
on 6 May 2019
howardjohn
on 6 May 2019
Annoyingly, I'm not sure :-(
Historically I've only really been looking at reporter=source which doesn't show them (presumably due to retries), however investigating some latency blips recently i've started looking at reporter=destination, which is where I saw these.
Stono
on 6 May 2019
Hmm I have a theory that my updated timeout settings won't apply to existing connections, so the continued 503 UC i'm still seeing are old connections timing out. So will restart a bunch of the apps and leave overnight to observe.
Stono
on 6 May 2019
Well 10 minutes after restarting them, I saw another :'( so guess I didn't need to wait overnight!

Stono
on 6 May 2019
Would you be able to post Envoy router and connection pool logs? I'm wondering if it's a case of a closed-by-upstream connection being reused that results in a 503 (recently fixed in Envoy but hasn't been released yet). Also, can you try setting idleTimeout to a much smaller value like 15s to see if the number of 503s changes at all?
 arianmotamedi
on 6 May 2019
arianmotamedi
on 6 May 2019
The router logs in debug are difficult to capture as they're very verbose, the failure rate is quite low, say 0.02% - it becomes difficult to capture logs from all instances for a given app and catch the UC as i don't shift istio-proxy logs off to external logging (ELK).
I'll try and think of something tomorrow.
In the interim, I'll try adjusting the idleTimeout though and see what happens, but i'm unsure how it would help considering i've configured keep alive to be less than the timeout.
Stono
on 6 May 2019
15s made no difference :shrug:
Stono
on 6 May 2019
OK @arianmotamedi @howardjohn I persevered and managed to catch one with router and connection logs.
This is from the destination envoy.
[2019-05-06 20:22:57.530][30][debug][router] [external/envoy/source/common/router/router.cc:320] [C17068][S9430344543646919123] cluster 'inbound|80|http-web|app.sauron-seo-app.svc.cluster.local' match for URL '/cars/peugeot/partner/combi'
[2019-05-06 20:22:57.530][30][debug][router] [external/envoy/source/common/router/router.cc:381] [C17068][S9430344543646919123] router decoding headers:
':authority', 'app.sauron-seo-app'
':path', '/cars/peugeot/partner/combi'
':method', 'GET'
... etc etc etc

[2019-05-06 20:22:57.530][30][debug][router] [external/envoy/source/common/router/router.cc:1165] [C17068][S9430344543646919123] pool ready
[2019-05-06 20:22:57.531][28][debug][router] [external/envoy/source/common/router/router.cc:717] [C19043][S5917390943479852622] upstream headers complete: end_stream=false
[2019-05-06 20:22:57.532][28][debug][connection] [external/envoy/source/common/network/connection_impl.cc:101] [C19043] closing data_to_write=1684 type=2
[2019-05-06 20:22:57.532][28][debug][connection] [external/envoy/source/common/network/connection_impl.cc:153] [C19043] setting delayed close timer with timeout 1000 ms
[2019-05-06 20:22:57.536][28][debug][router] [external/envoy/source/common/router/router.cc:320] [C0][S13455846817491226201] cluster 'outbound|15004||istio-telemetry.istio-system.svc.cluster.local' match for URL '/istio.mixer.v1.Mixer/Report'
[2019-05-06 20:22:57.536][28][debug][router] [external/envoy/source/common/router/router.cc:381] [C0][S13455846817491226201] router decoding headers:
':method', 'POST'
':path', '/istio.mixer.v1.Mixer/Report'
...etc etc etc

[2019-05-06 20:22:57.536][28][debug][router] [external/envoy/source/common/router/router.cc:1165] [C0][S13455846817491226201] pool ready
[2019-05-06 20:22:57.540][28][debug][router] [external/envoy/source/common/router/router.cc:717] [C0][S13455846817491226201] upstream headers complete: end_stream=false
[2019-05-06 20:22:57.559][30][debug][connection] [external/envoy/source/common/network/connection_impl.cc:502] [C19020] remote close
[2019-05-06 20:22:57.559][30][debug][connection] [external/envoy/source/common/network/connection_impl.cc:183] [C19020] closing socket: 0
[2019-05-06 20:22:57.559][30][debug][router] [external/envoy/source/common/router/router.cc:644] [C17068][S9430344543646919123] upstream reset: reset reason connection termination
[2019-05-06 20:22:57.559][30][debug][connection] [external/envoy/source/common/network/connection_impl.cc:461] [C19040] remote early close
[2019-05-06 20:22:57.559][30][debug][connection] [external/envoy/source/common/network/connection_impl.cc:183] [C19040] closing socket: 0
[2019-05-06 20:22:57.560][30][debug][connection] [external/envoy/source/common/network/connection_impl.cc:502] [C17068] remote close
[2019-05-06 20:22:57.560][30][debug][connection] [external/envoy/source/common/network/connection_impl.cc:183] [C17068] closing socket: 0
[2019-05-06 20:22:57.560][30][debug][connection] [external/envoy/source/extensions/transport_sockets/tls/ssl_socket.cc:244] [C17068] SSL shutdown: rc=1
[2019-05-06 20:22:57.560][30][debug][connection] [external/envoy/source/extensions/transport_sockets/tls/ssl_socket.cc:175] [C17068]
[2019-05-06 20:22:57.581][30][debug][connection] [external/envoy/source/extensions/transport_sockets/tls/ssl_socket.cc:142] [C19044] handshake error: 2
[2019-05-06 20:22:57.581][30][debug][connection] [external/envoy/source/extensions/transport_sockets/tls/ssl_socket.cc:142] [C19044] handshake error: 2
[2019-05-06 20:22:57.583][30][debug][connection] [external/envoy/source/extensions/transport_sockets/tls/ssl_socket.cc:131] [C19044] handshake complete
I feel there is overlap with https://github.com/istio/istio/issues/13616, even though @jaygorrell is specifically talking about his observations during deployments.
Stono
on 6 May 2019
I also want to call out the messages i put on slack the other day, we have multiple app that do connection pooling having their connections terminated for no reason, all with the same error. I can't help but feel this is all related.
searchone-consumer talking to search-one (in cluster -> in cluster)
2019-05-02 17:01:59.924 WARN 1 --- [ice-executor-18] u.c.a.s.c.k.service.SearchOneService : Error talking to S1: Connection has been shut down - retrying
sauron-web talking to abtest-allocator (in cluster -> in cluster)
sauron.http.endpoint.HttpEndpointException: java.io.InterruptedIOException: Connection has been shut down
sauron-web talking to ods (in cluster -> on prem)
2019-05-02 13:29:56,204 ERROR u.c.a.o.ODSClientImpl:72 - Logging to ODS failed: Connection has been shut down for message:
Stono
on 6 May 2019
Wait, in the logs you posted, C17068 is the one being reset, but I don't see a log saying the connection is being reused. If a reset is happening on new connection, then idle/keep alive timeouts won't have anything to do with the failure. Besides that, these DestinationRule timeouts are applied to requests coming into your service's sidecar; I don't believe sidecar ingress -> local service sees these (you can verify this by checking the cluster configuration for inbound|80|http-web|app.sauron-seo-app.svc.cluster.local).
arianmotamedi
on 6 May 2019
We do apply the outlier detection rules to inbound, not sure about the rest. I don't think this actually really does anything though, since we have the minHealthPercent
howardjohn
on 6 May 2019
TBH I don't know what the problem is. I'm just observing the failures with the code UC and would like the istio teams help getting to the bottom of it. Other than these logs I don't know what else to look at.
Here are sections from the config dump for that cluster:
{
"version_info": "2019-05-06T20:31:35Z/62",
"cluster": {
"name": "inbound|80|http-web|app.sauron-seo-app.svc.cluster.local",
"type": "STATIC",
"connect_timeout": "10s",
"circuit_breakers": {
"thresholds": [
{}
]
},
"metadata": {
"filter_metadata": {
"istio": {
"config": "/apis/networking.istio.io/v1alpha3/namespaces/istio-system/destination-rule/default"
}
}
},
"load_assignment": {
"cluster_name": "inbound|80|http-web|app.sauron-seo-app.svc.cluster.local",
"endpoints": [
{
"lb_endpoints": [
{
"endpoint": {
"address": {
"socket_address": {
"address": "127.0.0.1",
"port_value": 8080
}
}
}
}
]
}
]
}
},
"last_updated": "2019-05-06T20:31:54.631Z"
}
"name": "inbound|80|http-web|app.sauron-seo-app.svc.cluster.local",
"validate_clusters": false,
"virtual_hosts": [
{
"name": "inbound|http|80",
"routes": [
{
"decorator": {
"operation": "app.sauron-seo-app.svc.cluster.local:80/*"
},
"route": {
"cluster": "inbound|80|http-web|app.sauron-seo-app.svc.cluster.local",
"timeout": "0s",
"max_grpc_timeout": "0s"
},
"match": {
"prefix": "/"
},
"per_filter_config": {
"mixer": {
"mixer_attributes": {
"attributes": {
"destination.service.namespace": {
"string_value": "sauron-seo-app"
},
"destination.service.name": {
"string_value": "app"
},
"destination.service.host": {
"string_value": "app.sauron-seo-app.svc.cluster.local"
},
"destination.service.uid": {
"string_value": "istio://sauron-seo-app/services/app"
}
}
},
"disable_check_calls": true
}
}
}
],
"domains": [
"*"
]
}
]
{
"route_config": {
"name": "inbound|80|http-web|app.sauron-seo-app.svc.cluster.local",
"virtual_hosts": [
{
"name": "inbound|http|80",
"domains": [
"*"
],
"routes": [
{
"match": {
"prefix": "/"
},
"route": {
"cluster": "inbound|80|http-web|app.sauron-seo-app.svc.cluster.local",
"timeout": "0s",
"max_grpc_timeout": "0s"
},
"decorator": {
"operation": "app.sauron-seo-app.svc.cluster.local:80/*"
},
"per_filter_config": {
"mixer": {
"disable_check_calls": true,
"mixer_attributes": {
"attributes": {
"destination.service.name": {
"string_value": "app"
},
"destination.service.namespace": {
"string_value": "sauron-seo-app"
},
"destination.service.uid": {
"string_value": "istio://sauron-seo-app/services/app"
},
"destination.service.host": {
"string_value": "app.sauron-seo-app.svc.cluster.local"
}
}
}
}
}
}
]
}
],
"validate_clusters": false
},
"last_updated": "2019-05-06T20:31:54.657Z"
}
I mean, these logs don't sound particular healthy?
[2019-05-06 20:22:57.559][30][debug][router] [external/envoy/source/common/router/router.cc:644] [C17068][S9430344543646919123] upstream reset: reset reason connection termination
[2019-05-06 20:22:57.559][30][debug][connection] [external/envoy/source/common/network/connection_impl.cc:502] [C17068] remote close
[2019-05-06 20:22:57.560][30][debug][connection] [external/envoy/source/common/network/connection_impl.cc:183] [C17068] closing socket: 0
[2019-05-06 20:22:57.560][30][debug][connection] [external/envoy/source/extensions/transport_sockets/tls/ssl_socket.cc:244] [C17068] SSL shutdown: rc=1
[2019-05-06 20:22:57.560][30][debug][connection] [external/envoy/source/extensions/transport_sockets/tls/ssl_socket.cc:175] [C17068]
I mean, these logs don't sound particular healthy?
They don't, it's definitely an issue, but it's not the same issue as others reported that was caused due to an existing connection being closed by upstream without downstream Envoy acknowledging it and returning it to the connection pool, which is what idleTimeout was added for. In those cases, you'd see an explicit log saying the connection is being reused:
[debug][pool] external/envoy/source/common/http/http1/conn_pool.cc:89] [C502] using existing connection
If this isn't in your logs for C17068 then it's not something that idle_timeout/tcp keep_alive settings can fix since those settings don't have any effect on new connections (and as you can see they're not applied to ingress cluster config anyway). According to these logs, this 503 happened from destination Envoy to your service (not source Envoy -> destination Envoy). Are there any logs at all from your sauron-seo-app service around the same time?
arianmotamedi
on 6 May 2019
Ah right so it's separate to the other issues then.
@arianmotamedi those logs above are from sauron-seo-app. In the example above it is consumer-gateway -> sauron-seo-app.
Stono
on 7 May 2019
@Stono these are sauron-seo-app's _sidecar_ logs, I meant sauron-seo-app's logs to see if there's any indication that your app forcibly closed a connection, since "upstream" in sauron-seo-app's sidecar refers to the app itself.
The other thing you should check is cluster statistics for inbound|80|http-web|app.sauron-seo-app.svc.cluster.local (hit the /stats endpoint and search for cluster.inbound|80|http-web|app.sauron-seo-app.svc.cluster.local.upstream_) to see if anything other than cx_destroy_remote and cx_destroy_remote_with_active_rq stands out.
arianmotamedi
on 7 May 2019
There is nothing in the application logs about it killing connections, no.
Does envoy -> the app connection pool?
If so, is that pool sending keep alives to the app?
Here are all the cx stats for one of the instances that's just been spawned (2 mins ago) and has had a UC already (just one):
cluster.xds-grpc.upstream_cx_close_notify: 0
cluster.xds-grpc.upstream_cx_connect_attempts_exceeded: 0
cluster.xds-grpc.upstream_cx_connect_fail: 0
cluster.xds-grpc.upstream_cx_connect_timeout: 0
cluster.xds-grpc.upstream_cx_destroy: 0
cluster.xds-grpc.upstream_cx_destroy_local: 0
cluster.xds-grpc.upstream_cx_destroy_local_with_active_rq: 0
cluster.xds-grpc.upstream_cx_destroy_remote: 0
cluster.xds-grpc.upstream_cx_destroy_remote_with_active_rq: 0
cluster.xds-grpc.upstream_cx_destroy_with_active_rq: 0
cluster.xds-grpc.upstream_cx_http1_total: 0
cluster.xds-grpc.upstream_cx_http2_total: 1
cluster.xds-grpc.upstream_cx_idle_timeout: 0
cluster.xds-grpc.upstream_cx_max_requests: 0
cluster.xds-grpc.upstream_cx_none_healthy: 1
cluster.xds-grpc.upstream_cx_overflow: 0
cluster.xds-grpc.upstream_cx_protocol_error: 0
cluster.xds-grpc.upstream_cx_rx_bytes_buffered: 134
cluster.xds-grpc.upstream_cx_rx_bytes_total: 69136
cluster.xds-grpc.upstream_cx_total: 1
cluster.xds-grpc.upstream_cx_tx_bytes_buffered: 0
cluster.xds-grpc.upstream_cx_tx_bytes_total: 34061
cluster.xds-grpc.upstream_cx_connect_ms: P0(nan,8) P25(nan,8.025) P50(nan,8.05) P75(nan,8.075) P90(nan,8.09) P95(nan,8.095) P99(nan,8.099) P99.5(nan,8.0995) P99.9(nan,8.0999) P100(nan,8.1)
cluster.xds-grpc.upstream_cx_length_ms: No recorded values
And here are the rest of the stats that are non-zero (you can see the 503):
cluster.xds-grpc.internal.upstream_rq_200: 1
cluster.xds-grpc.internal.upstream_rq_2xx: 1
cluster.xds-grpc.internal.upstream_rq_503: 1
cluster.xds-grpc.internal.upstream_rq_5xx: 1
cluster.xds-grpc.internal.upstream_rq_completed: 2
cluster.xds-grpc.lb_healthy_panic: 1
cluster.xds-grpc.max_host_weight: 1
cluster.xds-grpc.membership_change: 1
cluster.xds-grpc.membership_healthy: 1
cluster.xds-grpc.membership_total: 1
cluster.xds-grpc.ssl.ciphers.ECDHE-RSA-AES128-GCM-SHA256: 1
cluster.xds-grpc.ssl.curves.X25519: 1
cluster.xds-grpc.ssl.handshake: 1
cluster.xds-grpc.ssl.sigalgs.rsa_pss_rsae_sha256: 1
cluster.xds-grpc.ssl.versions.TLSv1.2: 1
cluster.xds-grpc.update_attempt: 96
cluster.xds-grpc.update_no_rebuild: 95
cluster.xds-grpc.update_success: 96
cluster.xds-grpc.upstream_cx_active: 1
cluster.xds-grpc.upstream_cx_http2_total: 1
cluster.xds-grpc.upstream_cx_none_healthy: 1
cluster.xds-grpc.upstream_cx_rx_bytes_buffered: 134
cluster.xds-grpc.upstream_cx_rx_bytes_total: 69270
cluster.xds-grpc.upstream_cx_total: 1
cluster.xds-grpc.upstream_cx_tx_bytes_total: 36311
cluster.xds-grpc.upstream_rq_200: 1
cluster.xds-grpc.upstream_rq_2xx: 1
cluster.xds-grpc.upstream_rq_503: 1
cluster.xds-grpc.upstream_rq_5xx: 1
cluster.xds-grpc.upstream_rq_active: 1
cluster.xds-grpc.upstream_rq_completed: 2
cluster.xds-grpc.upstream_rq_pending_total: 1
cluster.xds-grpc.upstream_rq_total: 1
cluster_manager.active_clusters: 25
cluster_manager.cds.update_attempt: 2
cluster_manager.cds.update_success: 1
cluster_manager.cds.version: 10570931166443169755
cluster_manager.cluster_added: 25
cluster_manager.cluster_updated: 5
http_mixer_filter.total_remote_report_calls: 808
http_mixer_filter.total_remote_report_successes: 808
http_mixer_filter.total_report_calls: 4272
listener_manager.lds.update_attempt: 2
listener_manager.lds.update_success: 1
listener_manager.lds.version: 10570931166443169755
listener_manager.listener_added: 17
listener_manager.listener_create_success: 34
listener_manager.total_listeners_active: 17
server.concurrency: 2
server.days_until_first_cert_expiring: 25
server.live: 1
server.memory_allocated: 9784536
server.memory_heap_size: 19922944
server.total_connections: 20
server.uptime: 475
server.version: 7600795
OK this issue can be exacerbated when you have more pods:
Take this:
❯ k get pods
NAME                               READY   STATUS    RESTARTS   AGE
redis-commander-7bbbf67df7-mwsms   1/1     Running   0          6d12h
sauron-seo-app-55b7bd4c45-8vkmp    2/2     Running   0          39m
sauron-seo-app-55b7bd4c45-r5dk5    2/2     Running   0          39m
sauron-seo-app-55b7bd4c45-sbj9m    2/2     Running   0          39m
And then look at the first two requests fail:
This app is getting a very small amount of traffic but enough to prevent time outs:
There's absolutely no pattern to the UC's, so it isn't some sort of fixed point interval drop.
We've removed:
    loadBalancer:
      simple: LEAST_CONN
    outlierDetection:
      baseEjectionTime: 5s
      consecutiveErrors: 5
      interval: 5s
      maxEjectionPercent: 50
      minHealthPercent: 50
Just in case for whatever reason that was interfering - but same behaviour
I'm really not sure what else me and @emedina can do to help debug the problem!
Stono
on 8 May 2019
assigning to @duderino for triage, etc.
 douglas-reid
on 8 May 2019
douglas-reid
on 8 May 2019
by-upstream connection being reused that results in a 503 (recently fixed in Envoy but hasn't been released yet).
@arianmotamedi Can you point me to this PR? We could potentially cherrypick
 duderino
on 8 May 2019
duderino
on 8 May 2019
@arianmotamedi that is a problem but i don't believe it is the cause of this issue
Stono
on 8 May 2019
@Stono we certainly have not proven it's the cause, but I'd like to keep considering it.
@PiotrSikora @silentdai @jplevyak your thoughts please
duderino
on 8 May 2019
 jaygorrell
on 8 May 2019
jaygorrell
on 8 May 2019
@duderino if you can get a nightly build with that envoy fix I'm more than happy to test if it has any affect.
Stono
on 8 May 2019
I doubt https://github.com/envoyproxy/envoy/pull/6578 is the issue. That only happens to existing connections being reused - according to the logs @Stono posted for one of the 503s, it happened on a new connection. I agree that this seems to be a different issue.
arianmotamedi
on 9 May 2019
Who is owning the investigation on the istio side?
I'm wondering what else I can do to help debug this. I need to find a solution really!
Are there any working theories?
Stono
on 9 May 2019
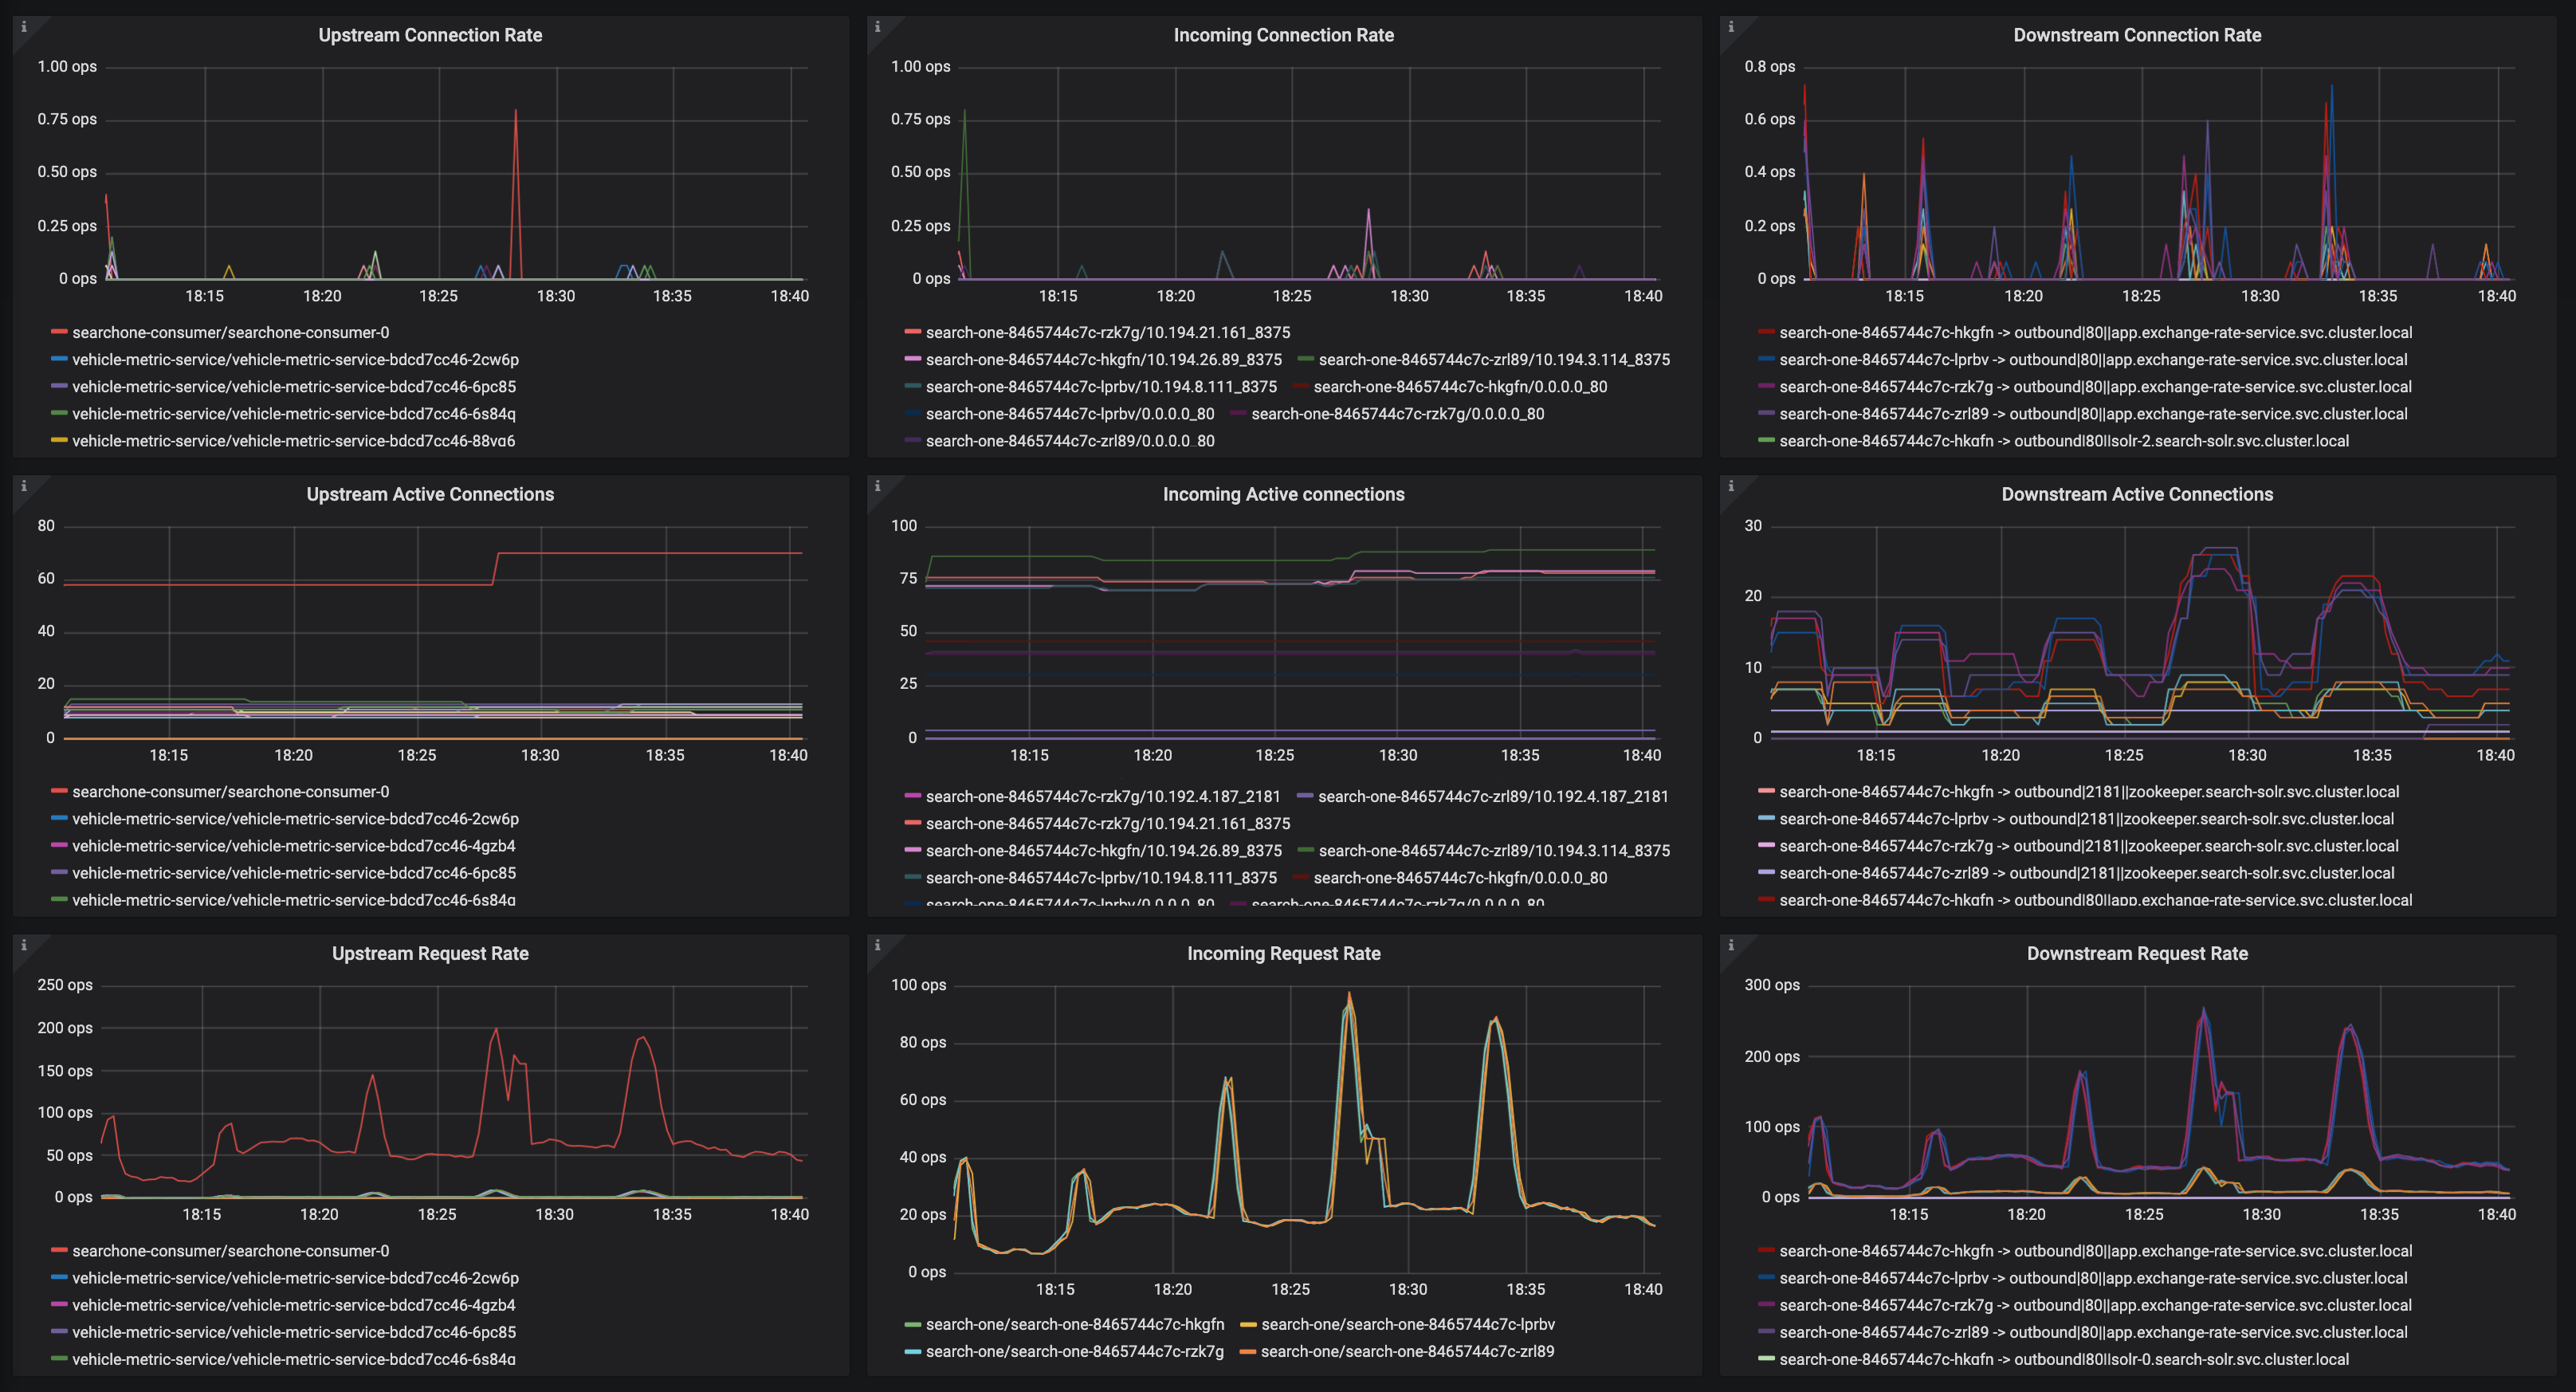
I'm still relatively convinced that these UC's are causing us other problems. I would appreciate it if someone could look at these connection logs and see if anything stands out.
For context, we have:
[ searchone-consumer (single instance) ] -- POST --> [ search-one (3 instances) ]
searchone-consumer is doing approximately 250 ops/sec, search-one is handling approximately 600 ops/sec.
What we're seeing in searchone-consumer only when we run with istio is this:
2019-05-10 06:31:53.228  WARN 1 --- [ice-executor-24] u.c.a.s.c.k.service.SearchOneService     : Error talking to S1: Connection has been shut down - retrying
2019-05-10 06:31:53.229  WARN 1 --- [vice-executor-0] u.c.a.s.c.k.service.SearchOneService     : Error talking to S1: Connection has been shut down - retrying
2019-05-10 06:32:38.109  WARN 1 --- [ice-executor-17] u.c.a.s.c.k.service.SearchOneService     : Error talking to S1: null - retrying
2019-05-10 06:33:27.295  WARN 1 --- [ice-executor-12] u.c.a.s.c.k.service.SearchOneService     : Error talking to S1: null - retrying
2019-05-10 06:34:25.602  WARN 1 --- [ice-executor-15] u.c.a.s.c.k.service.SearchOneService     : Error talking to S1: Connection has been shut down - retrying
2019-05-10 06:34:44.835  WARN 1 --- [vice-executor-7] u.c.a.s.c.k.service.SearchOneService     : Error talking to S1: null - retrying
2019-05-10 06:35:36.030  WARN 1 --- [ice-executor-15] u.c.a.s.c.k.service.SearchOneService     : Error talking to S1: null - retrying
2019-05-10 06:35:51.086  WARN 1 --- [ice-executor-29] u.c.a.s.c.k.service.SearchOneService     : Error talking to S1: Connection has been shut down - retrying
2019-05-10 06:35:53.626  WARN 1 --- [ice-executor-12] u.c.a.s.c.k.service.SearchOneService     : Error talking to S1: null - retrying
2019-05-10 06:36:43.288  WARN 1 --- [ice-executor-19] u.c.a.s.c.k.service.SearchOneService     : Error talking to S1: null - retrying
2019-05-10 06:36:56.828  WARN 1 --- [ice-executor-21] u.c.a.s.c.k.service.SearchOneService     : Error talking to S1: null - retrying
2019-05-10 06:38:37.290  WARN 1 --- [ice-executor-23] u.c.a.s.c.k.service.SearchOneService     : Error talking to S1: null - retrying
2019-05-10 06:39:47.327  WARN 1 --- [vice-executor-6] u.c.a.s.c.k.service.SearchOneService     : Error talking to S1: null - retrying
2019-05-10 06:40:42.592  WARN 1 --- [ice-executor-18] u.c.a.s.c.k.service.SearchOneService     : Error talking to S1: Connection has been shut down - retrying
2019-05-10 06:43:46.387  WARN 1 --- [vice-executor-1] u.c.a.s.c.k.service.SearchOneService     : Error talking to S1: Connection has been shut down - retrying
2019-05-10 06:44:03.092  WARN 1 --- [ice-executor-28] u.c.a.s.c.k.service.SearchOneService     : Error talking to S1: null - retrying
2019-05-10 06:45:56.775  WARN 1 --- [ice-executor-18] u.c.a.s.c.k.service.SearchOneService     : Error talking to S1: null - retrying
2019-05-10 06:48:10.985  WARN 1 --- [ice-executor-18] u.c.a.s.c.k.service.SearchOneService     : Error talking to S1: null - retrying
Now if istio is connection pooling, and searchone-consumer is connection pooling, I would expect to be seeing so many connection and disconnection attempts in the istio-proxy connection logs.
[2019-05-10 06:53:22.719][29][debug][connection] [external/envoy/source/common/network/connection_impl.cc:502] [C1411] remote close
[2019-05-10 06:53:22.719][29][debug][connection] [external/envoy/source/common/network/connection_impl.cc:183] [C1411] closing socket: 0
[2019-05-10 06:53:22.857][30][debug][connection] [external/envoy/source/common/network/connection_impl.cc:101] [C1343] closing data_to_write=0 type=1
[2019-05-10 06:53:22.857][30][debug][connection] [external/envoy/source/common/network/connection_impl.cc:183] [C1343] closing socket: 1
[2019-05-10 06:53:22.857][30][debug][connection] [external/envoy/source/extensions/transport_sockets/tls/ssl_socket.cc:244] [C1343] SSL shutdown: rc=0
[2019-05-10 06:53:22.857][30][debug][connection] [external/envoy/source/extensions/transport_sockets/tls/ssl_socket.cc:175] [C1343]
[2019-05-10 06:53:23.220][30][debug][connection] [external/envoy/source/common/network/connection_impl.cc:101] [C1345] closing data_to_write=0 type=1
[2019-05-10 06:53:23.220][30][debug][connection] [external/envoy/source/common/network/connection_impl.cc:183] [C1345] closing socket: 1
[2019-05-10 06:53:23.220][30][debug][connection] [external/envoy/source/extensions/transport_sockets/tls/ssl_socket.cc:244] [C1345] SSL shutdown: rc=0
[2019-05-10 06:53:23.220][30][debug][connection] [external/envoy/source/extensions/transport_sockets/tls/ssl_socket.cc:175] [C1345]
[2019-05-10 06:53:23.690][30][debug][connection] [external/envoy/source/common/network/connection_impl.cc:644] [C1462] connecting to 10.194.26.58:8375
[2019-05-10 06:53:23.690][30][debug][connection] [external/envoy/source/common/network/connection_impl.cc:653] [C1462] connection in progress
[2019-05-10 06:53:23.691][30][debug][connection] [external/envoy/source/common/network/connection_impl.cc:517] [C1462] connected
Please see the attached logs.
search-one-consumer.log
search-one.log
This happens on this service so frequently that I'm more than happy to screen share with someone and live debug if that helps.
Stono
on 10 May 2019
I'm going to try to clean this up a bit to see if I can find the real issue....
I don't see any errors in the search-one-consumer.log or search-one.log. I see these things that look like errors but they aren't:
[2019-05-10 06:52:55.073][29][debug][connection] [external/envoy/source/common/network/connection_impl.cc:644] [C1441] connecting to 10.194.26.58:8375
[2019-05-10 06:52:55.074][29][debug][connection] [external/envoy/source/common/network/connection_impl.cc:653] [C1441] connection in progress
[2019-05-10 06:52:55.074][29][debug][connection] [external/envoy/source/common/network/connection_impl.cc:517] [C1441] connected
[2019-05-10 06:52:55.074][29][debug][connection] [external/envoy/source/extensions/transport_sockets/tls/ssl_socket.cc:142] [C1441] handshake error: 2
[2019-05-10 06:52:55.078][29][debug][connection] [external/envoy/source/extensions/transport_sockets/tls/ssl_socket.cc:142] [C1441] handshake error: 2
[2019-05-10 06:52:55.078][29][debug][connection] [external/envoy/source/extensions/transport_sockets/tls/ssl_socket.cc:142] [C1441] handshake error: 2
[2019-05-10 06:52:55.079][29][debug][connection] [external/envoy/source/extensions/transport_sockets/tls/ssl_socket.cc:131] [C1441] handshake complete
The 2 in "handshake error: 2" comes from #define SSL_ERROR_WANT_READ 2, so that just means there wasn't enough data in the socket recv buffer to complete the handshake for a while, but then the data does arrive and the handshake completes.
duderino
on 11 May 2019
The router logs in debug are difficult to capture as they're very verbose, the failure rate is quite low, say 0.02% - it becomes difficult to capture logs from all instances for a given app and catch the UC as i don't shift istio-proxy logs off to external logging (ELK).
I'll try and think of something tomorrow.
In the interim, I'll try adjusting the idleTimeout though and see what happens, but i'm unsure how it would help considering i've configured keep alive to be less than the timeout.
Is this a TCP keepalive (which I think idleTimeout would completely ignore because that looks only for application data (actual payload - bytes on the wire)) or a application level keepalive (e.g., gRPC has this)
duderino
on 11 May 2019
Hey,
I tried various configurations of the destinationrules idleTimeout and TCP keep alive.
Didn't make any observable difference!
And tbh we see this on services getting constant traffic so I imagine its actually unlikely to be a keep alive thing.
Stono
on 11 May 2019
OK @arianmotamedi @howardjohn I persevered and managed to catch one with router and connection logs.
This is from the destination envoy.
[2019-05-06 20:22:57.530][30][debug][router] [external/envoy/source/common/router/router.cc:320] [C17068][S9430344543646919123] cluster 'inbound|80|http-web|app.sauron-seo-app.svc.cluster.local' match for URL '/cars/peugeot/partner/combi'
[2019-05-06 20:22:57.530][30][debug][router] [external/envoy/source/common/router/router.cc:381] [C17068][S9430344543646919123] router decoding headers:
':authority', 'app.sauron-seo-app'
':path', '/cars/peugeot/partner/combi'
':method', 'GET'
... etc etc etc

[2019-05-06 20:22:57.530][30][debug][router] [external/envoy/source/common/router/router.cc:1165] [C17068][S9430344543646919123] pool ready
[2019-05-06 20:22:57.531][28][debug][router] [external/envoy/source/common/router/router.cc:717] [C19043][S5917390943479852622] upstream headers complete: end_stream=false
[2019-05-06 20:22:57.532][28][debug][connection] [external/envoy/source/common/network/connection_impl.cc:101] [C19043] closing data_to_write=1684 type=2
[2019-05-06 20:22:57.532][28][debug][connection] [external/envoy/source/common/network/connection_impl.cc:153] [C19043] setting delayed close timer with timeout 1000 ms
[2019-05-06 20:22:57.536][28][debug][router] [external/envoy/source/common/router/router.cc:320] [C0][S13455846817491226201] cluster 'outbound|15004||istio-telemetry.istio-system.svc.cluster.local' match for URL '/istio.mixer.v1.Mixer/Report'
[2019-05-06 20:22:57.536][28][debug][router] [external/envoy/source/common/router/router.cc:381] [C0][S13455846817491226201] router decoding headers:
':method', 'POST'
':path', '/istio.mixer.v1.Mixer/Report'
...etc etc etc

[2019-05-06 20:22:57.536][28][debug][router] [external/envoy/source/common/router/router.cc:1165] [C0][S13455846817491226201] pool ready
[2019-05-06 20:22:57.540][28][debug][router] [external/envoy/source/common/router/router.cc:717] [C0][S13455846817491226201] upstream headers complete: end_stream=false
[2019-05-06 20:22:57.559][30][debug][connection] [external/envoy/source/common/network/connection_impl.cc:502] [C19020] remote close
[2019-05-06 20:22:57.559][30][debug][connection] [external/envoy/source/common/network/connection_impl.cc:183] [C19020] closing socket: 0
[2019-05-06 20:22:57.559][30][debug][router] [external/envoy/source/common/router/router.cc:644] [C17068][S9430344543646919123] upstream reset: reset reason connection termination
[2019-05-06 20:22:57.559][30][debug][connection] [external/envoy/source/common/network/connection_impl.cc:461] [C19040] remote early close
[2019-05-06 20:22:57.559][30][debug][connection] [external/envoy/source/common/network/connection_impl.cc:183] [C19040] closing socket: 0
[2019-05-06 20:22:57.560][30][debug][connection] [external/envoy/source/common/network/connection_impl.cc:502] [C17068] remote close
[2019-05-06 20:22:57.560][30][debug][connection] [external/envoy/source/common/network/connection_impl.cc:183] [C17068] closing socket: 0
[2019-05-06 20:22:57.560][30][debug][connection] [external/envoy/source/extensions/transport_sockets/tls/ssl_socket.cc:244] [C17068] SSL shutdown: rc=1
[2019-05-06 20:22:57.560][30][debug][connection] [external/envoy/source/extensions/transport_sockets/tls/ssl_socket.cc:175] [C17068]
[2019-05-06 20:22:57.581][30][debug][connection] [external/envoy/source/extensions/transport_sockets/tls/ssl_socket.cc:142] [C19044] handshake error: 2
[2019-05-06 20:22:57.581][30][debug][connection] [external/envoy/source/extensions/transport_sockets/tls/ssl_socket.cc:142] [C19044] handshake error: 2
[2019-05-06 20:22:57.583][30][debug][connection] [external/envoy/source/extensions/transport_sockets/tls/ssl_socket.cc:131] [C19044] handshake complete
I think you mean this:
[external/envoy/source/common/network/connection_impl.cc:461] [C19040] remote early close
[2019-05-06 20:22:57.559][30][debug][connection] [external/envoy/source/common/network/connection_impl.cc:183] [C19040] closing socket: 0
That corresponds to this code in Envoy:
  if (events & Event::FileReadyType::Closed) {
    // We never ask for both early close and read at the same time. If we are reading, we want to
    // consume all available data.
    ASSERT(!(events & Event::FileReadyType::Read));
    ENVOY_CONN_LOG(debug, "remote early close", *this);
    closeSocket(ConnectionEvent::RemoteClose);
    return;
  }
@PiotrSikora does this just mean that Envoy was trying to, say, read the next request on a connection but the peer decided to close it's end of the connection?
duderino
on 11 May 2019
Yes those are all the logs for a request which 503'd, I didn't know which bits gave any information as to why ?
Stono
on 11 May 2019
I mean, these logs don't sound particular healthy?
[2019-05-06 20:22:57.559][30][debug][router] [external/envoy/source/common/router/router.cc:644] [C17068][S9430344543646919123] upstream reset: reset reason connection termination
[2019-05-06 20:22:57.559][30][debug][connection] [external/envoy/source/common/network/connection_impl.cc:502] [C17068] remote close
[2019-05-06 20:22:57.560][30][debug][connection] [external/envoy/source/common/network/connection_impl.cc:183] [C17068] closing socket: 0
[2019-05-06 20:22:57.560][30][debug][connection] [external/envoy/source/extensions/transport_sockets/tls/ssl_socket.cc:244] [C17068] SSL shutdown: rc=1
[2019-05-06 20:22:57.560][30][debug][connection] [external/envoy/source/extensions/transport_sockets/tls/ssl_socket.cc:175] [C17068]
I think this one means that the source/client sidecar noticed the destination/server sidecar close its end of a TLS connection. That's only an issue if it closes the connection in the middle of an active transaction (e.g,. HTTP request sent, waiting for a HTTP response). I don't see it actually interrupting an active transaction here.
duderino
on 11 May 2019
Yes those are all the logs for a request which 503'd, I didn't know which bits gave any information as to why ?
How did you associate the connections in those logs with requests that 503?
duderino
on 11 May 2019
EDIT: I am wrong about the connection close. It's the remote early close log indicating an unexpected close.
We can group the search-one-consumer envoy logs into 2 groups.
- search-one-consumer-envoy -- search-one envoy.
I see no error in the log. - search-one-consumer -- search-one-consumer envoy
It's always envoy see the remote(search-one-consumer) close first. It seems either consumer or envoy lies. Or something in the middle close the connection.
[2019-05-10 06:48:47.439][30][debug][connection] [external/envoy/source/common/network/connection_impl.cc:502] [C1173] remote close
[2019-05-10 06:48:47.439][30][debug][connection] [external/envoy/source/common/network/connection_impl.cc:183] [C1173] closing socket: 0
 lambdai
on 11 May 2019
lambdai
on 11 May 2019
How did you associate the connections in those logs with requests that 503?
The ... part i omitted showed the response code of 503? I just didn't bloat the post with all the headers.
Stono
on 11 May 2019
How did you associate the connections in those logs with requests that 503?
The ... part i omitted showed the response code of 503, how do you think? I just didn't bloat the post with all the headers.
Can you show me combined logs that have both the 503 response status and all the events for a connection (e.g,. C19040, or whatever). I'm trying to piece this together across multiple comments and they all seem to be from different events.
duderino
on 11 May 2019
I'm really not sure what else you want. It's exactly the logs you quoted me on a minute ago with the standard response headers in there, one of which was 503 with a response code UC. Which could then be viewed in Jager too.
I'll get another one for you tomorrow as it's midnight here.
You're right there a lot of comments on here, that's because I'm trying to give you info from multiple different events, as it happens so much. When I'm actively trying to investigate the issue and don't hear anything from istio folks for days, all I can do is just continue to gather more information as I presume you're not making any progress with what I've provided so far.
As I've suggested countless times now, perhaps a more effective way to get to the bottom of the problem would be to just screenshare with me and that way you can explore my cluster as they're happening.
Further to that, the linked post "Sporadic 503 errors" shows that they are easily reproducible from a simple fortio load test. So maybe just try that yourself rather than relying on cross time zone async Q&A and share your findings? I'm happy to send across my istio install config so you can create like for like.
The previous issue which appears to be exactly the same thing has been open for 7 months.. I would really like to get to the bottom of this before Christmas, but our current way of working isn't going to get us there!
Stono
on 11 May 2019
I don't see any logs anywhere that show me a 503 response with surrounding socket events. Sorry, I've tried very hard, I just can't find them.
The reason why I'm pushing on this is because I still think envoyproxy/envoy#6578 could address this and I haven't seen anything else that looks like an error.
So I think I should just backport that and you should give it a shot.
duderino
on 11 May 2019
Sounds like a plan
Stono
on 11 May 2019
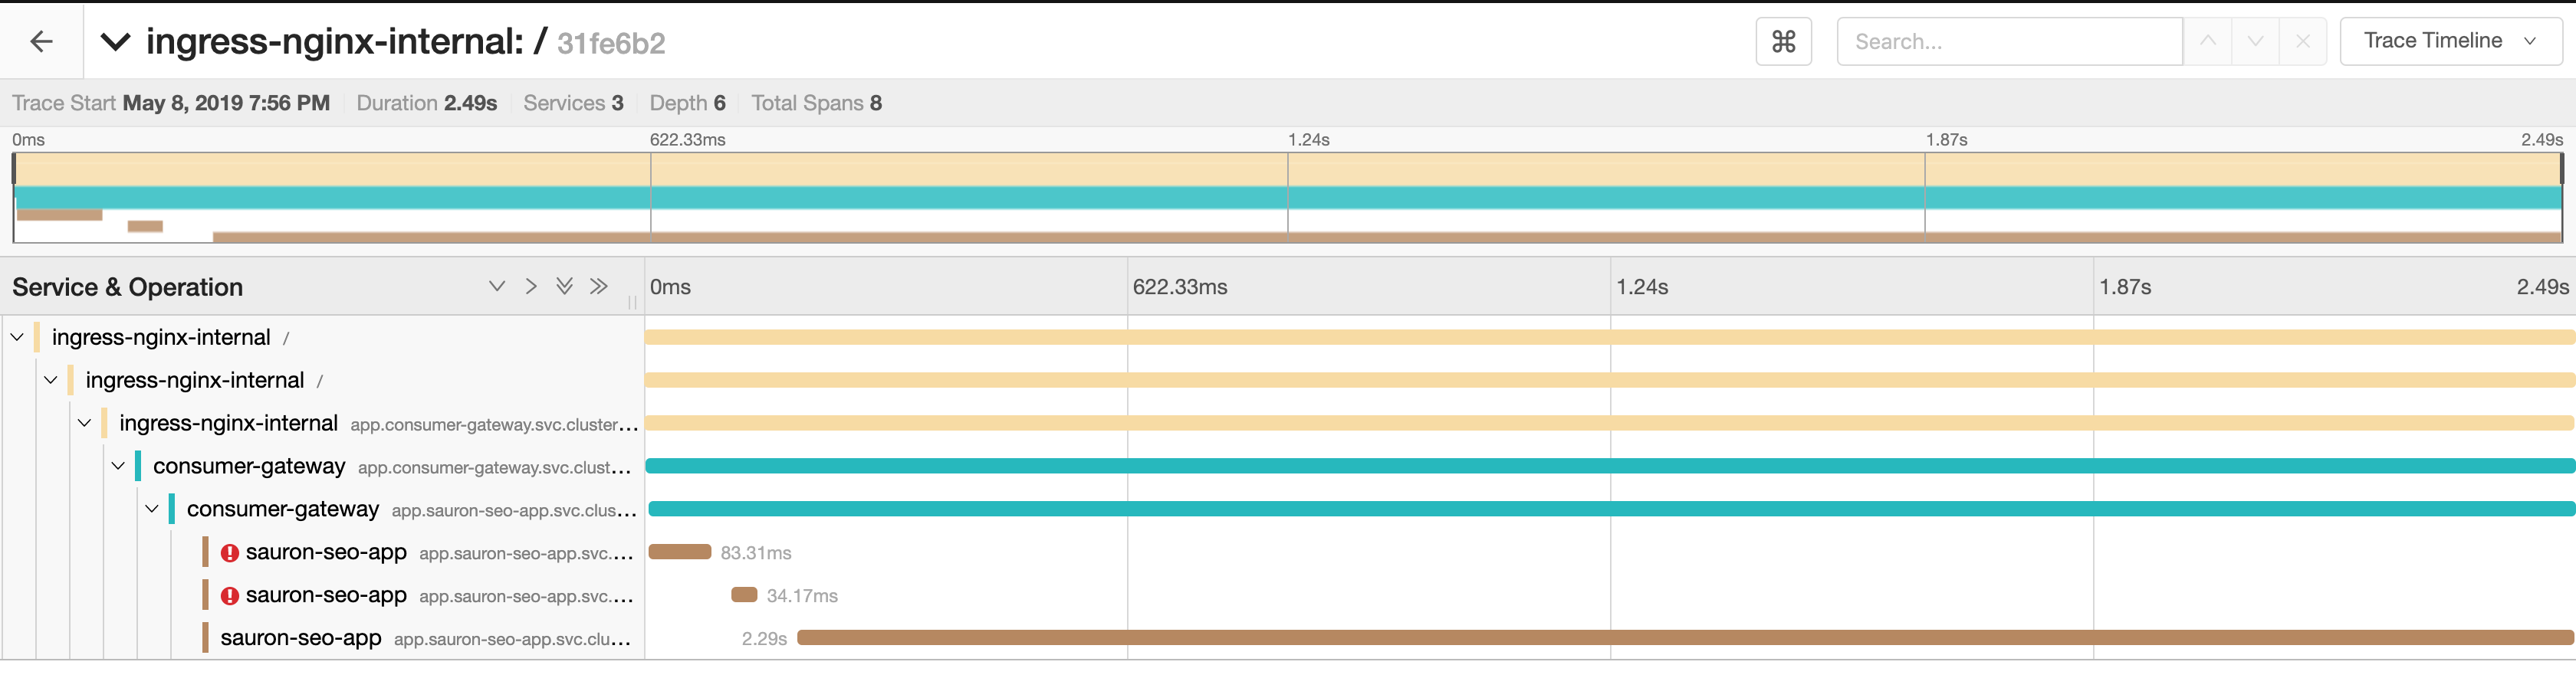
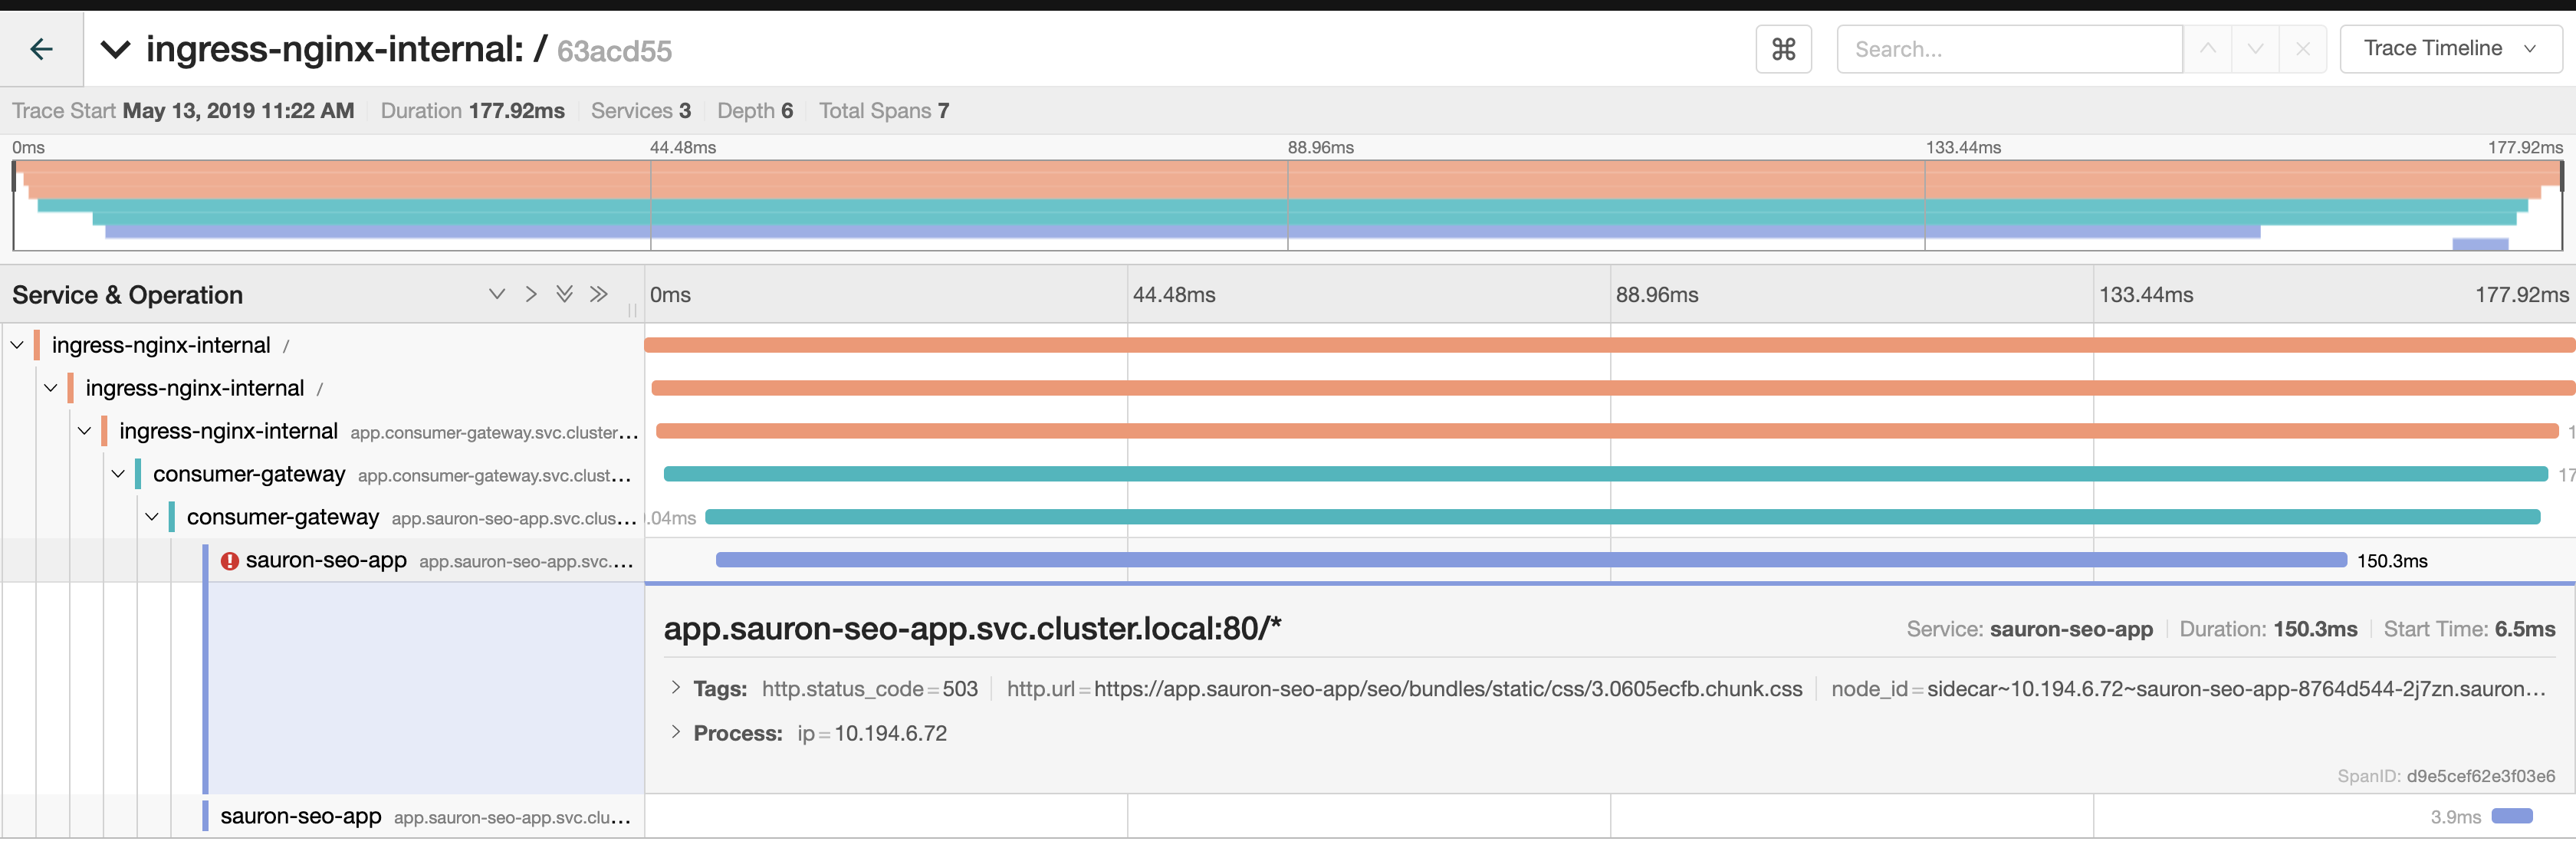
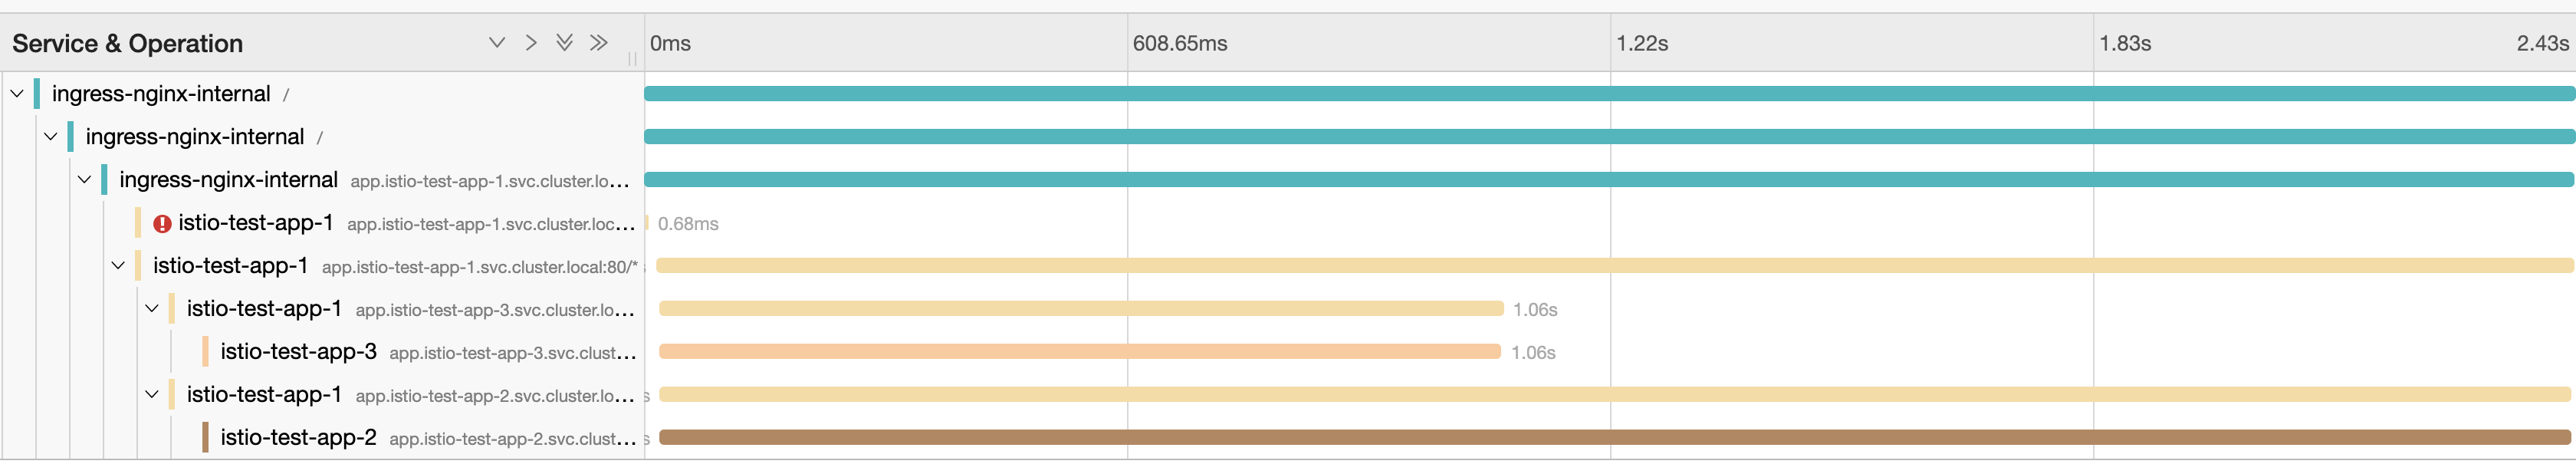
Something I found pretty odd today was this trace. Notice how the first one which UC with a 503 took 150ms to do so?
I don't know what that tells me, if anything - just seems like a rather long time.
Stono
on 13 May 2019
OK here's my next finding, we built a small set of services that call each other in a testing environment.
- app-1 (4 instances)
- app-2 (4 instances)
- app-3 (4 instances)
app-1 calls app-2 and app-3, 2 and 3 return their response on a random delay between 1 and 3000ms.
At first we were hitting it with quite a bit of ops/sec, 100+, but didn't see the UC's. We knocked it down to 2ops/second and quite quickly saw one:
Stono
on 13 May 2019
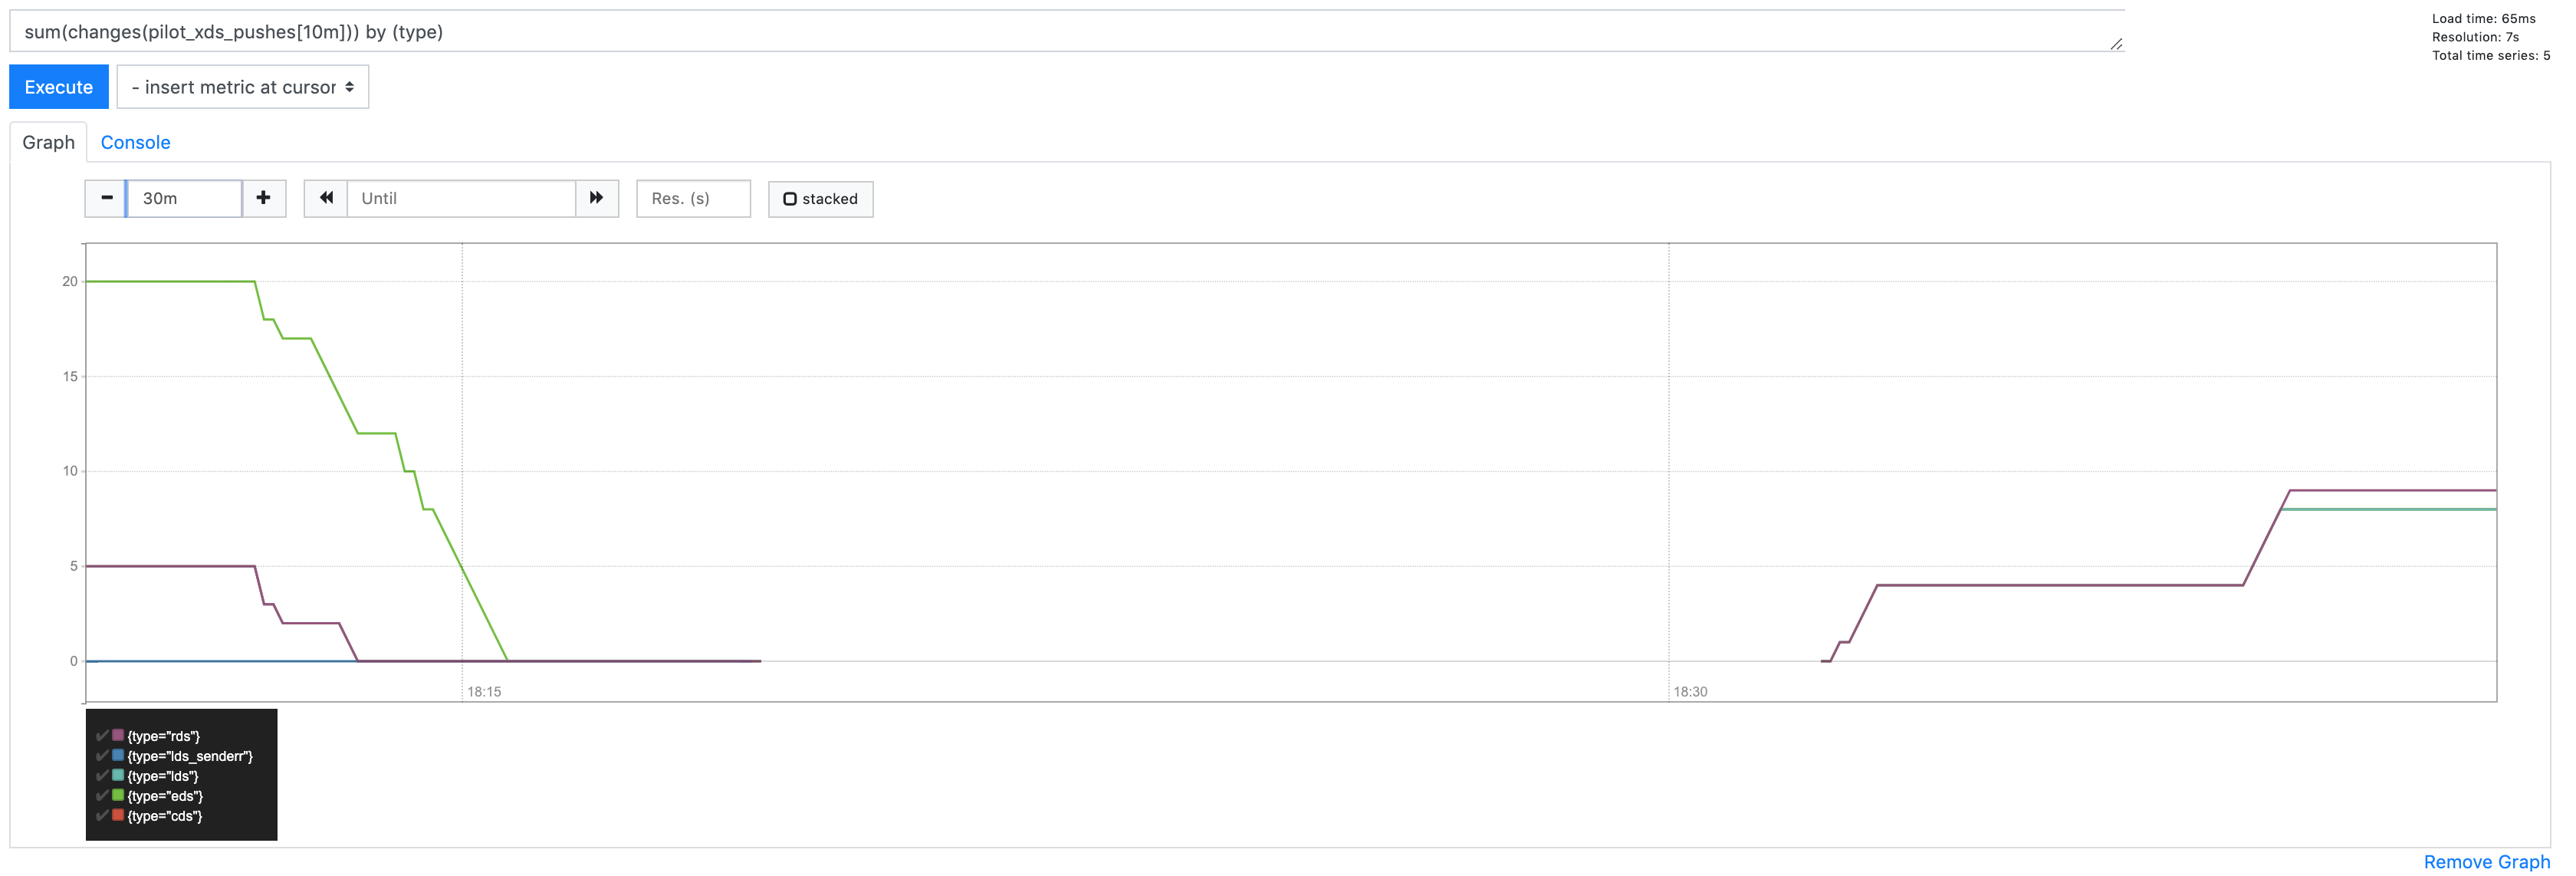
Another interesting observation, we definitely see increased UC's in the destination reporter during periods of higher load (in terms of ops/sec) and churn on the cluster (deployments):
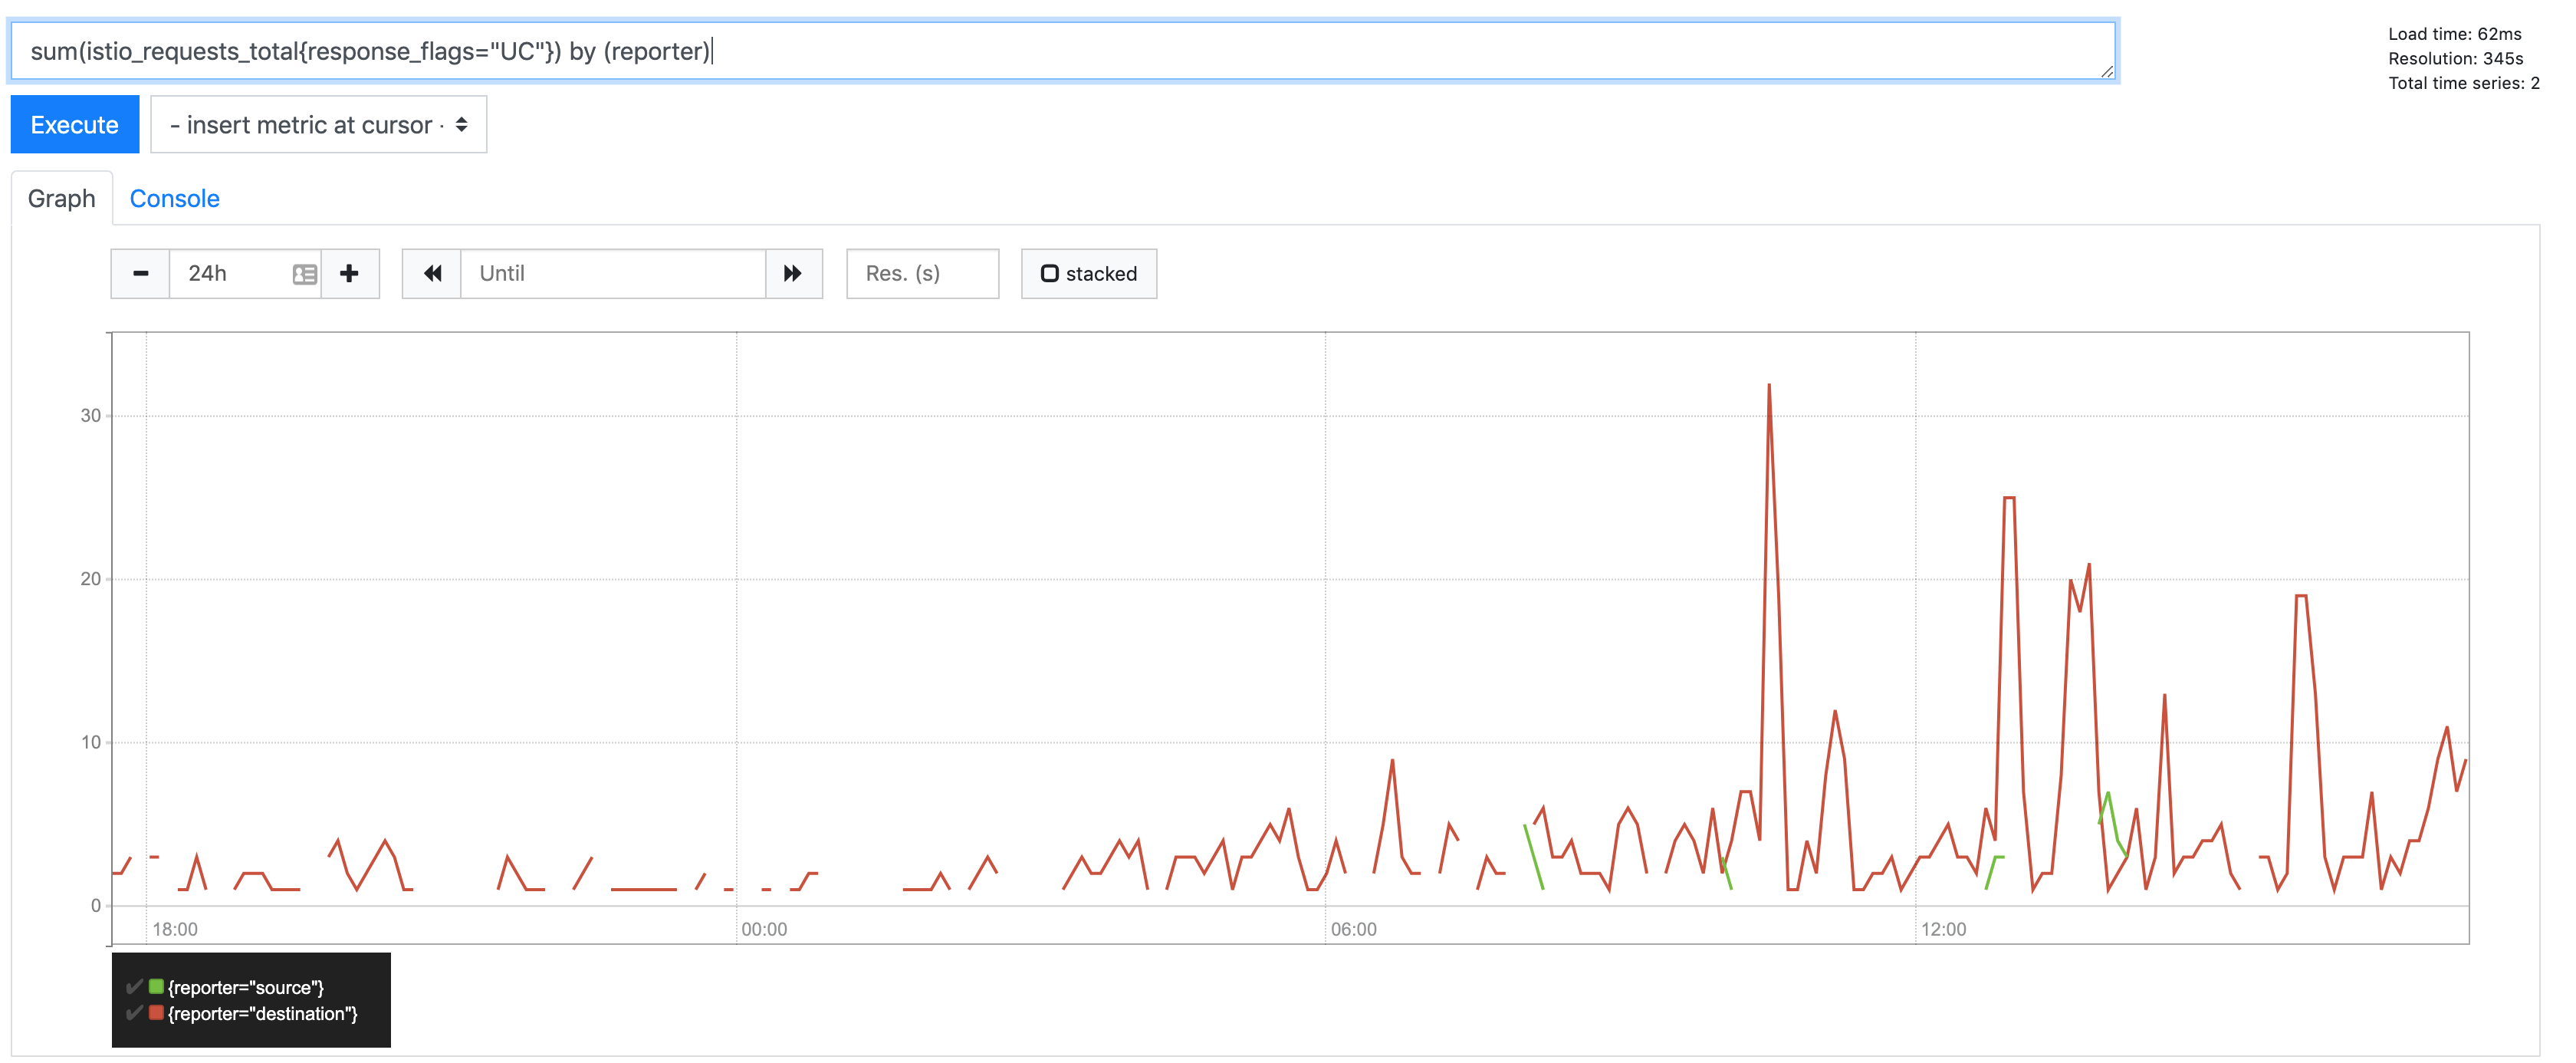
This correlates with an increase in EDS pushes:
_or_ traffic:
Stono
on 13 May 2019
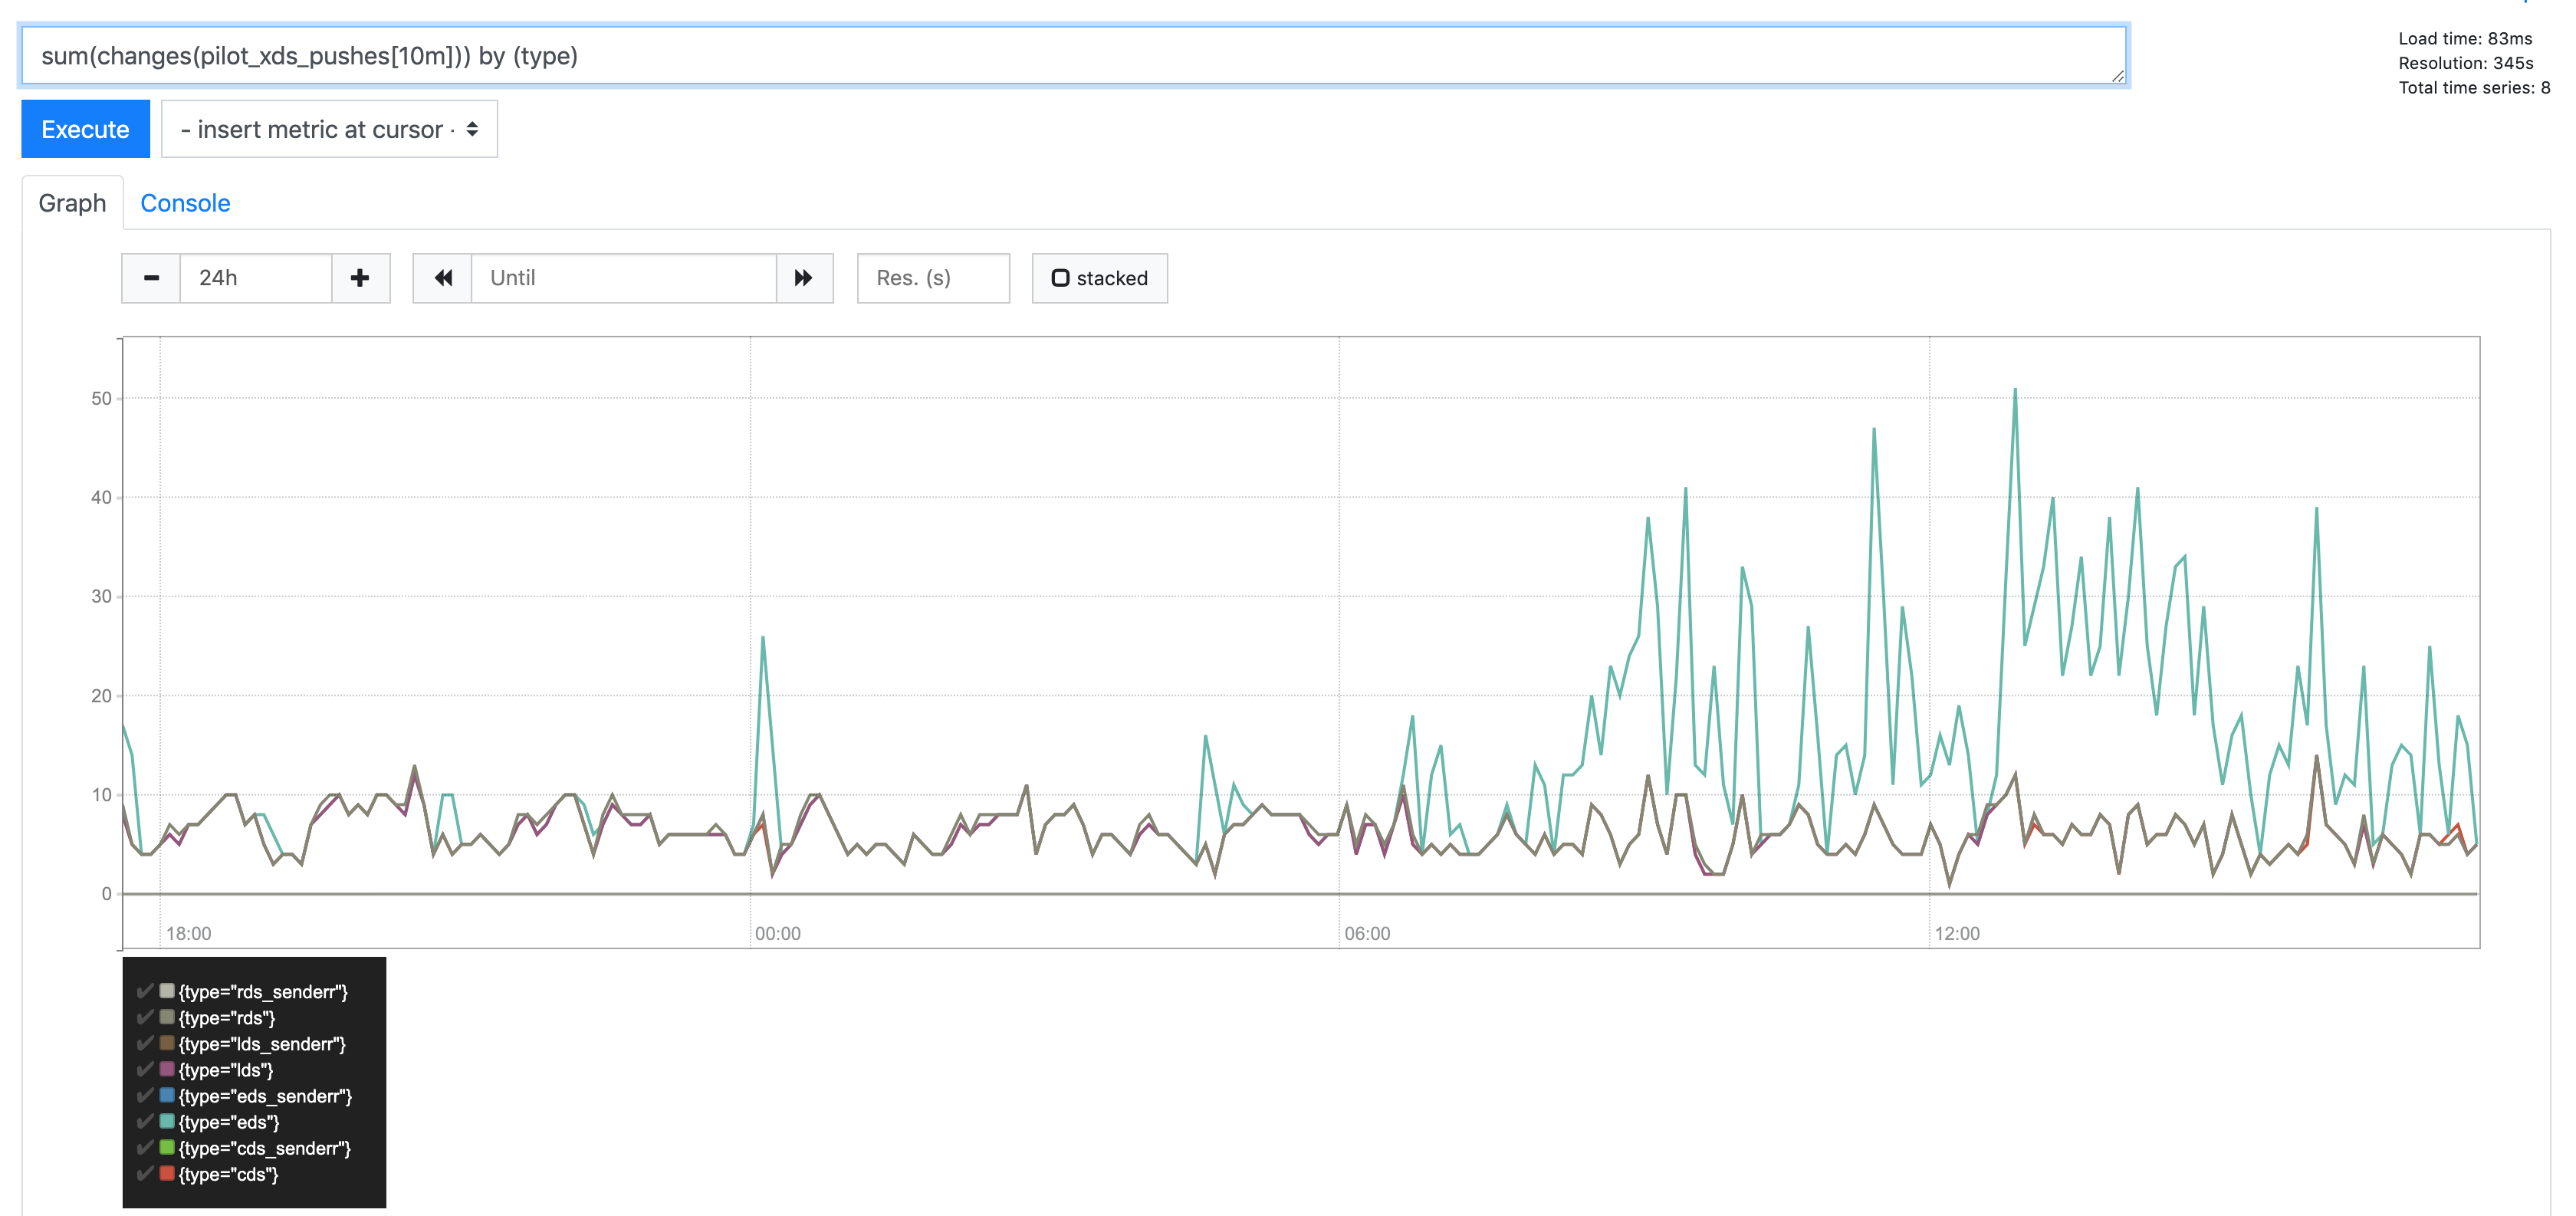
@howardjohn asked me to scale istio-pilot to 0 in preprod to see what happened
Here you can see it scaling down and the pushes stopping:
But in the same window, UC errors persist:
Stono
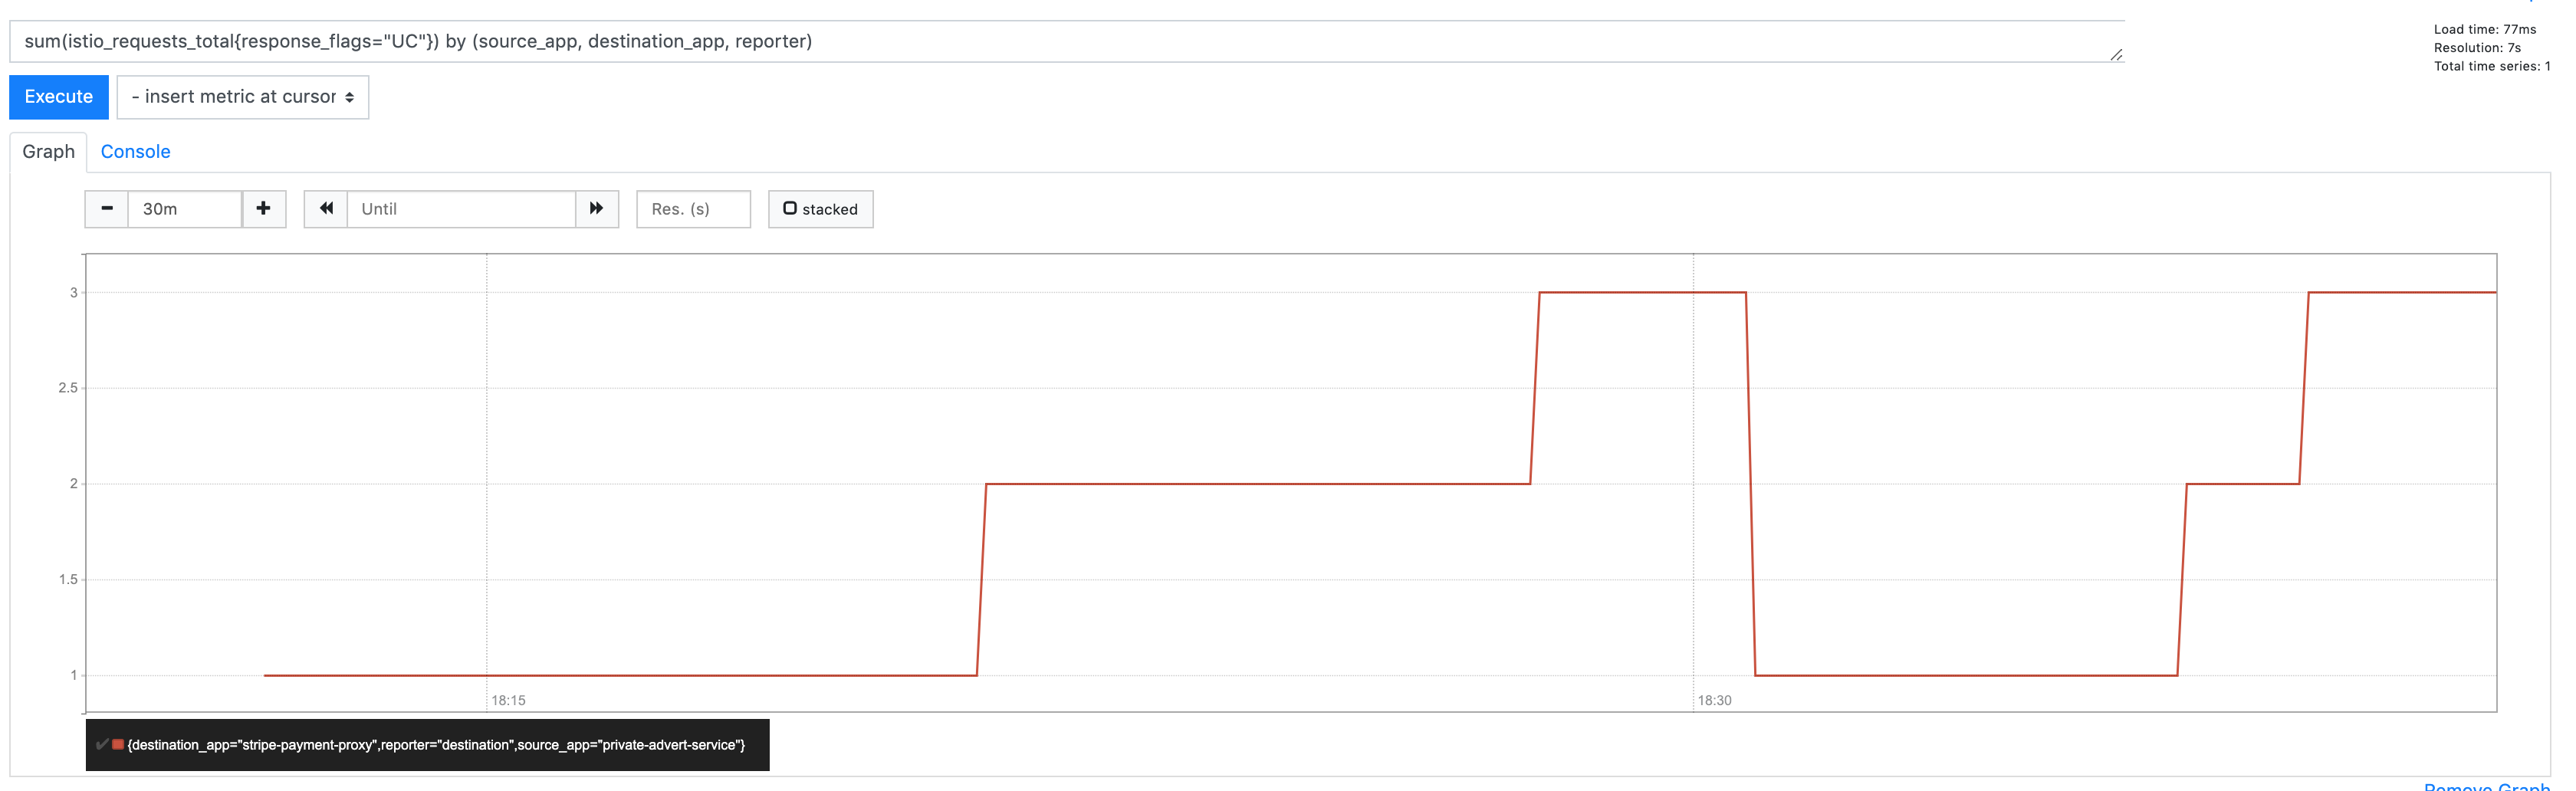
on 13 May 2019
Hi All.
I did a packet capture on the envoy sidecar of an application we're seeing the UC errors on. If I'm reading it correctly, it seems to show the traffic come from consumer-gateway (source pod), get intercepted by istio proxy and then a response comes from istio proxy on seo-gateway (destination-app) back to consumer-gateway with an ACK, quickly followed by a TCP reset.
I may heva got this wrong
Here's a snippet of the capture

I may have gotten this wrong as I'm new to the networking of the istio sidecar. This may be of no use but I thought I'd include it against this issue in case it means anything to anyone.
Cheers
Chris
 chrismckean
on 15 May 2019
chrismckean
on 15 May 2019
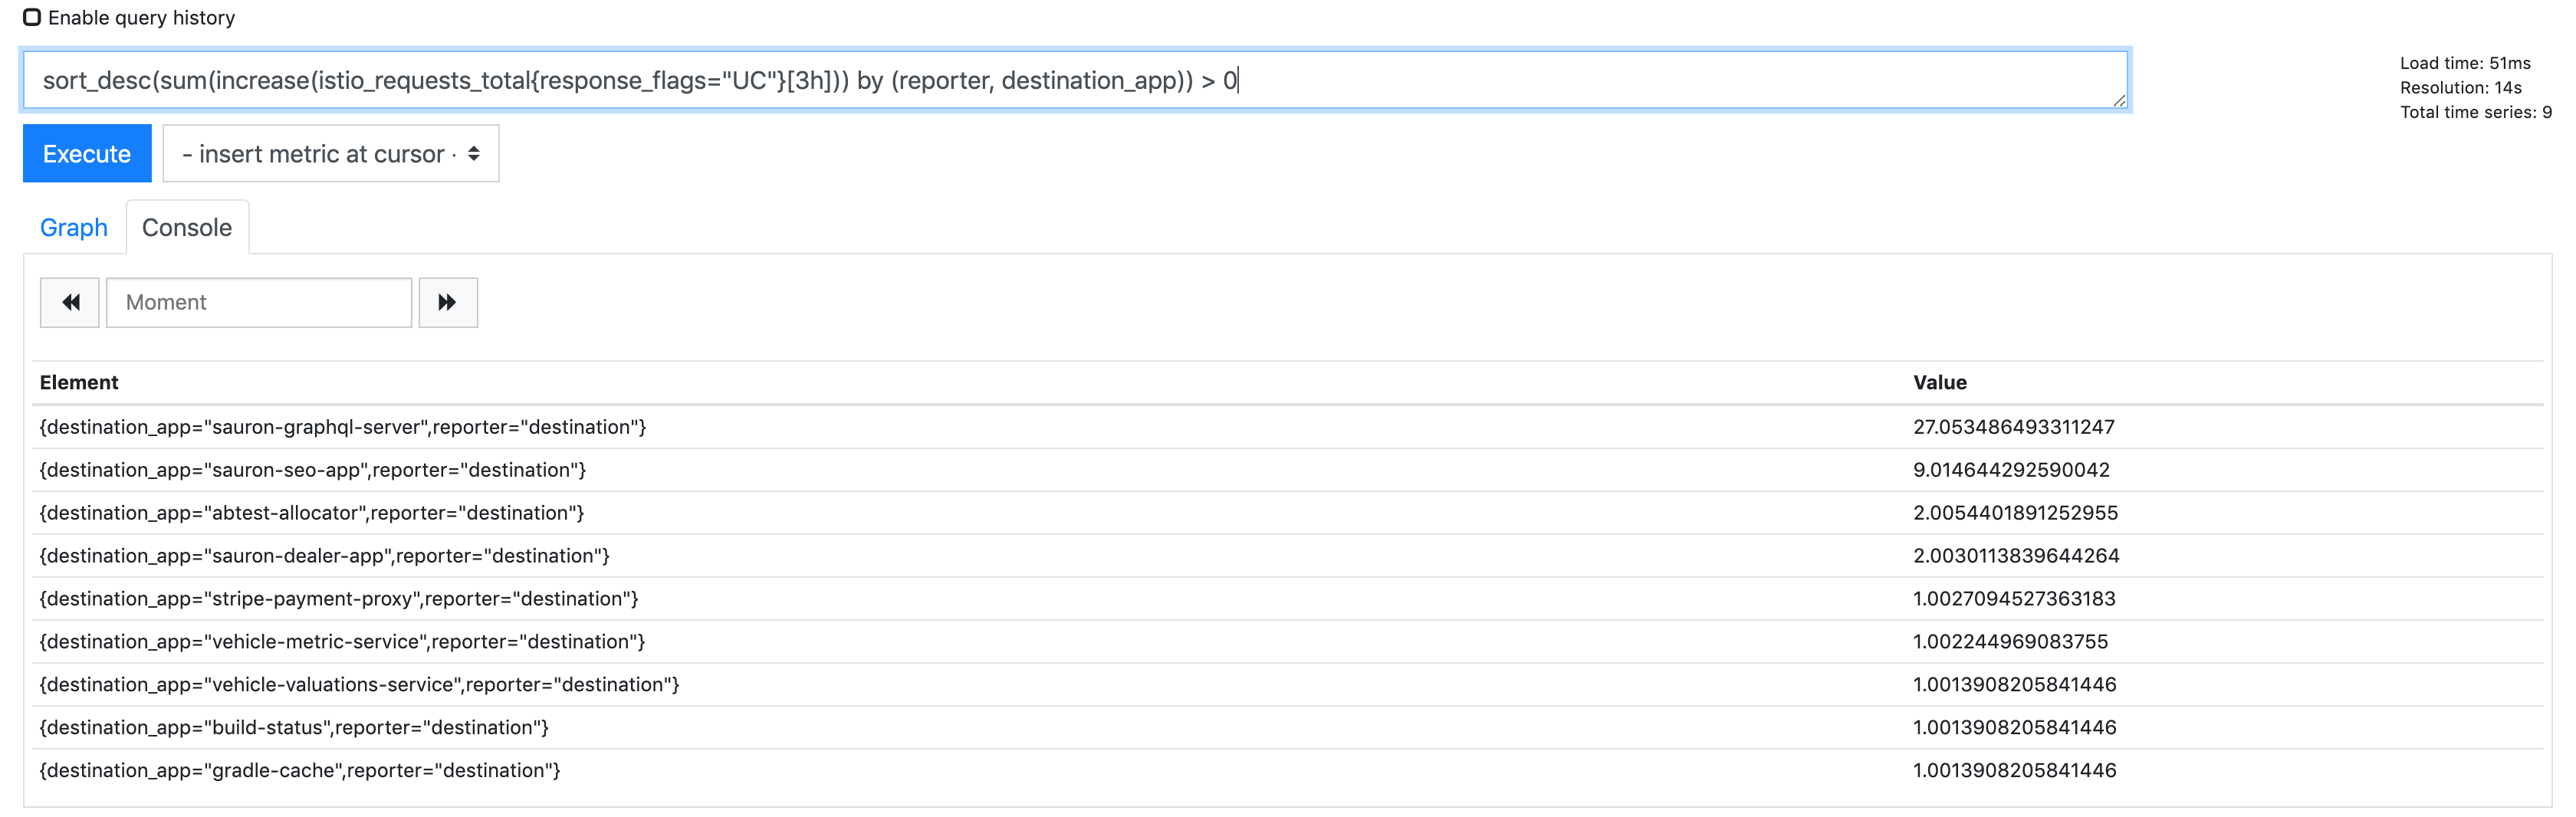
Something I've noticed by the way; make sure you set mixer.adapters.prometheusmetricsExpiryDuration to something like 6h, otherwise the default is 10m and you'll lose 503's caused by UC's as they're quite intermittent and often more than 10m apart (cc @douglas-reid - 10m maybe feels a little low as a default?).
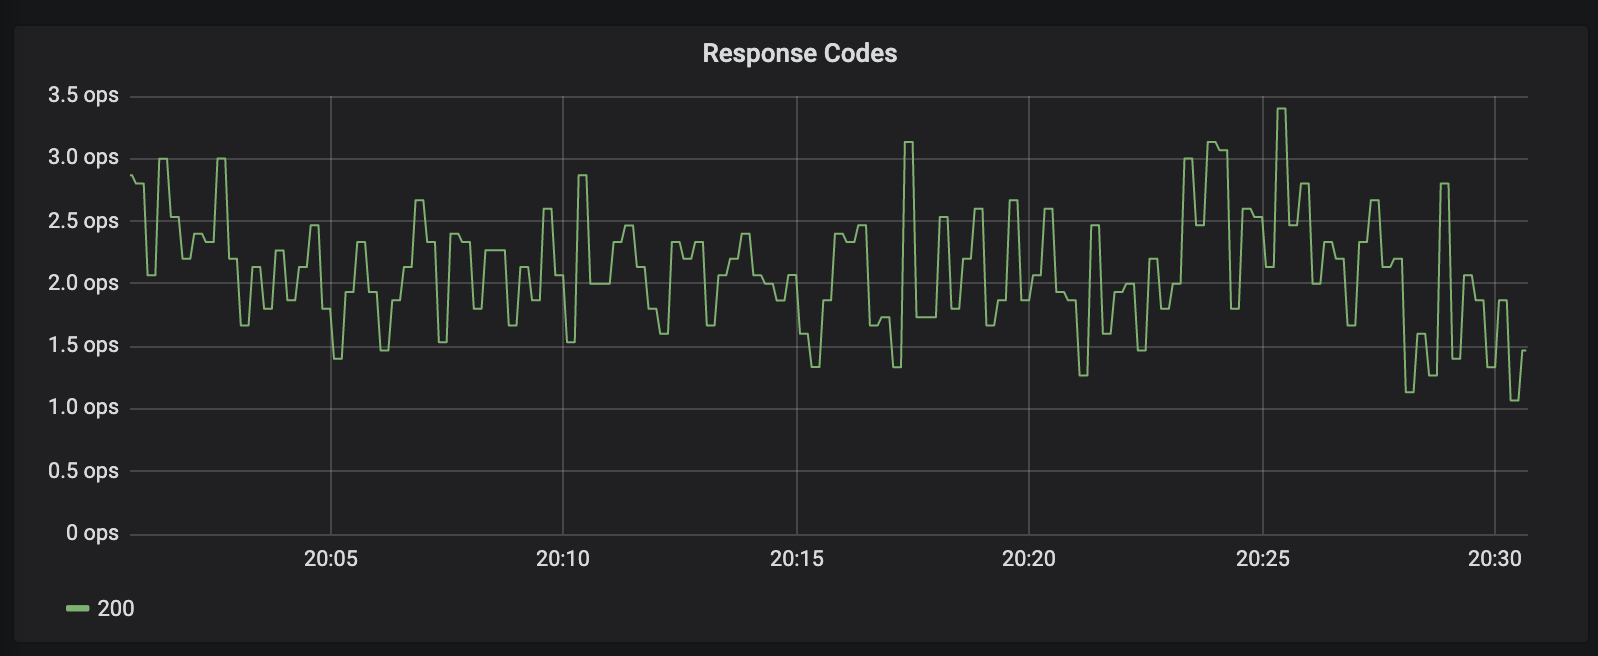
Here's the increase for us over the last 3 hours:
Stono
on 15 May 2019
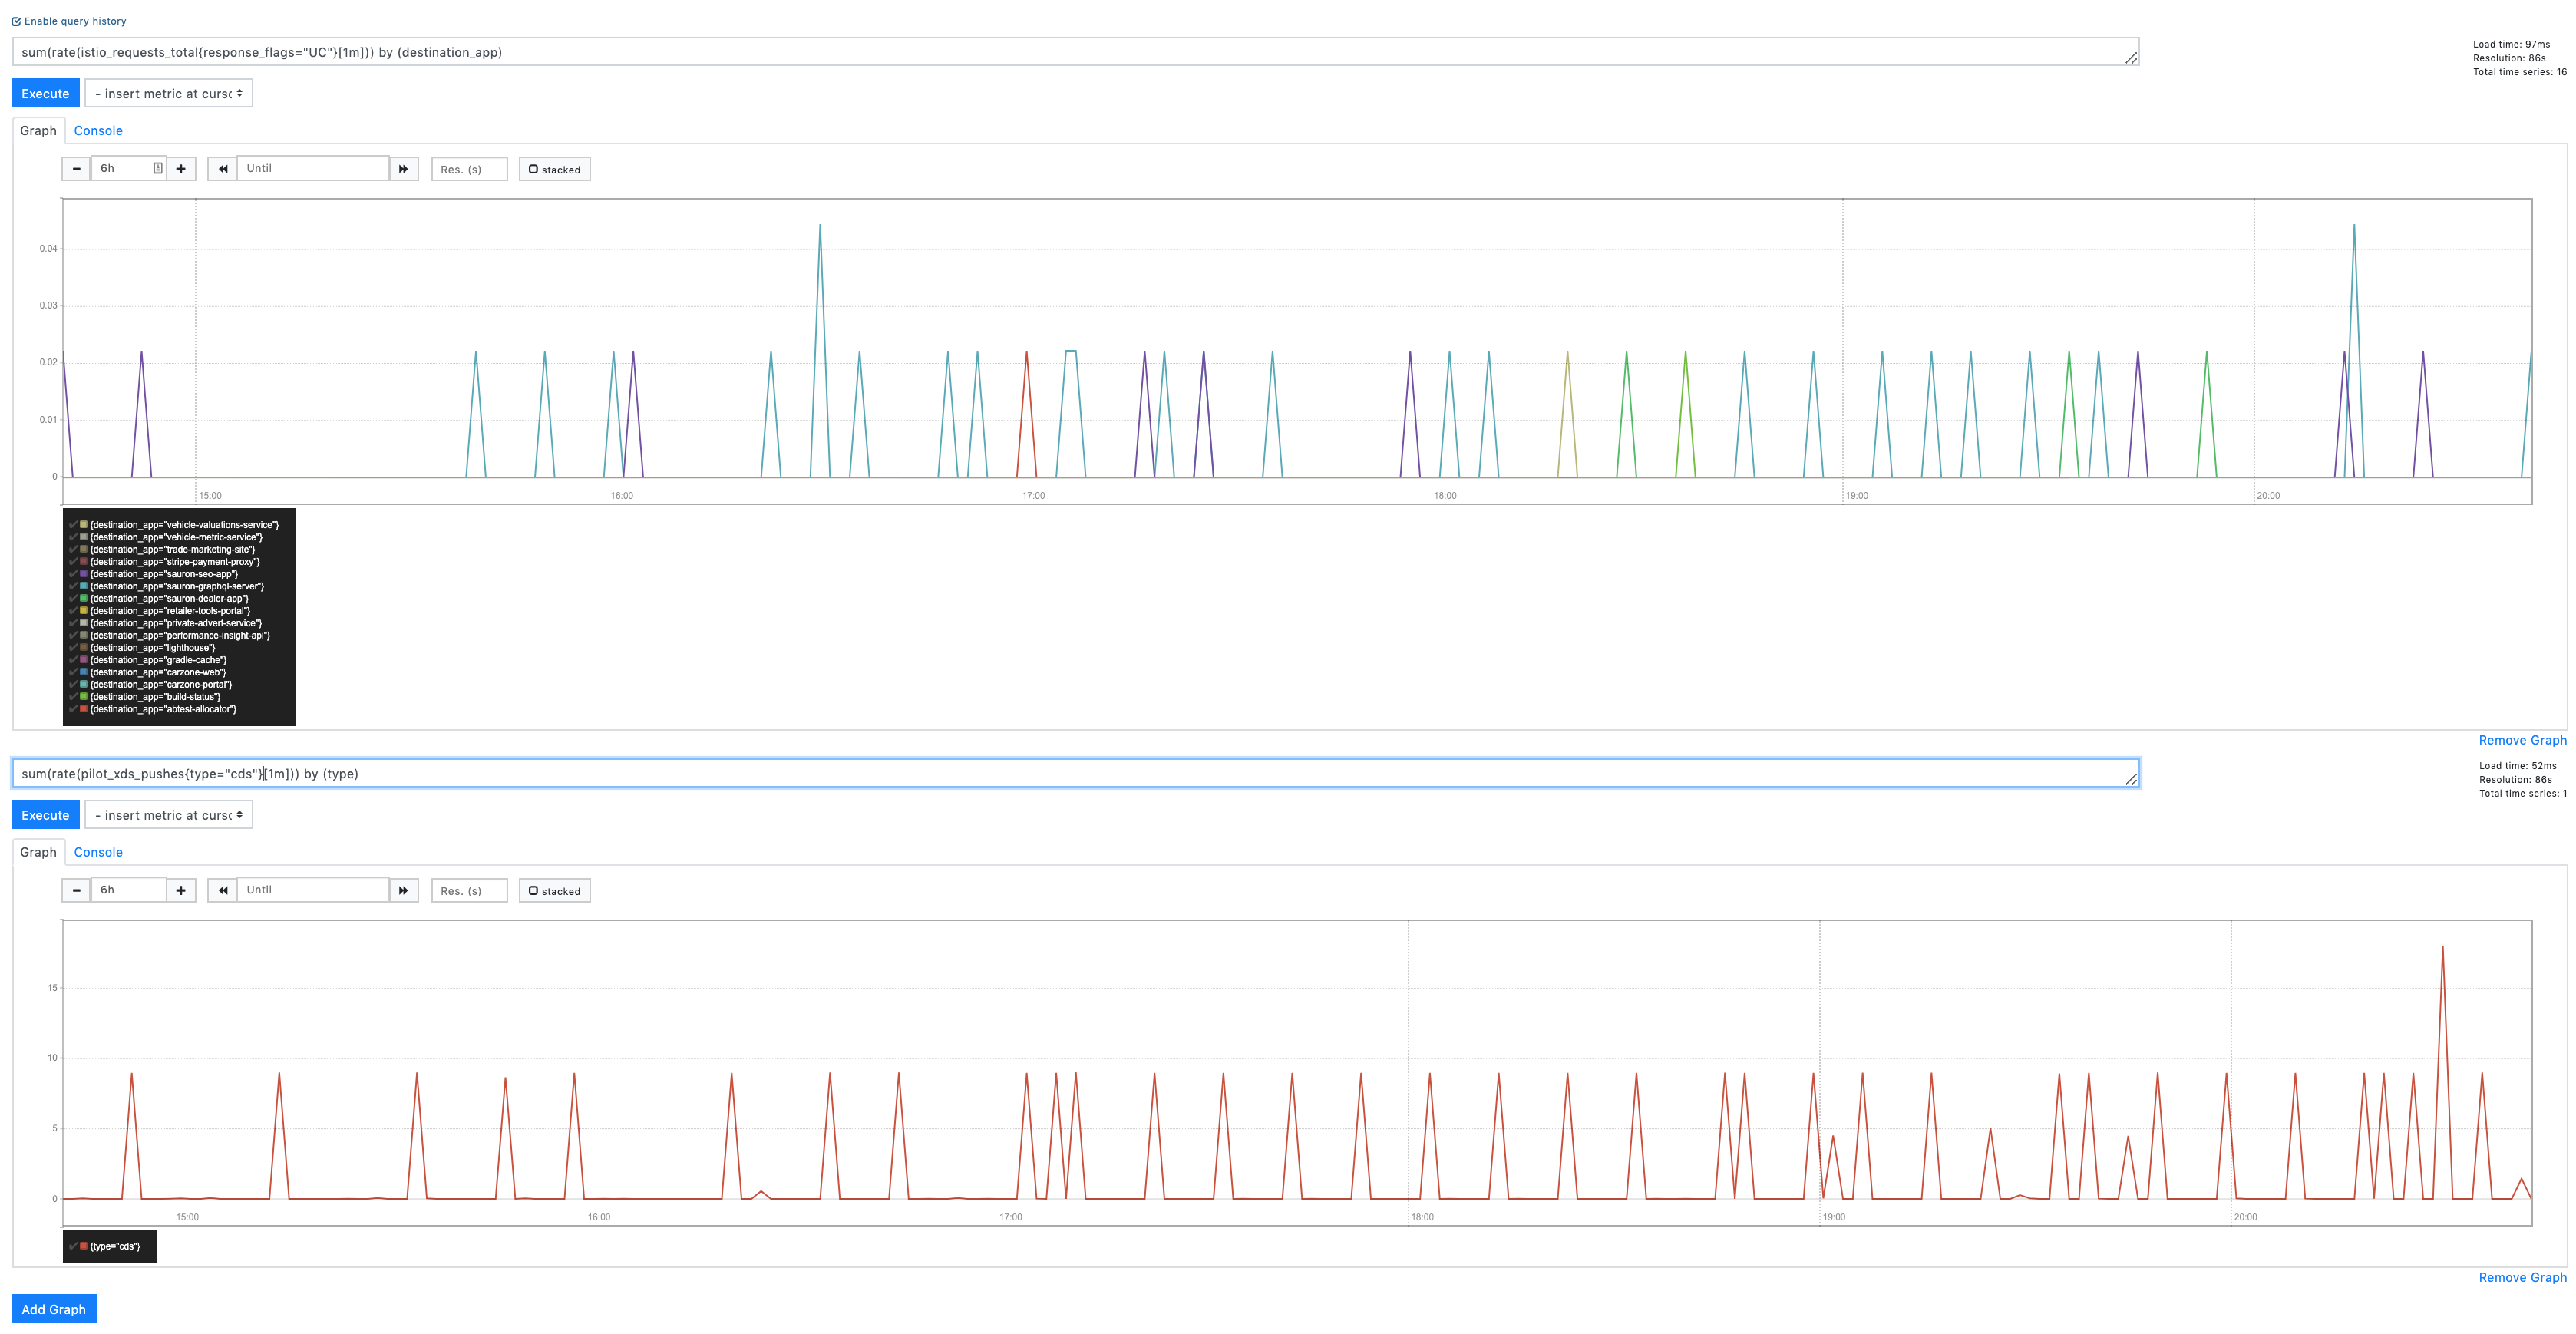
CDS Pushes vs UC's:
Stono
on 15 May 2019
Interesting read https://github.com/envoyproxy/envoy/issues/3028
Stono
on 16 May 2019
apiVersion: apps/v1
kind: Deployment
metadata:
  name: fortio-server
spec:
  selector:
    matchLabels:
      app: fortio-server
  template:
    metadata:
      labels:
        app: fortio-server
    spec:
      containers:
      - name: fortio-server
        image: fortio/fortio
        # image: paulbouwer/hello-kubernetes:1.5
        resources:
          limits:
            memory: "128Mi"
            cpu: "500m"
        ports:
        - containerPort: 8080
---
apiVersion: v1
kind: Service
metadata:
  name: fortio-server
spec:
  selector:
    app: fortio-server
  ports:
  - name: http
    port: 80
    targetPort: 8080
---
apiVersion: apps/v1
kind: Deployment
metadata:
  name: fortio-client
spec:
  selector:
    matchLabels:
      app: fortio-client
  template:
    metadata:
      labels:
        app: fortio-client
    spec:
      containers:
      - name: fortio-client
        image: fortio/fortio
        args:
          - load
          - -t
          - "0"
          - -c
          - "10"
          - -qps
          - "100"
          - http://fortio-server/
        resources:
          limits:
            memory: "128Mi"
            cpu: "500m"
I deployed 20 replicas of each. In steady state all is good, when I bounce all of the servers I see the huge spikes (consistently). Bouncing the clients does nothing.
@silentdai @PiotrSikora @Stono
Edit: talked with Karl, maybe not directly relevant as this is only when bouncing, his is during steady state
howardjohn
on 16 May 2019
The new data is very useful. Thanks everyone.
@silentdai is working on the Envoy aspects of this, but I think we can't entirely put this on Envoy. Envoy does not know about these cluster lifecycle events ahead of time unless the control plane tells it. Without that knowledge Envoy has to react and retry. I think the best we can do there is merge https://github.com/envoyproxy/envoy/pull/6578 (@silentdai I think we are waiting for you to give @Stono an image to try, please give us an update on that) and use retries for the remaining cases. There may be additional bugs in this area, but expect there to always be some retries. As I've argued previously, there are cases in networking where retries are the only thing that can be done and they shouldn't necessarily be viewed as a bad thing. Still, we do need to eliminate unnecessary causes of retries and I think that Envoy PR will help with that.
Much more recently, @philrud has started looking into the control plane aspects of this. Please bear with him since he's just getting started. @philrud is really going to try to understand how cluster lifecycle events produce 503s (e.g,. autoscaling up/down in a hurry, various upgrade scenarios), write more distributed systemsy integration/stress tests around this, and see if we can improve ordering so Envoy is less likely to have to react to network events that cause 503s in the first place. I think this effort will start producing results soon, but overall is a many month project.
So both of them are working on this, but please be kind to them. I hear the frustration (mostly evident on other issues like https://github.com/istio/istio/issues/9113 and https://github.com/istio/istio/issues/14075), but understand that they are trying to help and their effectiveness will be diminished if too much unhappiness is directed their way.
Thank you
duderino
on 16 May 2019
@duderino I can also take any test image to help out here :-)
 emedina
on 16 May 2019
emedina
on 16 May 2019
Hi,
I have already tried the build with https://github.com/envoyproxy/envoy/pull/6578 and it made no difference unfortunately. @emedina if you want to try it, it's: gcr.io/lambdai-experiment/proxyv2:forstono (1.1.6 based)
Cluster lifecycle events aren't a huge concern for me; ironically we are able to do application rollouts without any 503 or UC's (see https://github.com/istio/istio/issues/12183). Fortio etc will always show 503's during server restarts because the servers won't be gracefully draining connections and you have a race condition between envoy and the server (which we mitigate with a preStop hook). Improvements in this space are welcome but to be clear it isn't the subject of my original post.
It's 503s caused by UCs during normal operation that do worry me, where there are no associated lifecycle events, a source envoy unable to read from a destination envoy on a connection it believes to be alive, and needing to retry to the next candidate.
As I've argued previously, there are cases in networking where retries are the only thing that can be done and they shouldn't necessarily be viewed as a bad thing
Absolutely, we run clusters spread across availability zones across many vm's, there's plenty of points for network failure and I accept and want network level retries, but as I mentioned in https://github.com/istio/istio/issues/13851 i do worry about istios default retry policy which is not just network level, it breaches into the http domain and can retry things that should not be retried by default, but to disable that behaviour at the moment would bring all these UC errors to the surface as actual impacting errors.
I hear the frustration (mostly evident on other issues like #9113 and #14075)
I understand, and frankly yeah we are frustrated but will try to tone it down and be more considerate.
All I ask for is to keep us updated with progress. It's extremely difficult to see people actively talking about features, developments of new features in 1.2 etc but four days of silence on an issue which is really quite severe, we just feel lost as to what else we can do to help. I'm sure there are things going on behind the scenes to investigate it, but we can't see that - so just make it a little more visible and I'm sure concerns will be allayed.
Stono
on 16 May 2019
As an FYI; as I mentioned earlier one we had issues with clients that were doing their own connection pooling, it was getting to a point where it reached its connection pool limit and then was dying. My theory was that those clients pooling connections were holding onto connections that had otherwise been UC'd and then those connections weren't being released.
In one of those clients we implemented https://hc.apache.org/httpcomponents-core-ga/httpcore/apidocs/org/apache/http/impl/NoConnectionReuseStrategy.html, and we haven't had any problems with that application since.
This was an application which has been migrated to istio, and works fine on the old infra.
I'm not sure what this tells us, but it does all feel related.
Stono
on 16 May 2019
@silentdai @duderino @howardjohn I have 0 503s/UCs if i disable connection reuse:
DestinationRule:
  spec:
    host: app
    trafficPolicy:
      connectionPool:
        http:
          maxRequestsPerConnection: 1
Previously we were running with 1024 which was likely far too high but we wanted to minimise the overhead of mTLS. Obviously this isn't a solution, as it more than doubles the CPU overhead for the sidecar (likely all the mTLS overhead), but it does point the finger at the connection between the source and destination envoy not being kept alive or being DC'd without the source knowing.
I'm going to try and find a sensible value for this today which gives me little to no 503's but acceptable connection reuse. So far I've tried it as low as 32 and still see issues so working our way up from 2.
I found this comment quite interesting too along with https://github.com/envoyproxy/envoy/issues/3634.
Stono
on 17 May 2019
Digging into this more, this PR by @rshriram defaults maxRequestsPerConnection: 1 which is probably why you don't see 503's on a default istio install, and why we are seeing them with maxRequestsPerConnection anything above around 10.
It does feel like we should be able to use maxRequestsPerConnection without retries. We have an idleTimeout of 4m so the source envoy should be well aware that the upstream envoy has closed the connection.
Stono
on 17 May 2019
Apologies that pr was never merged
Stono
on 17 May 2019
maxRequestsPerConnection is indicating always use the new connection between source envoy and dest envoy. There is no connection pool so the connection disconnected won't bite the following requests.
The image I provided should prevent a connection reuse when the connection is disconnected. Still unknown why it didn't work.
The next thing we should explore is how the connection is broken. In https://github.com/kubernetes/client-go/issues/527#issuecomment-454255493 it was because of components other than istio(ELB). It could be something else in @Stono 's case.
lambdai
on 17 May 2019
As @Stono is changing maxRequestsPerConnection: Are you seeing UC rate variation?
lambdai
on 17 May 2019
@silentdai we've settled on around 3 at the moment, which gives us very few UC's.
As for my environment it's GKE v1.12.7-gke.10 with NetworkPolicy enabled.
@silentdai are you getting your image patch into 1.1.7 by the way? Even though I didn't see a change it is definitely a worth while back port.
Stono
on 17 May 2019
There is one source of 503 from https://github.com/istio/istio/issues/13848#issuecomment-489765188
[2019-05-06 20:22:57.559][30][debug][connection] [external/envoy/source/common/network/connection_impl.cc:461] [C19040] remote early close
We need the context of C19040, for example:
- What is the remote of the
C19040, is it another envoy or app? - Is the remote endpoint closing the connection, or an NAT/ELB in between reset the connection?
lambdai
on 17 May 2019
In my case it's _always_ another envoy, everything is on the mesh. Traffic never leaves the cluster which is why i'm tweaking the DestinationRule of the destination service.
Stono
on 17 May 2019
OK I need to head off for the evening but just to update where we're at, our DestinationRule now looks like this on all services we saw the most UCs on:
    host: app
    trafficPolicy:
      connectionPool:
        http:
          http1MaxPendingRequests: 1024
          http2MaxRequests: 10240
          idleTimeout: 4m
          maxRequestsPerConnection: 4
        tcp:
          maxConnections: 10240
          tcpKeepalive:
            interval: 1m
            time: 3m
We haven't seen any in 30 minutes now so that's a marked improvement. Will leave that in place over the weekend and report back. Downside is istio-proxy cpu usage is up due to less connection reuse.
Stono
on 17 May 2019
Suppose you are using iptables
What are the below values at your side? Both src and dest pod.
$ cat /proc/sys/net/netfilter/nf_conntrack_tcp_timeout_established
$ cat /proc/sys/net/netfilter/nf_conntrack_generic_timeout
lambdai
on 20 May 2019
So I've been doing a lot more digging with envoy metrics to try and get to the bottom of this now.
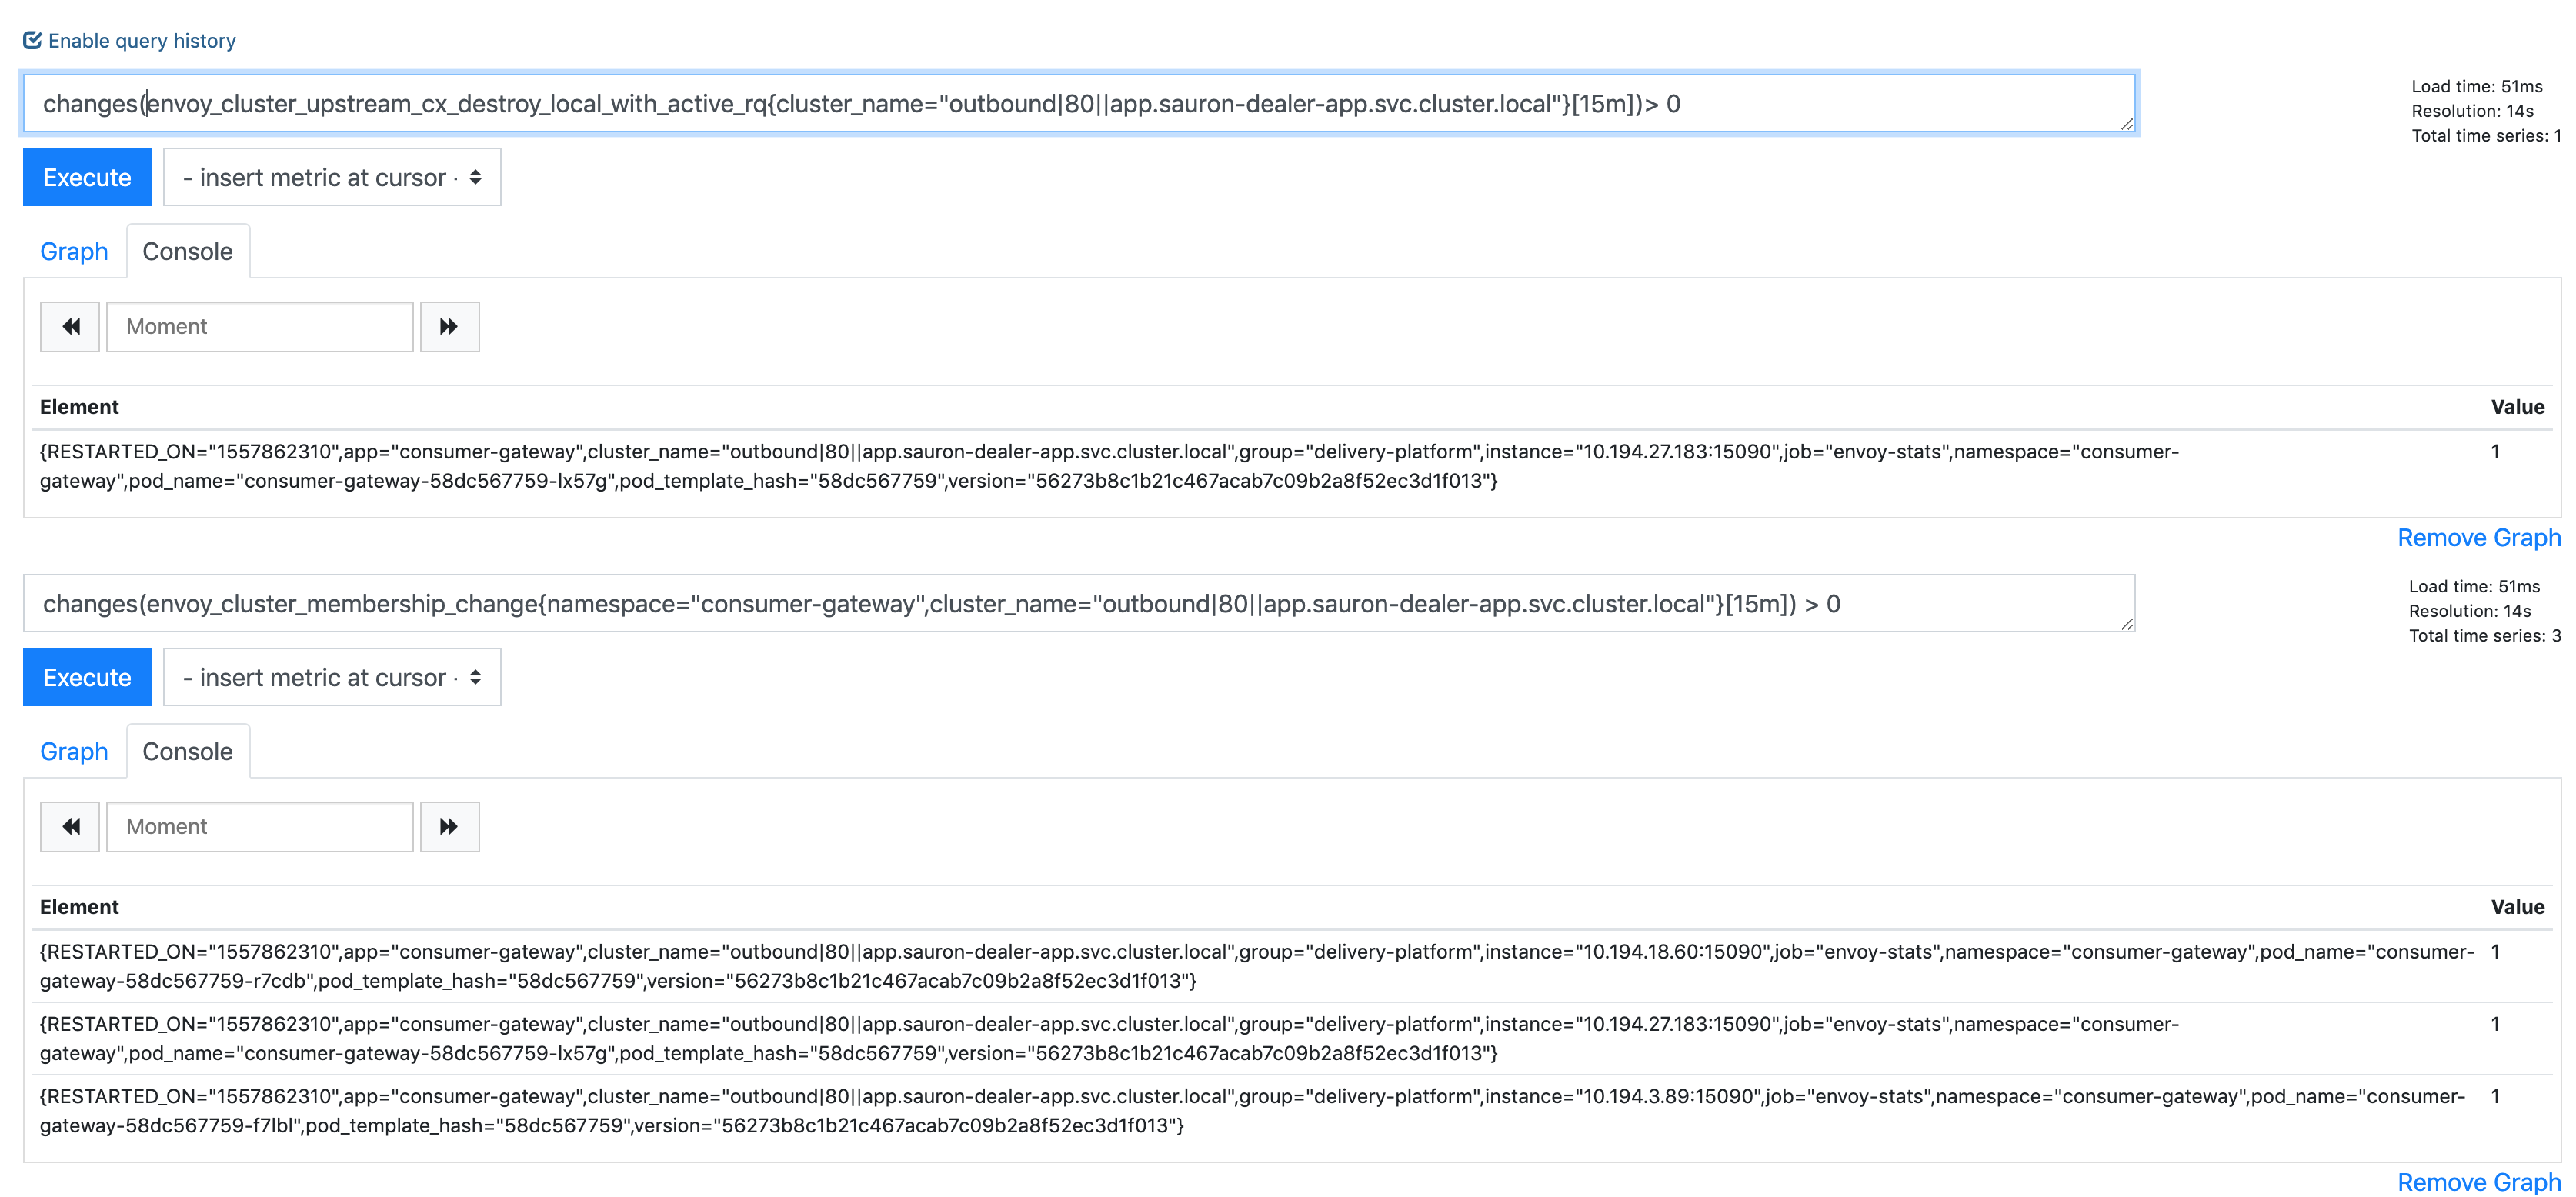
I've just correlated a 503UC to this event envoy_cluster_upstream_cx_destroy_local_with_active_rq on the source app, and it seemed to coinside with a envoy_cluster_membership_change.
In this particular example: consumer-gateway -> sauron-seo-app
To answer your timeout question:
[atcloud@consumer-gateway-58dc567759-lx57g app]$ cat /proc/sys/net/netfilter/nf_conntrack_tcp_timeout_established
432000
[atcloud@consumer-gateway-58dc567759-lx57g app]$ cat /proc/sys/net/netfilter/nf_conntrack_generic_timeout
600
[atcloud@sauron-seo-app-5cc488b44b-hglcl app]$ cat /proc/sys/net/netfilter/nf_conntrack_tcp_timeout_established
432000
[atcloud@sauron-seo-app-5cc488b44b-hglcl app]$ cat /proc/sys/net/netfilter/nf_conntrack_generic_timeout
600
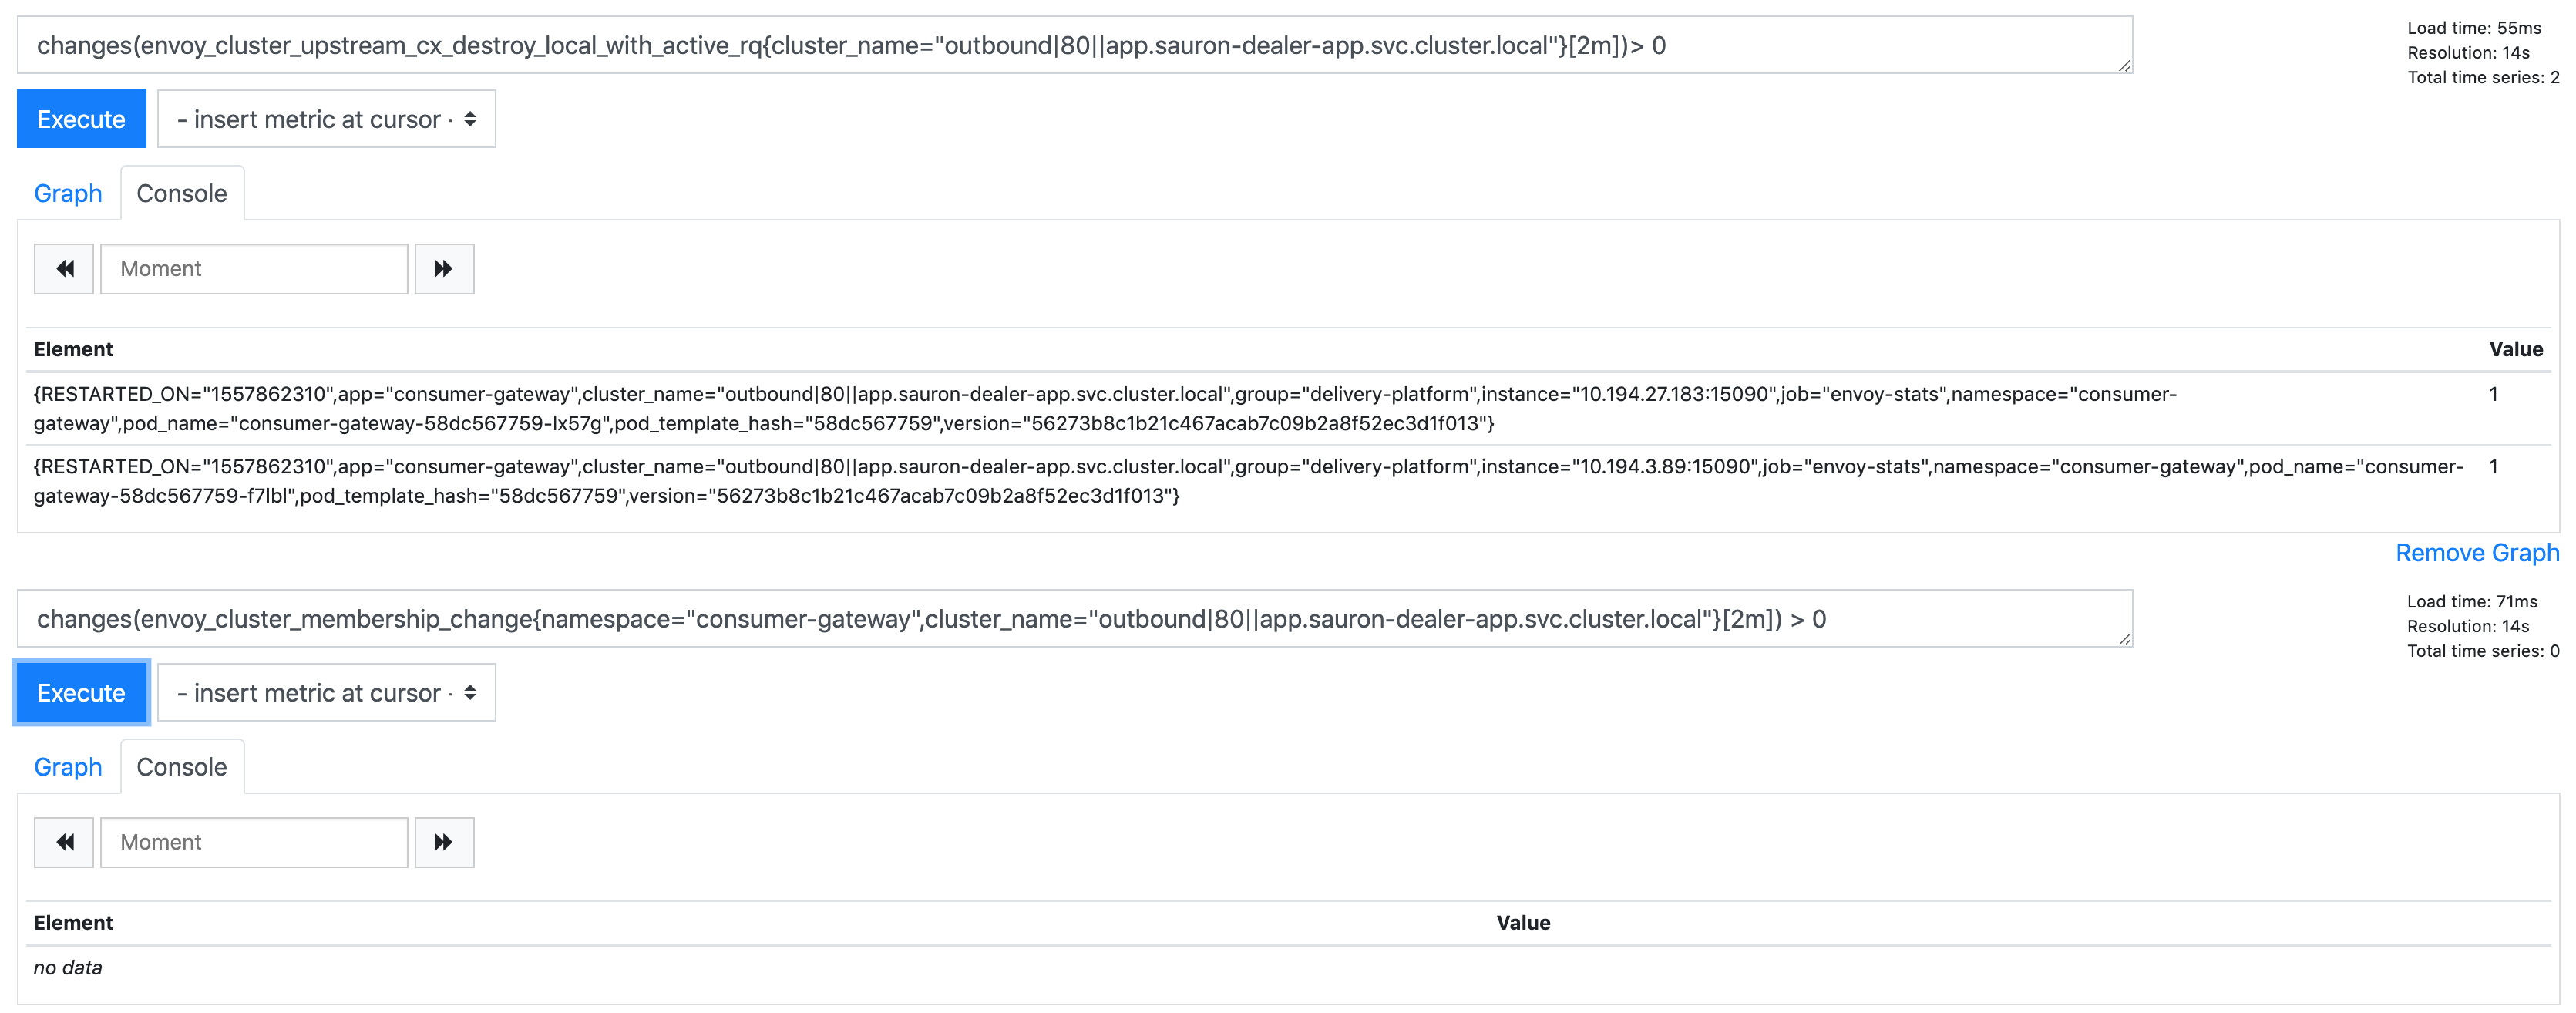
Maybe the envoy_cluster_membership_change was a red herring as it just happened again with envoy_cluster_upstream_cx_destroy_local_with_active_rq, but no envoy_cluster_membership_change:
I suppose the interesting thing about this one is two source apps errord at the same time.
Stono
on 20 May 2019
Reading the envoy docs https://www.envoyproxy.io/docs/envoy/latest/configuration/cluster_manager/cluster_stats, envoy_cluster_upstream_cx_destroy_local_with_active_rq quite worryingly reads "Total connections destroyed locally with 1+ active request".
connections destroyed with active requests!
But it might explain why in https://github.com/istio/istio/issues/13851 i saw a 503 mid request.
Anyway for context; this service is quite infrequently accessed compared to the others, so it looks to me like a connection is pooled which can't be used:
[atcloud@consumer-gateway-58dc567759-f7lbl app]$ curl -s http://127.0.0.1:15000/stats/prometheus | grep " 2$" | grep -v bucket | grep sauron-dealer-app
envoy_cluster_upstream_cx_destroy_with_active_rq{cluster_name="outbound|80||app.sauron-dealer-app.svc.cluster.local"} 2
envoy_cluster_upstream_rq_retry{cluster_name="outbound|80||app.sauron-dealer-app.svc.cluster.local"} 2
envoy_cluster_retry_upstream_rq_completed{cluster_name="outbound|80||app.sauron-dealer-app.svc.cluster.local"} 2
envoy_cluster_upstream_rq_retry_success{cluster_name="outbound|80||app.sauron-dealer-app.svc.cluster.local"} 2
envoy_cluster_retry_upstream_rq{response_code="503",cluster_name="outbound|80||app.sauron-dealer-app.svc.cluster.local"} 2
envoy_cluster_upstream_cx_destroy_local_with_active_rq{cluster_name="outbound|80||app.sauron-dealer-app.svc.cluster.local"} 2
envoy_cluster_retry_upstream_rq{response_code_class="5xx",cluster_name="outbound|80||app.sauron-dealer-app.svc.cluster.local"} 2
envoy_cluster_membership_healthy{cluster_name="outbound|9080||admin.sauron-dealer-app.svc.cluster.local"} 2
envoy_cluster_membership_total{cluster_name="outbound|9080||admin.sauron-dealer-app.svc.cluster.local"} 2
envoy_cluster_membership_healthy{cluster_name="outbound|80||app.sauron-dealer-app.svc.cluster.local"} 2
envoy_cluster_membership_total{cluster_name="outbound|80||app.sauron-dealer-app.svc.cluster.local"} 2
And perhaps idleTimeout in the DestinationRule isn't really working as expected?
Stono
on 20 May 2019
With nf_conntrack_generic_timeout=600 NAT should not reset the connection between gateway-envoy and seo-envoy, as the idleTimeout is lower than 600s.
Let me see if we can verify the idle timeout is activated.
lambdai
on 20 May 2019
TBH if you had maxRequestsPerConnection not set (so basically permanent connection pooling) and nf_conntrack_generic_timeout was the issue, we'd see UC's every 600seconds, but we don't :-)
I've just unset maxRequestsPerConnection and set idleTimeout to 30s on some of our services, will leave them overnight and see what happens
Stono
on 20 May 2019
Could you save the source envoy and dst envoy config somewhere?
kubectl -n <SRC_POD_NAMESPACE> exec -it <SRC_POD_NAME> -c istio-proxy -- curl localhost:15000/config_dump
and the dst pod.
My concern is that pilot would interpret infinite timeout as as hard-coded number instead a infinitity_max. I see this pattern a lot.
lambdai
on 20 May 2019
idle timeout definitely works btw, you can see here where i set it to a low value (30s) and as a result get more connection churn into the destination app

Stono
on 20 May 2019
I've sent you the config dumps on slack
Stono
on 20 May 2019
That shouldn't be good. IIUC active request should remain the same while the connection rate is higher
lambdai
on 20 May 2019
Yes that's what you can see there; connection rate goes up active requests stay around the same, 15s sample rate.
Stono
on 20 May 2019
Update: Unfortunately I didn't reproduce. I have some clue in my experiment.
What we should expect with the above configs
- established connection between client envoy and server envoy.
Between the client sidecar envoy and server envoy: at least one established connection. Initially created when the client app create the first request. - When the connection is closed?
It could have multiple causes. The consequences vary a lot. I cannot enumerate all. - idletimeout: client envoy would close the client. As the connection is idle no request should be on the wire. Client envoy will close the connection.
- Force close by server envoy. If there is no request on the wire, the next request from client should not see 503. Of course it is 503 if there is data on the wire. Envoy doesn't use pipeline on http 1.1 so at most 1 request is affected.
- Health check to server envoy failure. I see this from the code. It's a source of UC503. I would rather to prevent a failed health check instead of dig into the exact behaviors after hitting that failure.
lambdai
on 22 May 2019
@Stono We should not see "remote early close" unless the service is jeopardized. That's indicating expect further data when the connection is closed. We shouldn't see this as you describe it as low rps. Is there any evidence that client(xx-gateway) or the server(seo) is overloaded at the UC 503? It might not be an overall loaded but a single request congestion.
lambdai
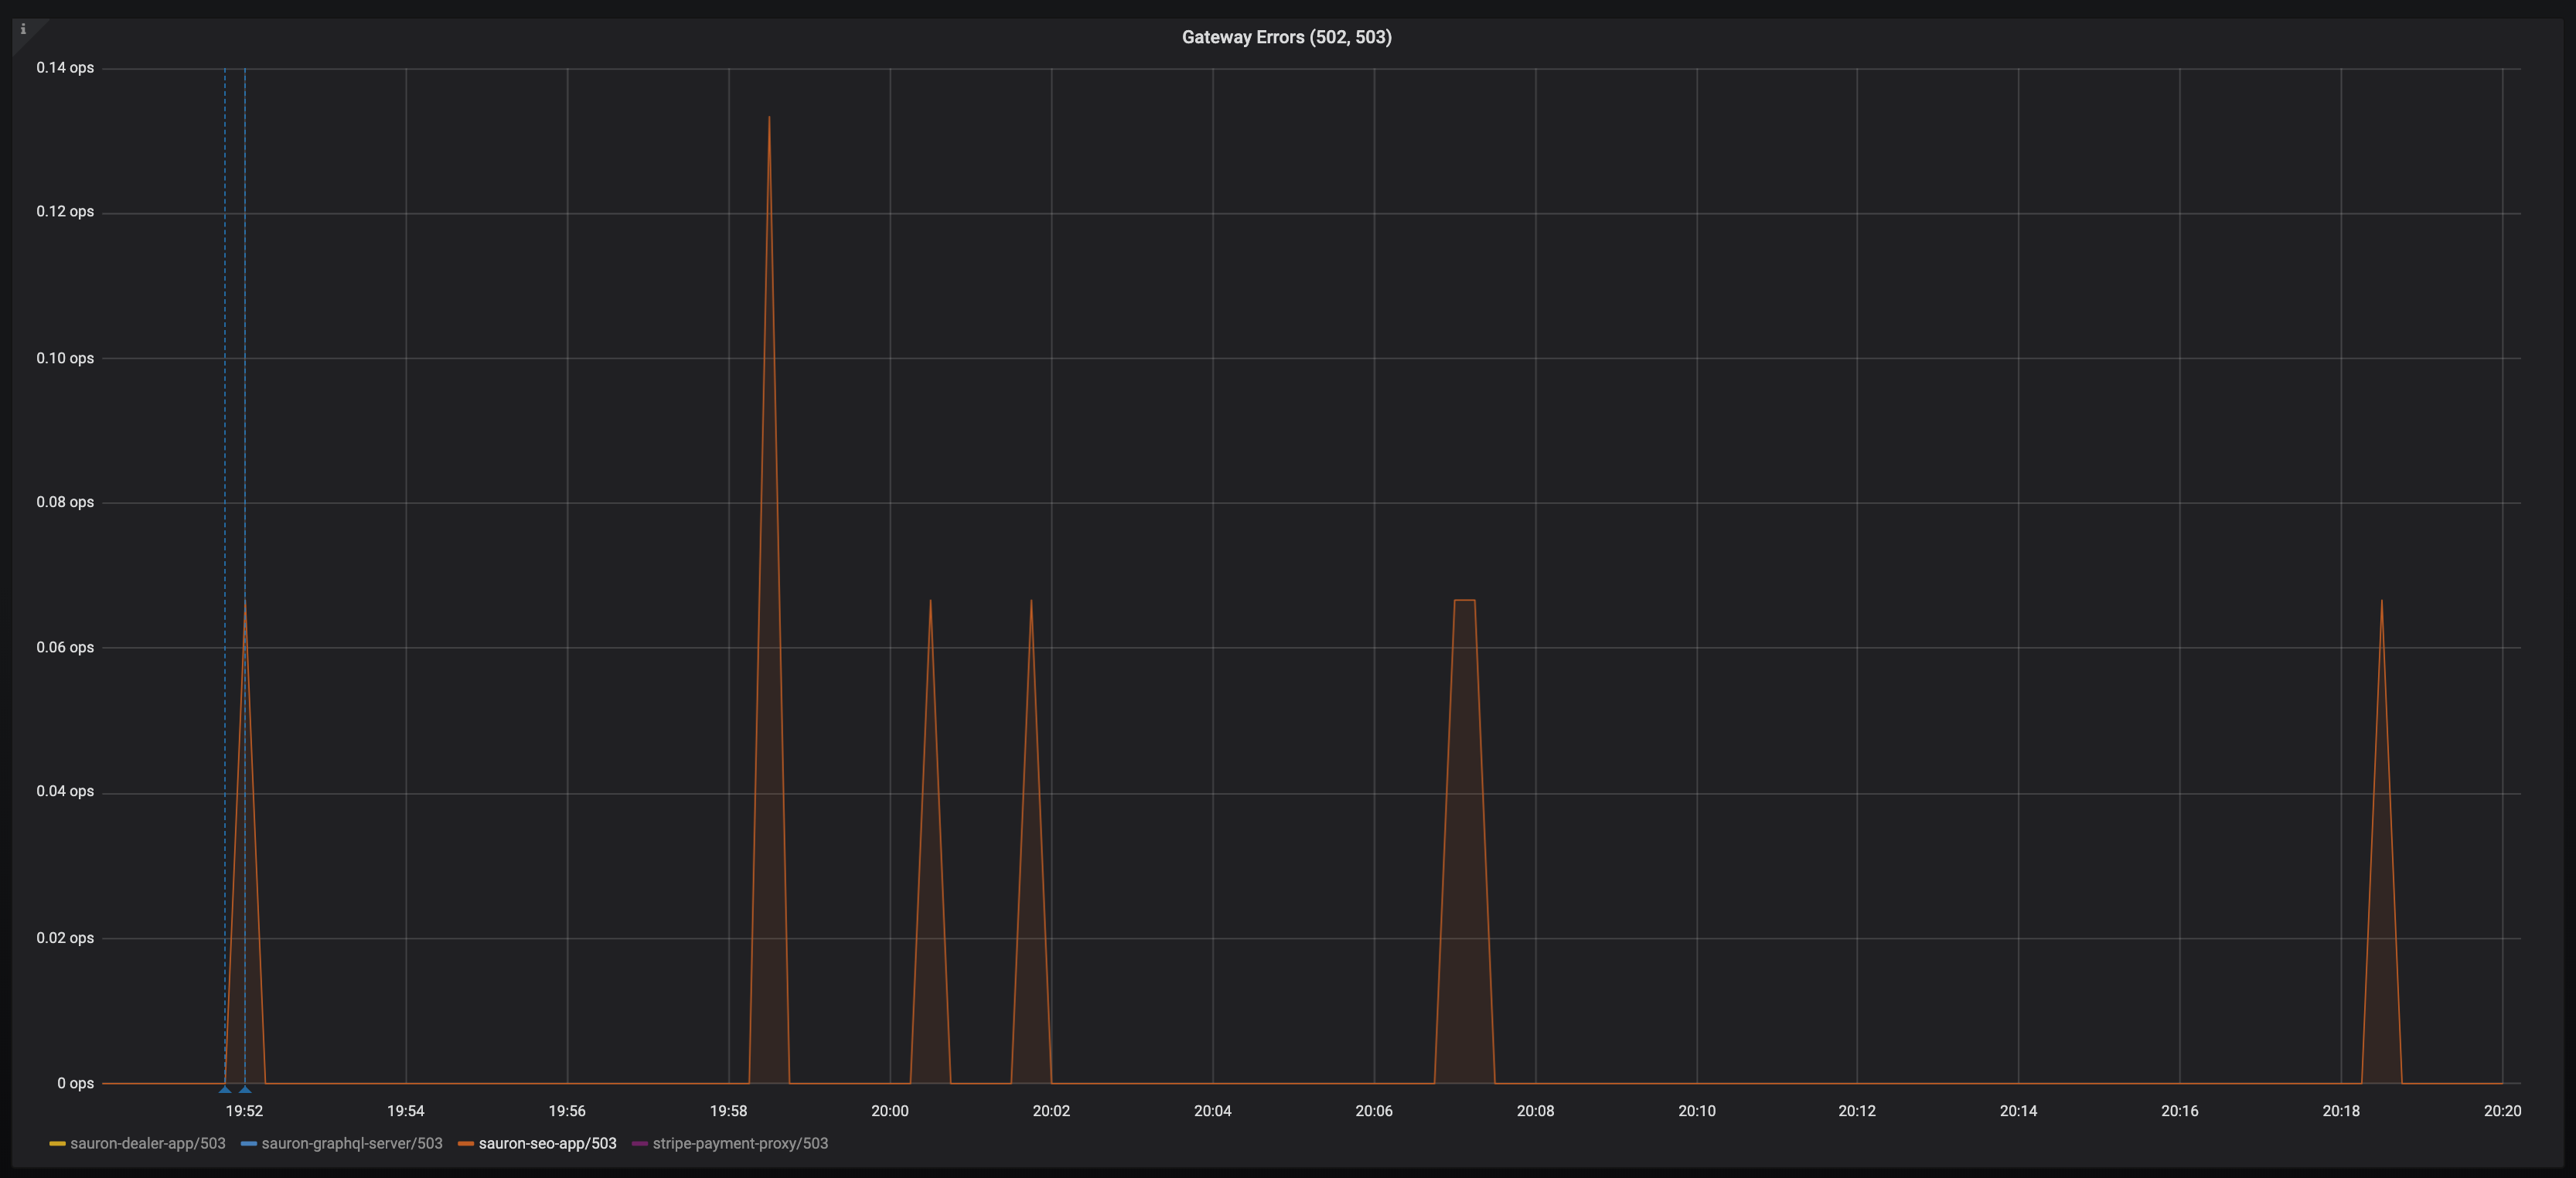
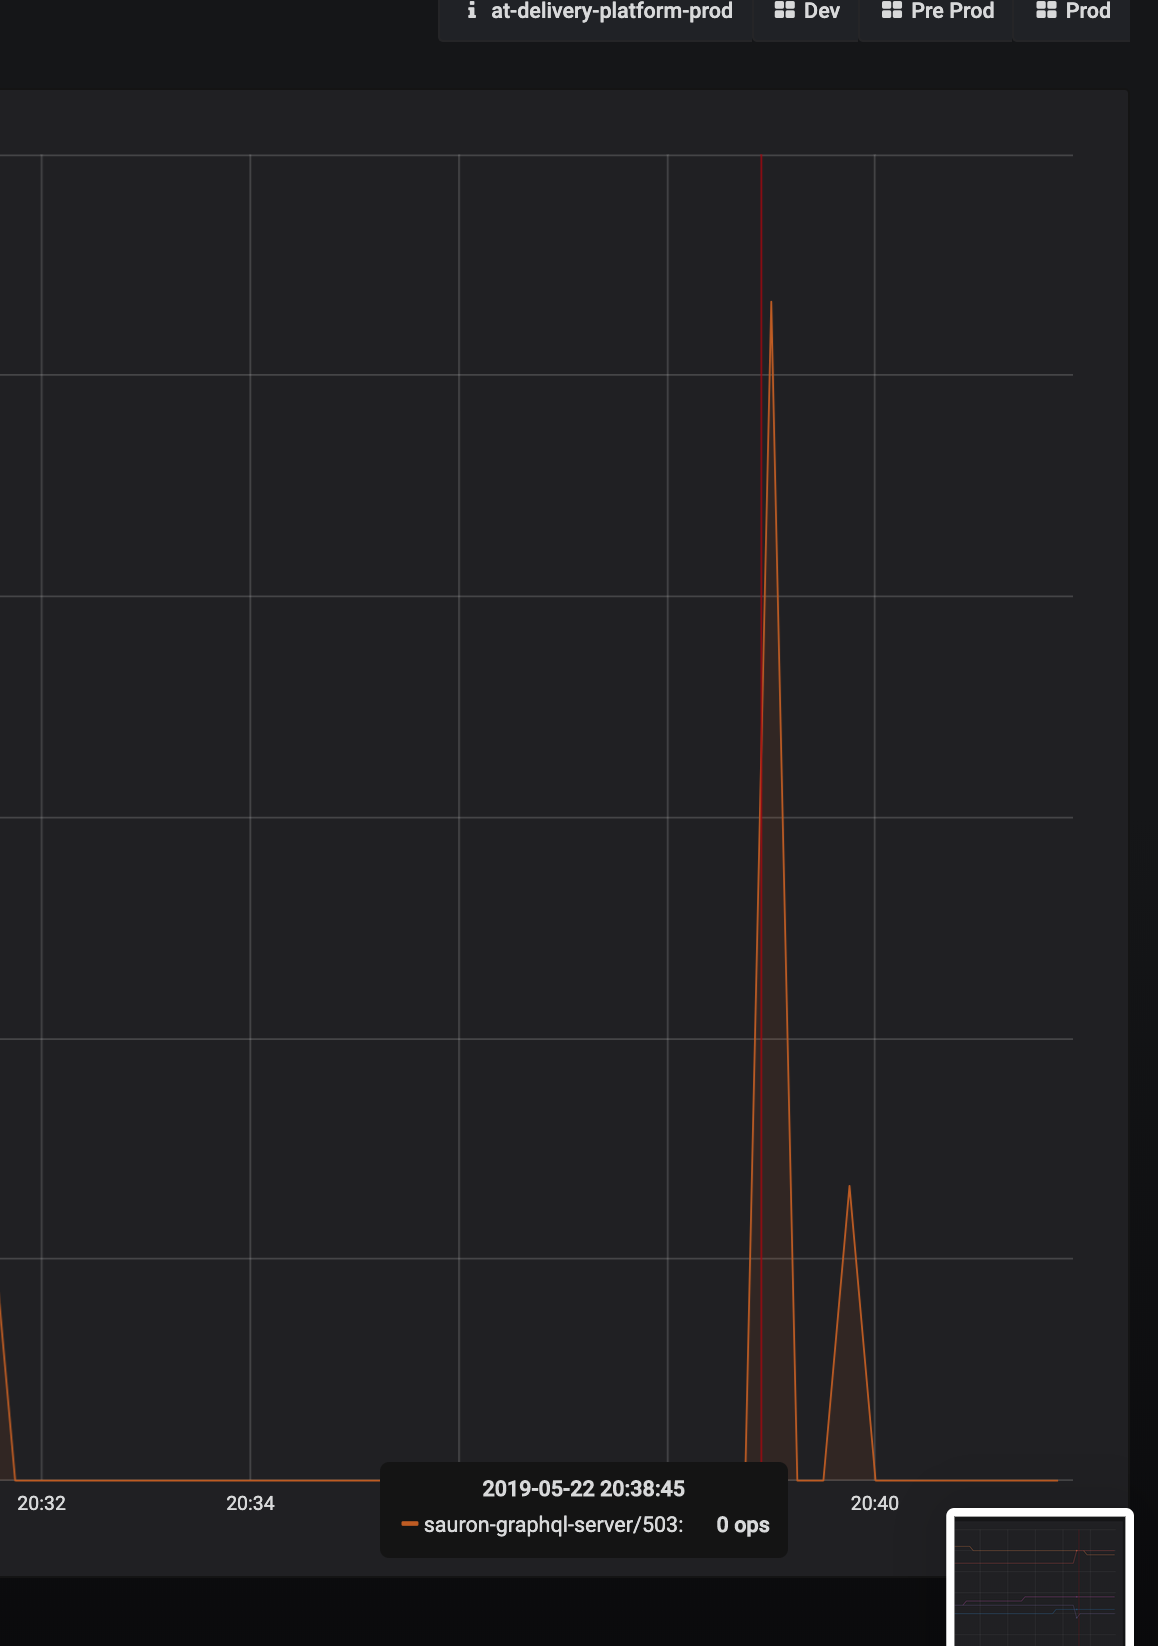
on 22 May 2019
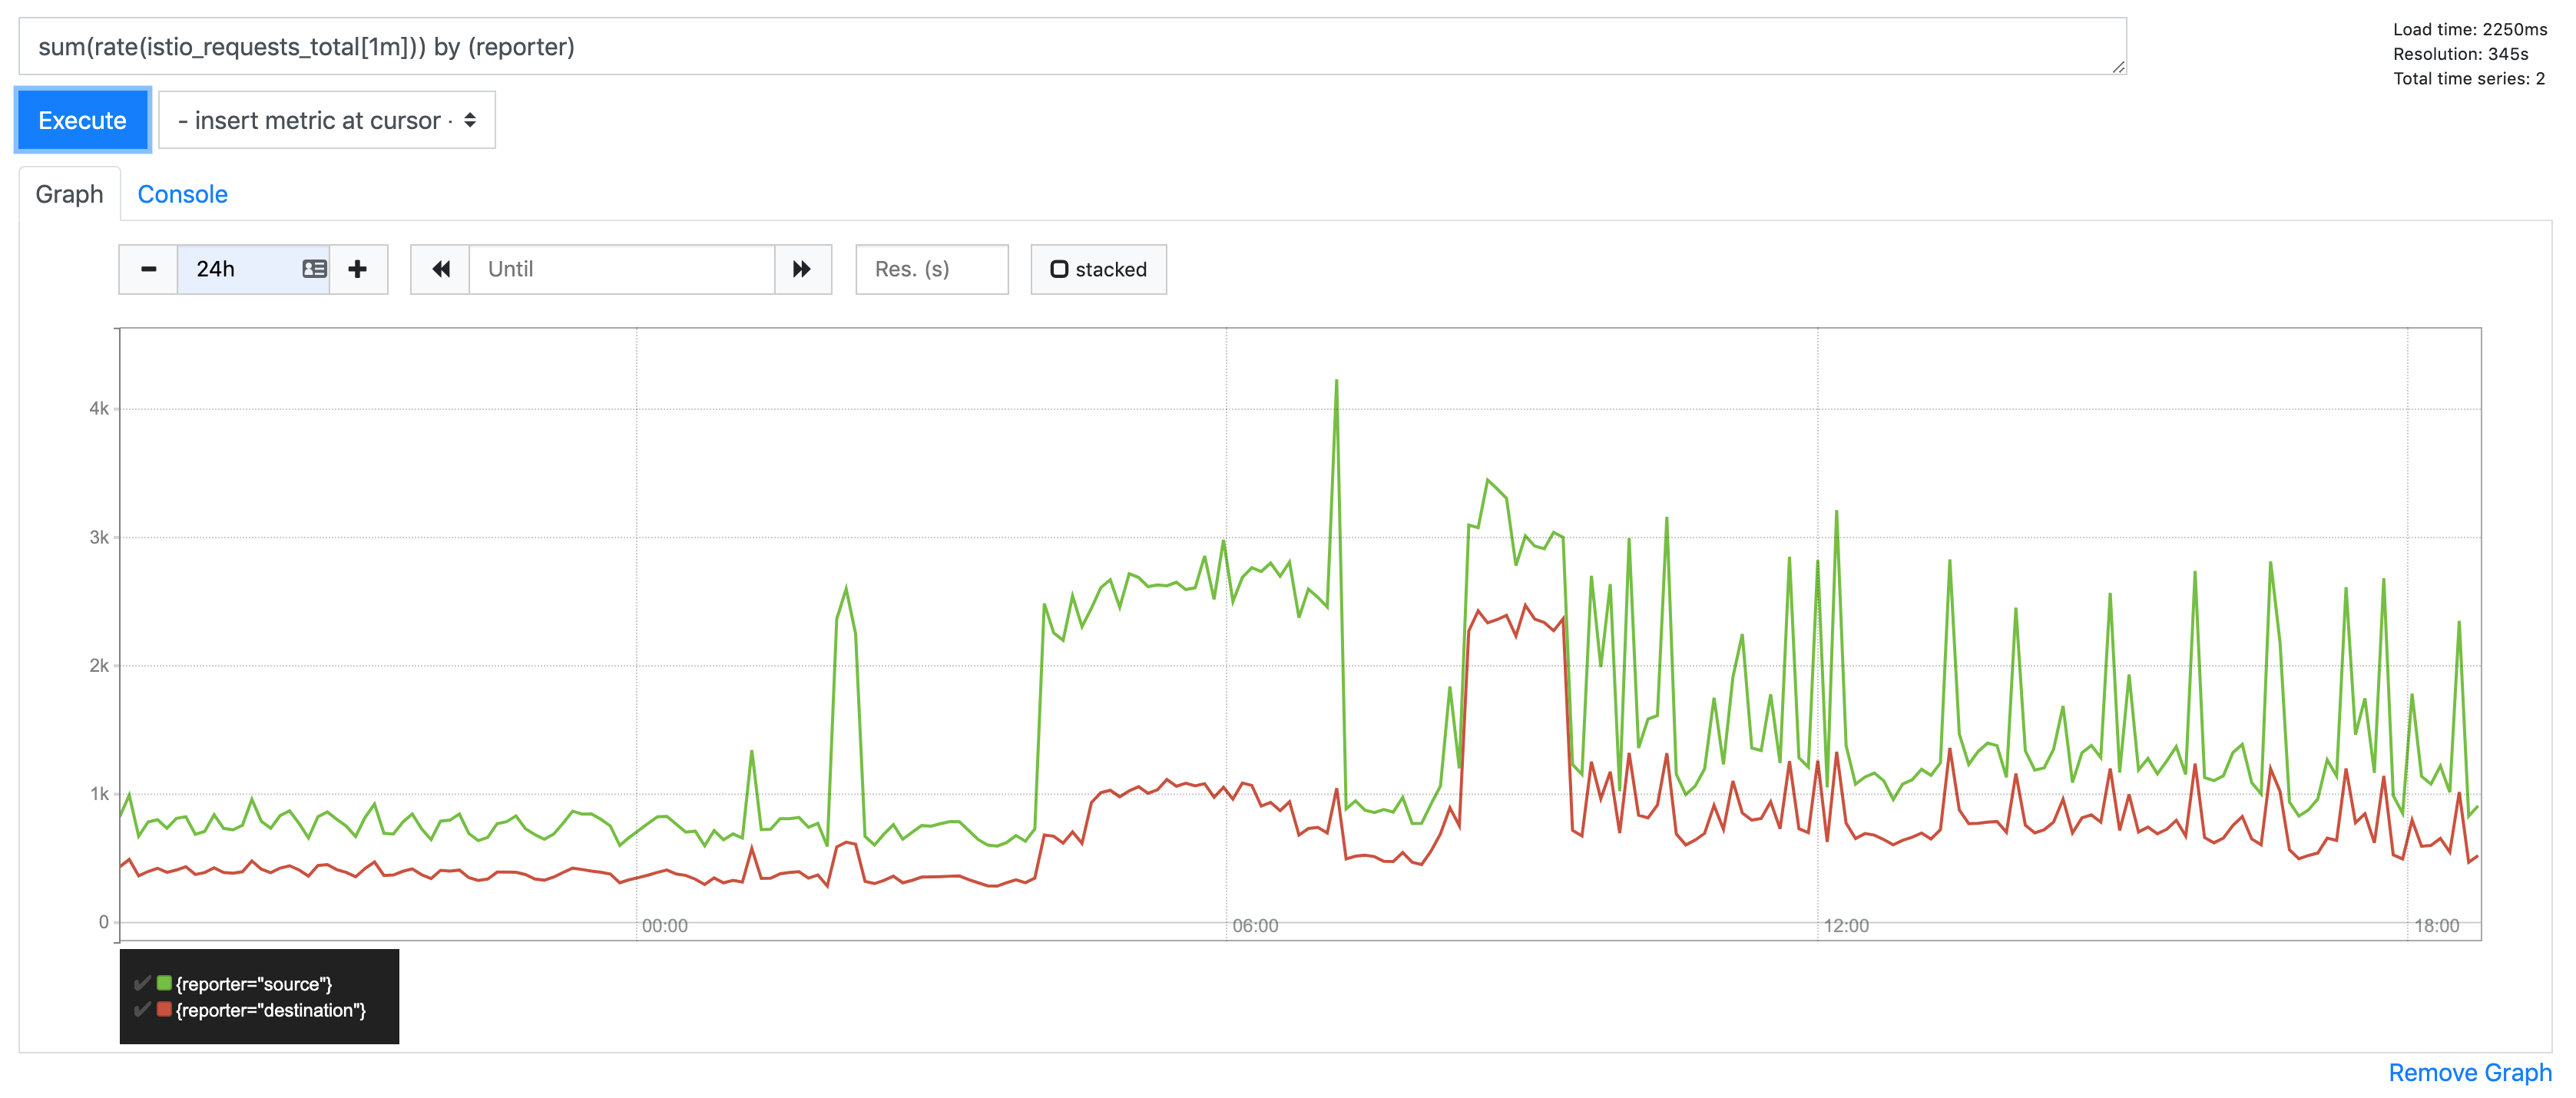
That's a shame. I've had 475 in the last 24 hours (on 112,626,354 requests, across 410 envoys):

It's nothing to do with the application being overloaded (it really isn't), in fact two of our top offenders have very little requests per second (6). I thought we had also demonstrated that the issue is between source envoy and destination envoy, not between destination envoy and destination app?
I don't know if it helps debug at all, but here are some envoy graphs for the two top offenders:
sauron-seo-app:
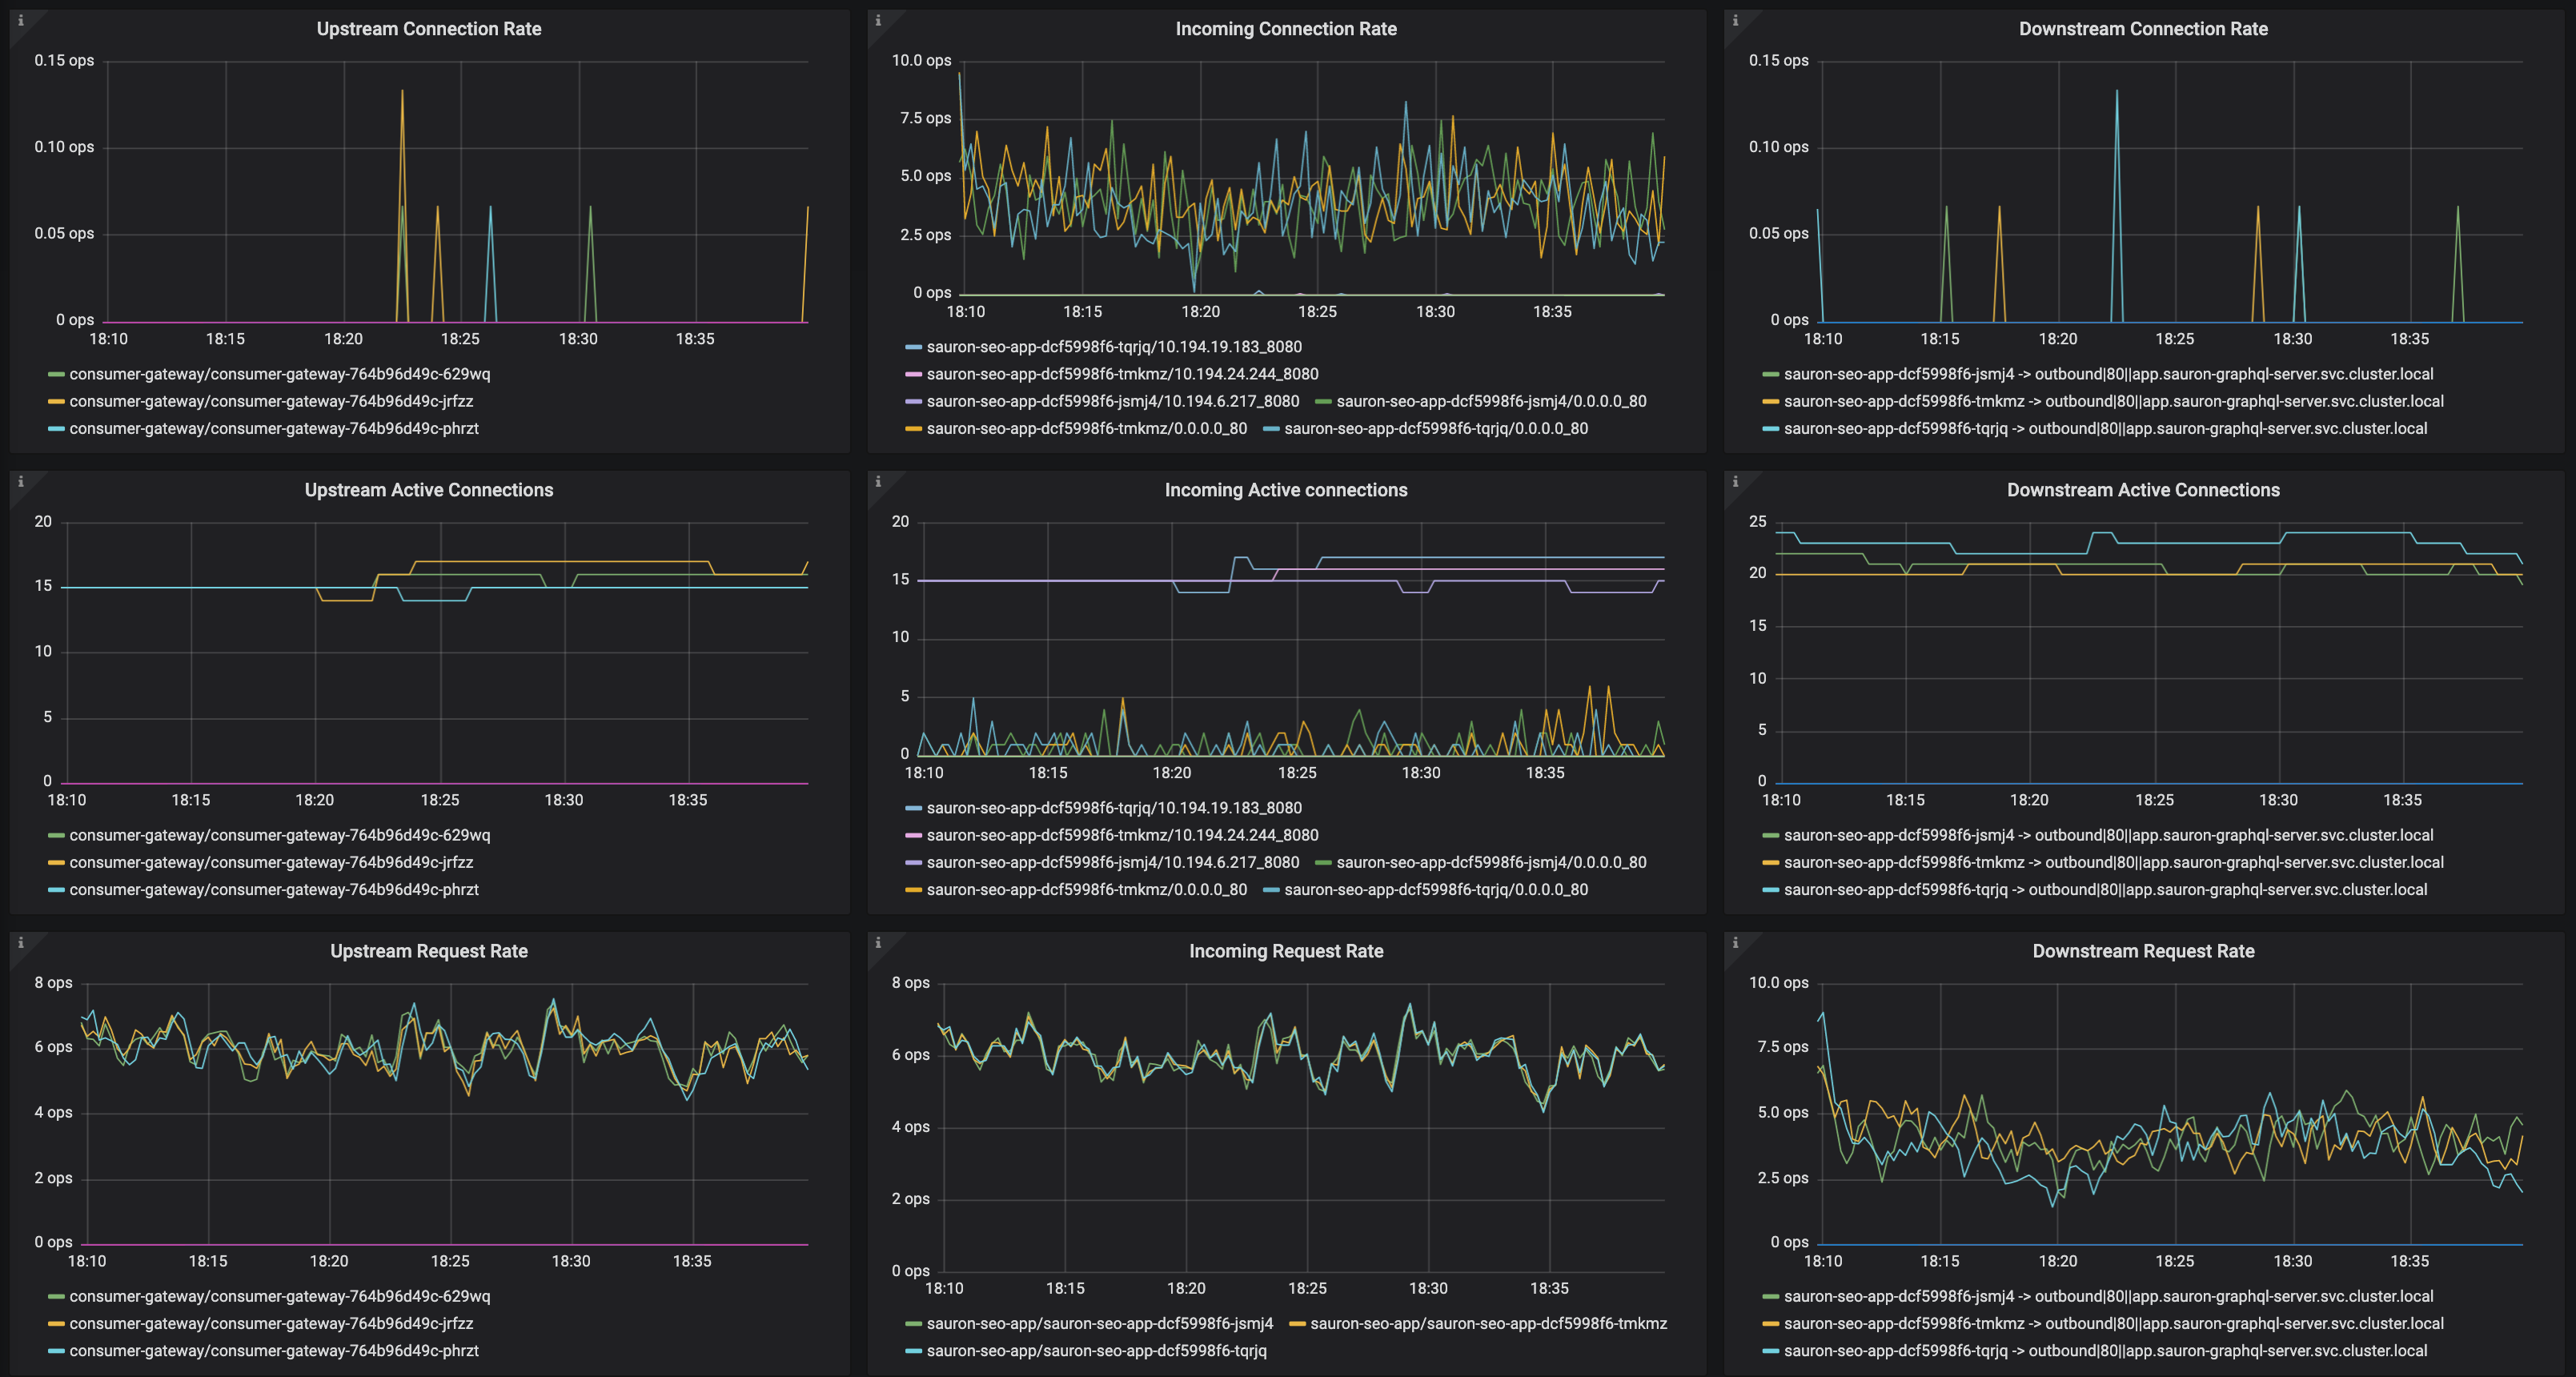
sauron-graphql-server:

And the another app which gets consistently quite a bit more traffic, but has had no UC's (search-one):
They're all running with the same Destinationrule configuration:
  spec:
    host: app
    trafficPolicy:
      connectionPool:
        http:
          http1MaxPendingRequests: 1024
          http2MaxRequests: 10240
          idleTimeout: 30m
        tcp:
          maxConnections: 10240
          tcpKeepalive:
            interval: 30s
            time: 30s
I think the key take away of this issue is that you're not going to be able to replicate the incredibly diverse setup of each of your customers environments, but your customers _are_ going to experience issues.
I think the focus should be around providing tooling, debugging capability, better metrics (cc @douglas-reid), improved logging and so on in order to help diagnose issues.
Stono
on 22 May 2019
@Stono This is a bit hard to digest, but if there are metrics that would help further, i'd love to brainstorm on their generation.
douglas-reid
on 22 May 2019
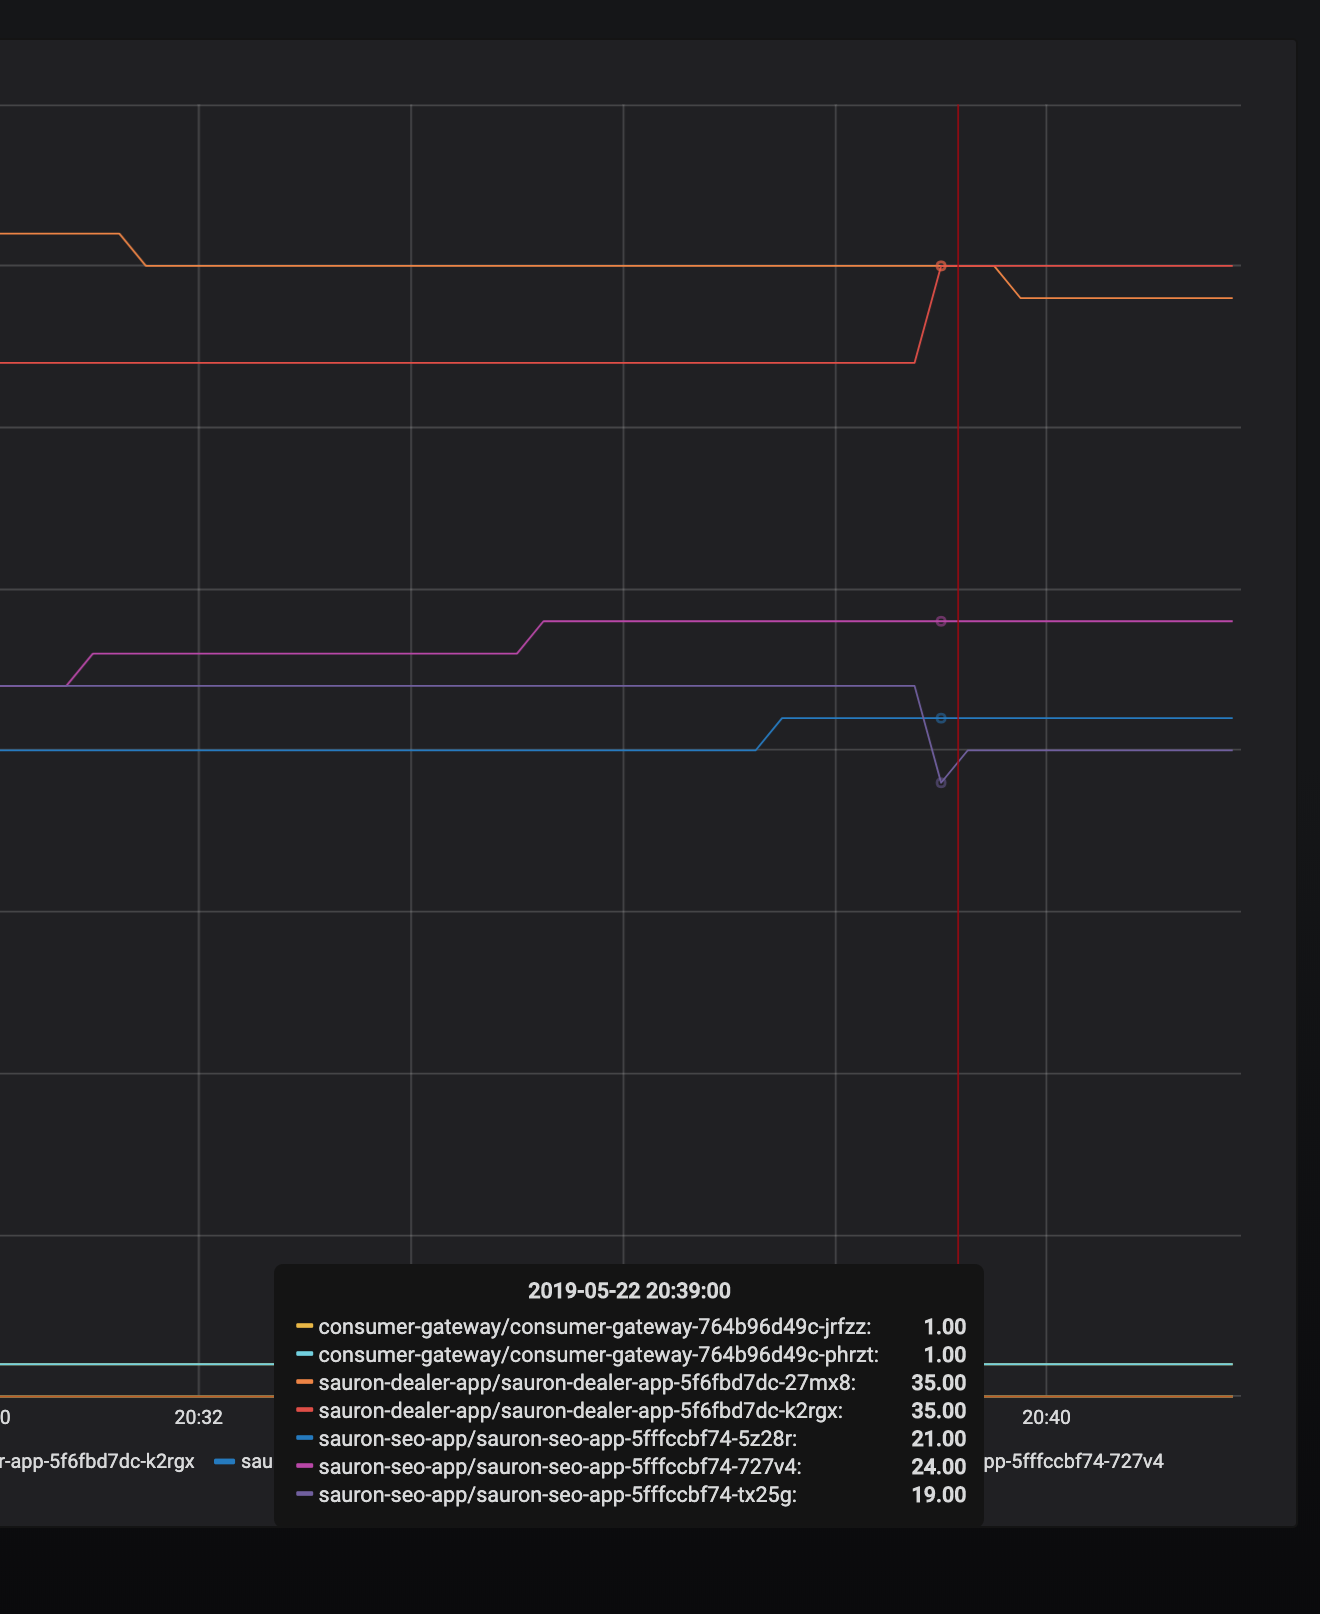
We see more of these as connections ramp up.
Following a deployment, here are the 503s:
And here is the connections TO the envoy in front of sauron-seo-app:
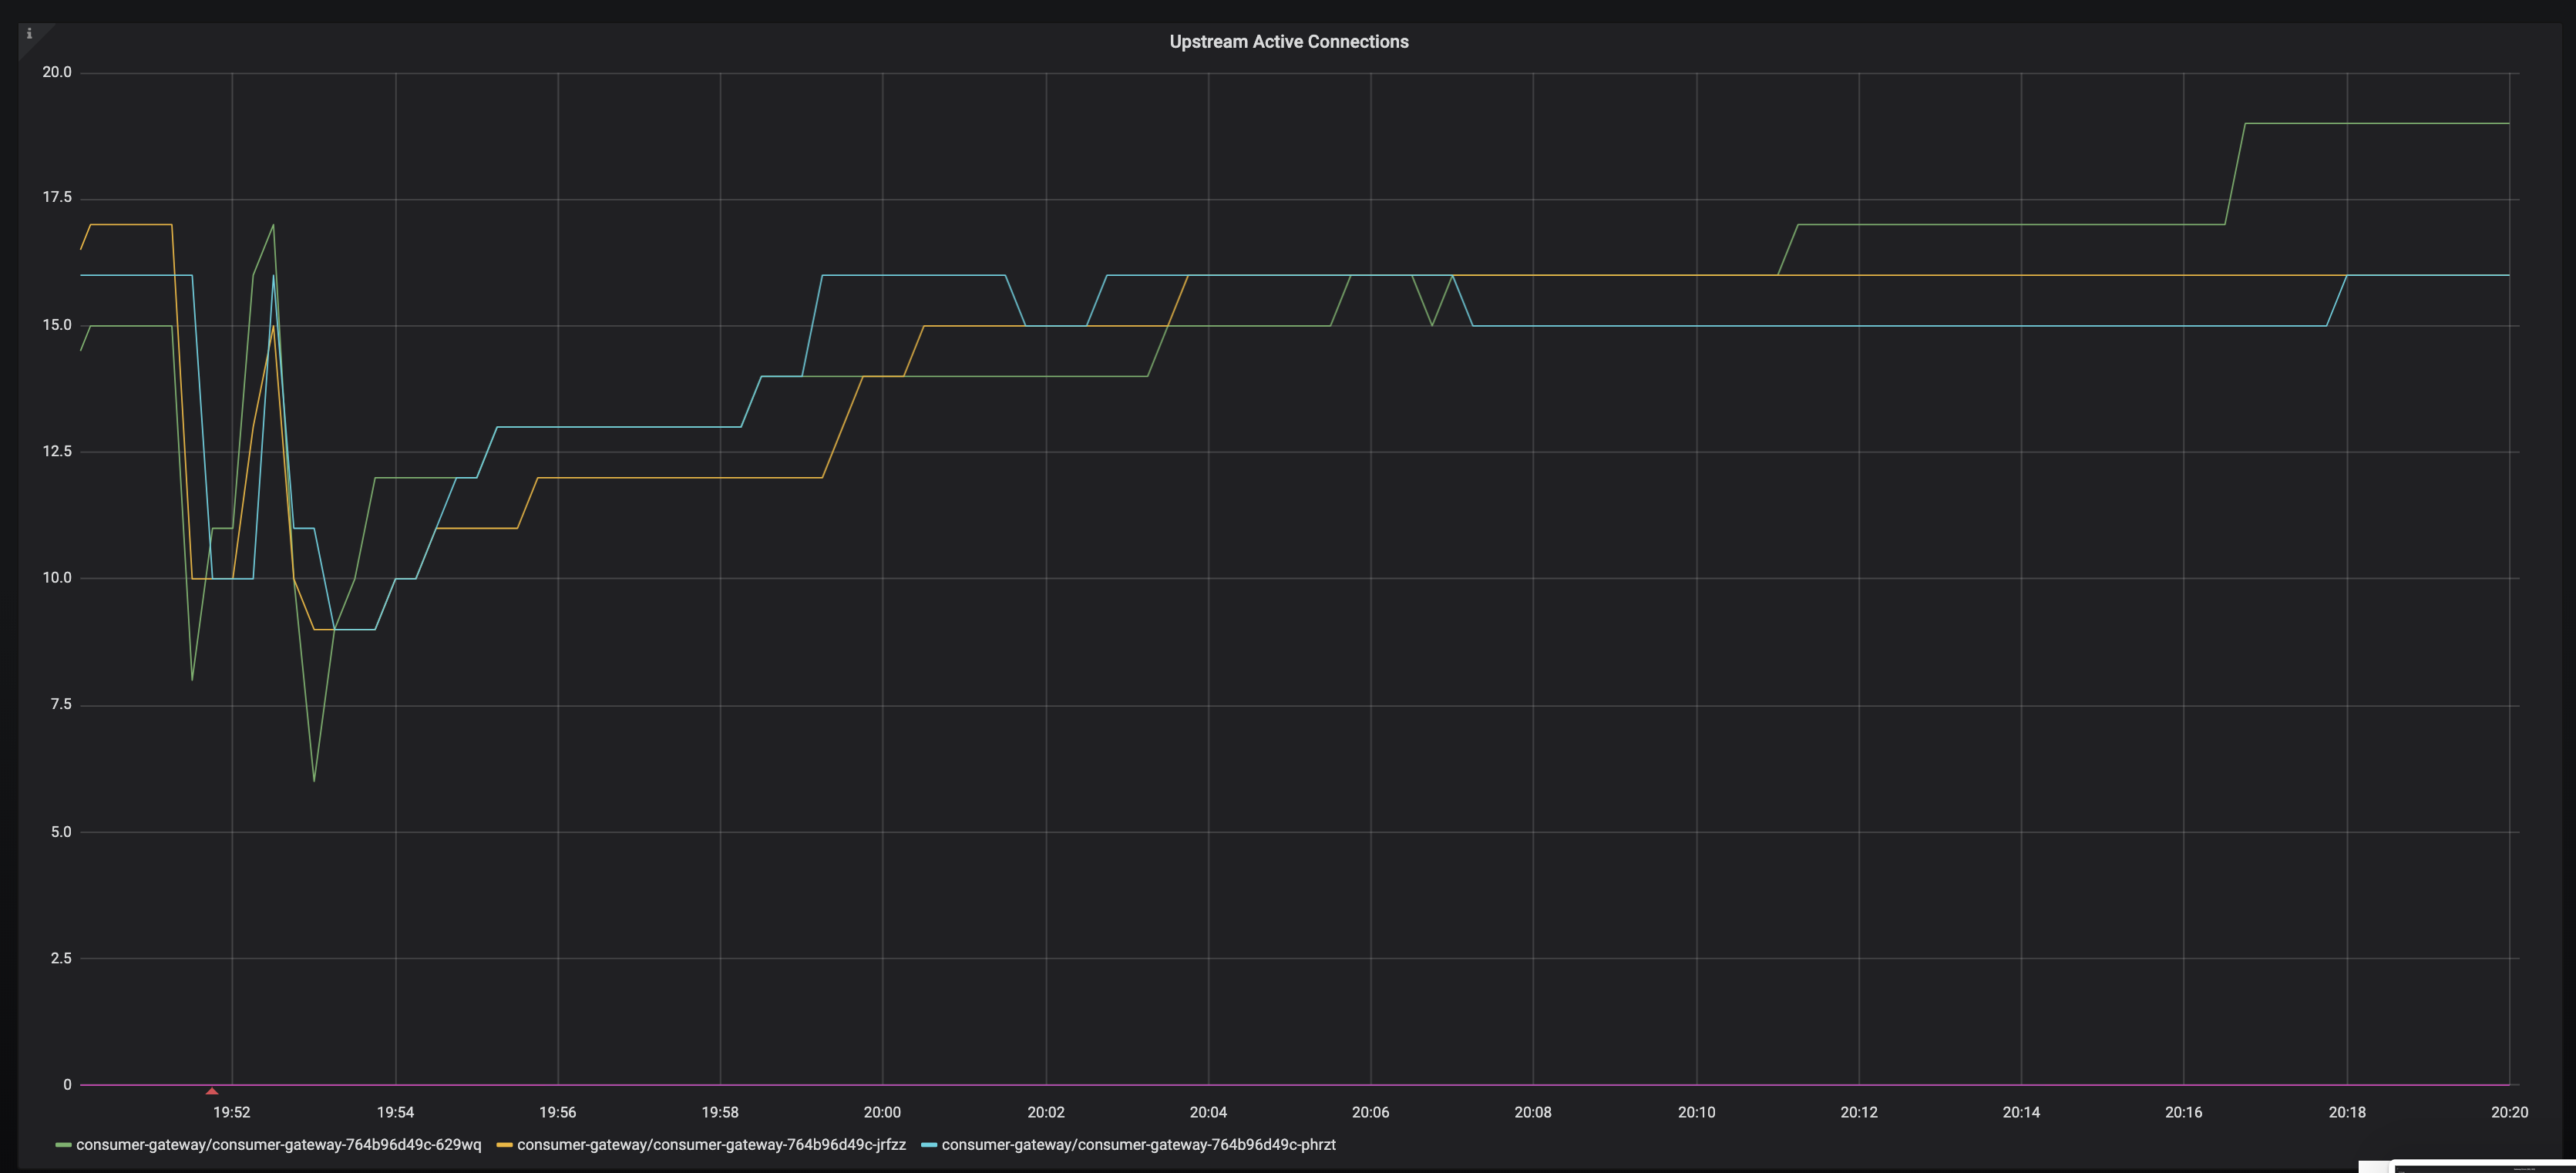
Stono
on 22 May 2019
And again:
Stono
on 22 May 2019
@Stono could you provide logs from all involved peers (i.e. source app, source Envoy, destination Envoy, destination app) for the same 503 UC event (with a few minutes of logs before and after for context)? I'm trying to figure out which connection is terminated first and starts the chain of errors, but it's unclear from the small pieces of logs from different events, and I couldn't find any event with logs from multiple peers.
You're saying that the issue is between sidecars:
I thought we had also demonstrated that the issue is between source envoy and destination envoy, not between destination envoy and destination app?
But in the logs that you provided, the destination Envoy sees an upstream connection (i.e. connection to the destination app) being reset:
[2019-05-06 20:22:57.559][30][debug][router] [external/envoy/source/common/router/router.cc:644] [C17068][S9430344543646919123] upstream reset: reset reason connection termination
Similarly, the tcpdump that @chrismckean captured shows that the destination app resets connection to the destination Envoy, doesn't it?
That suggests that the issue is with the connection to the destination app, and not between sidecars.
 PiotrSikora
on 23 May 2019
PiotrSikora
on 23 May 2019
@PiotrSikora i'm sorry but i'm not spending _another_ whole day grabbing logs.
I've provided ridiculous amounts of information to numerous people on this issue, other issues, via slack etc. I really believe there are multiple issues going on!
Please let's just get on this call later and live debug together. You'll be able to ask questions and we can answer them real time.
The really frustrating thing for me is i'm not able to replicate this in a testing environment, only on a busy cluster. Which I can show you later.
Stono
on 23 May 2019
Hello,
We have the same issue, i read all opened tickets about this. One thing is that we don't use sidecar, we notice some sporadic 503's (mostly from our external monitoring tool). we were using istio 1.0.2 for some time now.
I installed 1.1.7 yesterday and we still have this issue,
logs from istio-ingressgateway:
{"log":"[2019-05-29T11:48:56.105Z] \"GET / HTTP/1.1\" 503 UC \"-\" 0 95 288 - \"10.234.76.0\" \"Go-http-client/1.1\" \"0bede68c-a8a3-4d84-a8e9-1b0ea9f21beb\" \"npm.deez.re\" \"10.234.41.169:4873\" outbound|4873||verdaccio.coreinfra.svc.dev.kubernetes - 10.234.23.18:80 10.234.76.0:54740 -\n","stream":"stdout","time":"2019-05-29T11:49:03.638779538Z"}
logs from the app(verdaccio) at the same time:
{"log":" http \u003c-- 200, user: null(10.234.61.0), req: 'GET /', bytes: 0/1042\n","stream":"stdout","time":"2019-05-29T11:48:53.279570381Z"}
{"log":" http \u003c-- 200, user: null(10.234.23.1 via 10.234.23.0), req: 'HEAD /', bytes: 0/0\n","stream":"stdout","time":"2019-05-29T11:48:53.430792718Z"}
{"log":" http \u003c-- 200, user: null(10.234.61.0), req: 'GET /', bytes: 0/1042\n","stream":"stdout","time":"2019-05-29T11:48:54.297110264Z"}
{"log":" http \u003c-- 200, user: null(10.234.23.0 via 10.234.76.0), req: 'HEAD /', bytes: 0/0\n","stream":"stdout","time":"2019-05-29T11:48:54.448685695Z"}
{"log":" http \u003c-- 200, user: null(10.234.61.0), req: 'GET /', bytes: 0/1042\n","stream":"stdout","time":"2019-05-29T11:48:55.31475736Z"}
{"log":" http \u003c-- 200, user: null(10.234.23.0 via 10.234.76.0), req: 'HEAD /', bytes: 0/0\n","stream":"stdout","time":"2019-05-29T11:48:55.466233909Z"}
{"log":" http \u003c-- 200, user: null(10.234.61.0), req: 'GET /', bytes: 0/1042\n","stream":"stdout","time":"2019-05-29T11:48:56.675295282Z"}
{"log":" http \u003c-- 200, user: null(10.234.23.1 via 10.234.23.0), req: 'HEAD /', bytes: 0/0\n","stream":"stdout","time":"2019-05-29T11:48:56.675736777Z"}
{"log":" http \u003c-- 200, user: null(10.234.41.1), req: 'GET /-/ping', bytes: 0/3\n","stream":"stdout","time":"2019-05-29T11:48:57.38159729Z"}
{"log":" http \u003c-- 200, user: null(10.234.61.0), req: 'GET /', bytes: 0/1042\n","stream":"stdout","time":"2019-05-29T11:48:57.692149781Z"}
{"log":" http \u003c-- 200, user: null(10.234.23.0 via 10.234.76.0), req: 'HEAD /', bytes: 0/0\n","stream":"stdout","time":"2019-05-29T11:48:57.692597648Z"}
{"log":" http \u003c-- 200, user: null(10.234.61.0), req: 'GET /', bytes: 0/1042\n","stream":"stdout","time":"2019-05-29T11:48:58.710610856Z"}
{"log":" http \u003c-- 200, user: null(10.234.23.0 via 10.234.76.0), req: 'HEAD /', bytes: 0/0\n","stream":"stdout","time":"2019-05-29T11:48:58.711203625Z"}
{"log":" http \u003c-- 200, user: null(10.234.76.0 via 10.234.23.0), req: 'GET /', bytes: 0/454\n","stream":"stdout","time":"2019-05-29T11:48:58.841457719Z"}
it happens for others services/apps as well when using istio.
NodePort services (not using the ingress) doesn't have this issue
We ran tests all nights:
curl on pod directly => 200 only
curl on ingress => some 503
Istio was installed with these:
helm template install/kubernetes/helm/istio --name istio --namespace istio-system --set global.proxy.accessLogFile="/dev/stdout" --set global.proxy.clusterDomain=dev.kubernetes --set prometheus.service.nodePort.enabled=true --set sidecarInjectorWebhook.enabled=false --set global.proxy.includeIPRanges=100.64.0.0/16 --set gateways.istio-ingressgateway.type=NodePort --set gateways.istio-ingressgateway.autoscaleMin=2 --set pilot.autoscaleMin=2 --set gateways.istio-ingressgateway.nodeSelector.node-role\\.kubernetes\\.io/master=\"true\" > istio1.1.7.yaml
If you have any questions, i'd like to fix this asap
thanks
 AWKIF
on 29 May 2019
AWKIF
on 29 May 2019
Some more logs in debug:
"log":"[2019-05-29 15:32:47.807][182][debug][upstream] [external/envoy/source/common/upstream/cluster_manager_impl.cc:1129] **no healthy host for HTTP connection pool**\n","stream":"stderr","time":"2019-05-29T15:32:47.807683175Z"}
{"log":"[2019-05-29 15:32:47.807][182][debug][http] [external/envoy/source/common/http/async_client_impl.cc:94] async http request response headers (end_stream=false):\n","stream":"stderr","time":"2019-05-29T15:32:47.807691662Z"}
{"log":"':status', '503'\n","stream":"stderr","time":"2019-05-29T15:32:47.807717111Z"}
{"log":"'content-length', '19'\n","stream":"stderr","time":"2019-05-29T15:32:47.807726288Z"}
{"log":"'content-type', 'text/plain'\n","stream":"stderr","time":"2019-05-29T15:32:47.807732686Z"}
{"log":"\n","stream":"stderr","time":"2019-05-29T15:32:47.807738813Z"}
{"log":"[2019-05-29 15:32:47.807][182][trace][http] [external/envoy/source/common/http/async_client_impl.cc:102] async http request response data (length=19 end_stream=true)\n","stream":"stderr","time":"2019-05-29T15:32:47.80774496Z"}
{"log":"[2019-05-29 15:32:47.854][187][debug][main] [external/envoy/source/server/connection_handler_impl.cc:257] [C941004] new connection\n","stream":"stderr","time":"2019-05-29T15:32:47.854635313Z"}
{"log":"[2019-05-29 15:32:47.854][187][trace][connection] [external/envoy/source/common/network/connection_impl.cc:440] [C941004] socket event: 3\n","stream":"stderr","time":"2019-05-29T15:32:47.854659785Z"}
{"log":"[2019-05-29 15:32:47.854][187][trace][connection] [external/envoy/source/common/network/connection_impl.cc:508] [C941004] write ready\n","stream":"stderr","time":"2019-05-29T15:32:47.854667128Z"}
{"log":"[2019-05-29 15:32:47.854][187][trace][connection] [external/envoy/source/common/network/connection_impl.cc:478] [C941004] read ready\n","stream":"stderr","time":"2019-05-29T15:32:47.854673563Z"}
{"log":"[2019-05-29 15:32:47.854][187][trace][connection] [external/envoy/source/common/network/raw_buffer_socket.cc:23] [C941004] read returns: 177\n","stream":"stderr","time":"2019-05-29T15:32:47.854679934Z"}
{"log":"[2019-05-29 15:32:47.854][187][trace][connection] [external/envoy/source/common/network/raw_buffer_socket.cc:37] **[C941004] read error: Resource temporarily unavailable**\n","stream":"stderr","time":"2019-05-29T15:32:47.854686252Z"}
{"log":"[2019-05-29 15:32:47.854][187][trace][http] [external/envoy/source/common/http/http1/codec_impl.cc:363] [C941004] parsing 177 bytes\n","stream":"stderr","time":"2019-05-29T15:32:47.854692705Z"}
{"log":"[2019-05-29 15:32:47.854][187][trace][http] [external/envoy/source/common/http/http1/codec_impl.cc:476] [C941004] message begin\n","stream":"stderr","time":"2019-05-29T15:32:47.854701344Z"}
{"log":"[2019-05-29 15:32:47.854][187][debug][http] [external/envoy/source/common/http/conn_manager_impl.cc:243] [C941004] new stream\n","stream":"stderr","time":"2019-05-29T15:32:47.854744225Z"}
{"log":"[2019-05-29 15:32:47.854][187][trace][http] [external/envoy/source/common/http/http1/codec_impl.cc:331] [C941004] completed header: key=Host value=rundeck-cac.deez.re\n","stream":"stderr","time":"2019-05-29T15:32:47.854769334Z"}
{"log":"[2019-05-29 15:32:47.854][187][trace][http] [external/envoy/source/common/http/http1/codec_impl.cc:331] [C941004] completed header: key=User-Agent value=Go-http-client/1.1\n","stream":"stderr","time":"2019-05-29T15:32:47.854777073
Z"}
{"log":"[2019-05-29 15:32:47.854][187][trace][http] [external/envoy/source/common/http/http1/codec_impl.cc:331] [C941004] completed header: key=Referer value=http://rundeck-cac.deez.re/user/login\n","stream":"stderr","time":"2019-05-29T15
:32:47.854783338Z"}
{"log":"[2019-05-29 15:32:47.854][187][trace][http] [external/envoy/source/common/http/http1/codec_impl.cc:331] [C941004] completed header: key=Accept-Encoding value=gzip\n","stream":"stderr","time":"2019-05-29T15:32:47.854789387Z"}
{"log":"[2019-05-29 15:32:47.854][187][trace][http] [external/envoy/source/common/http/http1/codec_impl.cc:442] [C941004] headers complete\n","stream":"stderr","time":"2019-05-29T15:32:47.854795349Z"}
{"log":"[2019-05-29 15:32:47.854][187][trace][http] [external/envoy/source/common/http/http1/codec_impl.cc:331] [C941004] completed header: key=Connection value=close\n","stream":"stderr","time":"2019-05-29T15:32:47.854801091Z"}
{"log":"[2019-05-29 15:32:47.854][187][trace][http] [external/envoy/source/common/http/http1/codec_impl.cc:463] [C941004] message complete\n","stream":"stderr","time":"2019-05-29T15:32:47.854806925Z"}
{"log":"[2019-05-29 15:32:47.854][187][debug][http] [external/envoy/source/common/http/conn_manager_impl.cc:580] [C941004][S14732545832523136882] request headers complete (end_stream=true):\n","stream":"stderr","time":"2019-05-29T15:32:47
.854824358Z"}
{"log":"':authority', 'rundeck-cac.deez.re'\n","stream":"stderr","time":"2019-05-29T15:32:47.854834945Z"}
{"log":"':path', '/user/login'\n","stream":"stderr","time":"2019-05-29T15:32:47.854841069Z"}
{"log":"':method', 'GET'\n","stream":"stderr","time":"2019-05-29T15:32:47.85484644Z"}
{"log":"'user-agent', 'Go-http-client/1.1'\n","stream":"stderr","time":"2019-05-29T15:32:47.854851924Z"}
{"log":"'referer', 'http://rundeck-cac.deez.re/user/login'\n","stream":"stderr","time":"2019-05-29T15:32:47.854857273Z"}
{"log":"'accept-encoding', 'gzip'\n","stream":"stderr","time":"2019-05-29T15:32:47.854862577Z"}
{"log":"'connection', 'close'\n","stream":"stderr","time":"2019-05-29T15:32:47.854867935Z"}
{"log":"\n","stream":"stderr","time":"2019-05-29T15:32:47.854873194Z"}
{"log":"[2019-05-29 15:32:47.854][187][debug][http] [external/envoy/source/common/http/conn_manager_impl.cc:1040] [C941004][S14732545832523136882] request end stream\n","stream":"stderr","time":"2019-05-29T15:32:47.854878415Z"}
Also noting this few lines after:
{"log":"[2019-05-29 15:32:47.855][187][debug][pool] [external/envoy/source/common/http/conn_pool_base.cc:20] queueing request due to no available connections\n","stream":"stderr","time":"2019-05-29T15:32:47.855184357Z"}
AWKIF
on 29 May 2019
https://github.com/istio/envoy/pull/73 fixes the known issue. PR in testing.
tl;dr envoy could use the half close connection talking to upstream and respond 503 to downstream
lambdai
on 30 May 2019
Along with silentdai's PR, we also discovered that applications which have a low socket timeout value will terminate connections to envoy more frequently, exacerbating the issue. I've written about it here: https://karlstoney.com/2019/05/31/istio-503s-ucs-and-tcp-fun-times
The TLDR; here is that @silentdai's update (hopefully in 1.1.8) combined with an awareness and adjustment of applications with low tcp socket timeouts resolves 99.99% of our 503's.
I'm going to close this issue now as it's become a bit of a novel, I'm thankful to the whole Istio team for their efforts helping get to the bottom of this one and I know there are more improvements to come from them which should make this less of a problem.
Stono
on 1 Jun 2019
I have come through both "timeout" and "upstream disconnect/reset" errors, which compose about 2% of all requests. I have no idea if we are going into the same problem. What's annoying, the "timeout" requests could be referred from the log of envoy while the "upstream disconnect" could not.
 alpaca2333
on 25 Jun 2019
alpaca2333
on 25 Jun 2019
Do you have node.js application behind envoy?
Node.js has 5 sec default connection idleTimeout, and envoy has the same one.
In rare time it generate this error - envoy send reqest in the moment when nodejs closing it.
We have resolve this with DestinationRule:
apiVersion: networking.istio.io/v1alpha3
kind: DestinationRule
metadata:
  name: qqq-destination-rule
spec:
  host: qqq.aaa.svc.cluster.local
  trafficPolicy:
    connectionPool:
      http:
        idleTimeout: 3s
        maxRetries: 3
 turbotankist
on 12 Dec 2019
turbotankist
on 12 Dec 2019
Thanks for all the info @Stono; You mentioned 1.1.8 will (hopefully) have the fix for the UC 503s, I wondered if you have a link to that PR as I'm interested in the solution?
The reason I ask is because we originally solved the issue by turning on envoy retries with x-envoy-max-retries: 10; x-envoy-retry-on: gateway-error,connect-failure,refused-stream which worked fine.
However, we've since had a few incidents in production whereby a third party service times out and we end up creating massive cascading request chains in production (our Nodejs app also performs retries to third parties which compounds the issue 🤦♂).
We therefore have no choice but to disable envoy retries but before we do this I wanted to check whether the 1.1.8 fix solved the underlying issue or if we should expect to see the UC 503s again?
 richardscarrott
on 13 Mar 2020
richardscarrott
on 13 Mar 2020
Node.js has 5 sec default connection idleTimeout, and envoy has the same one.
@turbotankist which version of istio are you using? The default idle timeout in Destination Rule is 1 hour after 1.4.
 yan-dblinf
on 3 Sep 2020
yan-dblinf
on 3 Sep 2020
Related issues
Stono
·
92Comments
 yacut
·
73Comments
yacut
·
73Comments
 oaktowner
·
73Comments
Stono
·
65Comments
oaktowner
·
73Comments
Stono
·
65Comments
 hzxuzhonghu
·
96Comments
hzxuzhonghu
·
96Comments
Most helpful comment
Along with silentdai's PR, we also discovered that applications which have a low socket timeout value will terminate connections to envoy more frequently, exacerbating the issue. I've written about it here: https://karlstoney.com/2019/05/31/istio-503s-ucs-and-tcp-fun-times
The TLDR; here is that @silentdai's update (hopefully in 1.1.8) combined with an awareness and adjustment of applications with low tcp socket timeouts resolves 99.99% of our 503's.
I'm going to close this issue now as it's become a bit of a novel, I'm thankful to the whole Istio team for their efforts helping get to the bottom of this one and I know there are more improvements to come from them which should make this less of a problem.