Istio: Regression: Istio 1.1 sidecar cpu peaks periodically far beyond 1.0.x (PILOT_DISABLE_XDS_MARSHALING_TO_ANY)
Describe the bug
tl;dr:
Upgrading from Istio 1.0.4 to 1.1.0 requires more resources than feasible, and is not stable enough for production usage.
Background
We’re running the Istio control plane in one of our production clusters. This cluster contains applications that are not production critical and are generally safe to experiment on.
We deployed two new services in this cluster: irs-client and irs-server. IRS is our Istio Resiliency Simulator, which is basically a framework for creating arbitrary workloads and configuring them dynamically. irs-{client,server} are just instances of the irs-worker, which are configured to talk to each other over the mesh.
There are 3 server replicas, and 3 client replicas sending 50 RPS of traffic each.
We’ve been running this setup successfully with Istio 1.0.4 and are attempting to move to 1.1.x to take advantage of new multi-cluster features.
Methodology
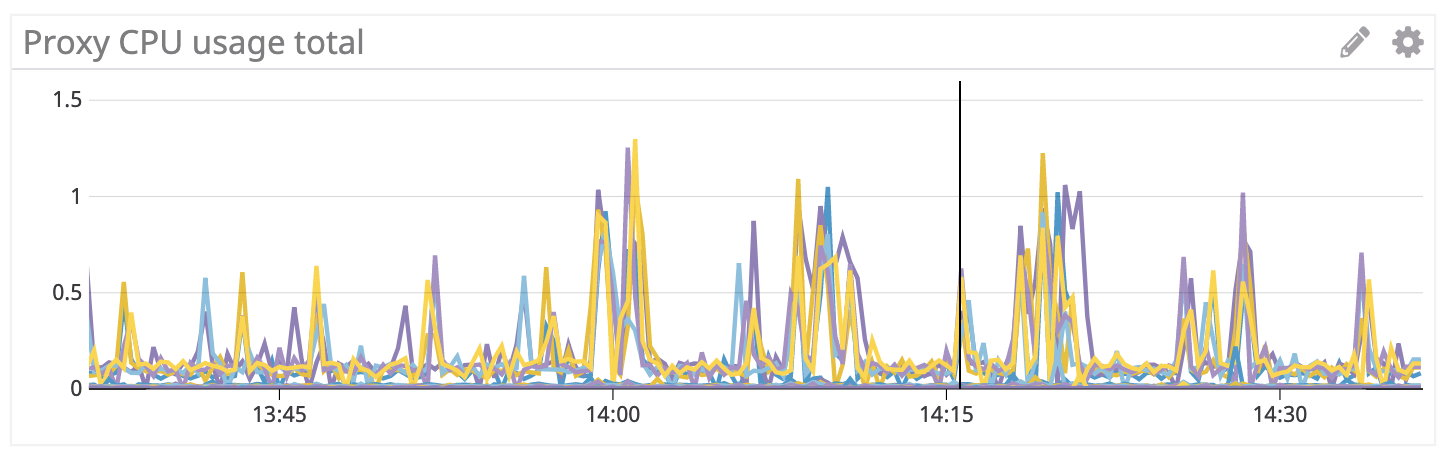
We recently upgraded the istio control plane and proxies on one of our clusters from 1.0.4 to 1.1.0-rc.0. We noticed an drastic change in the usage of CPU on the sidecar proxies.
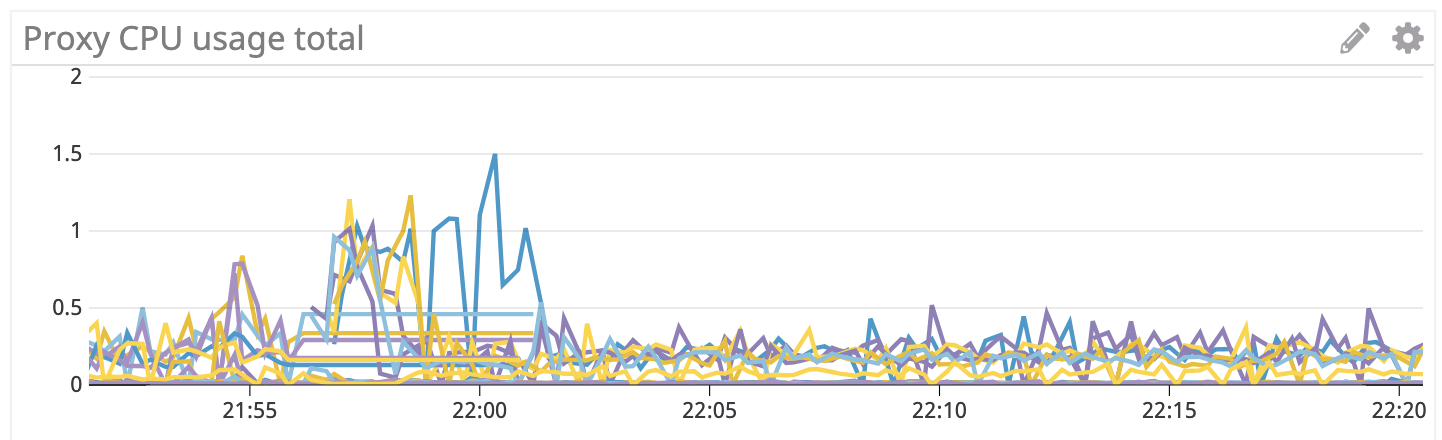
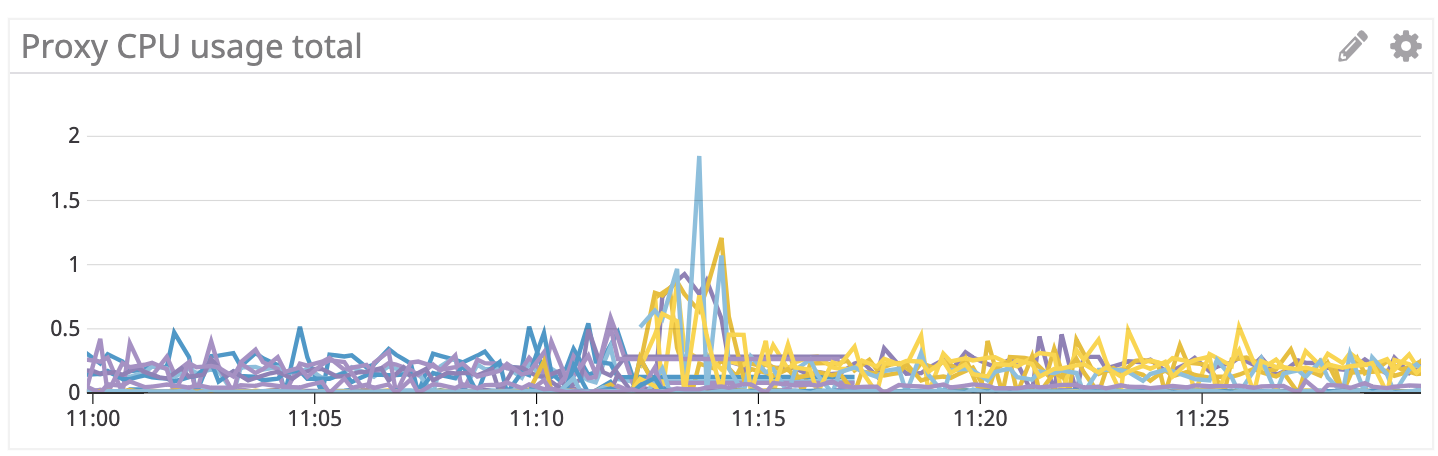
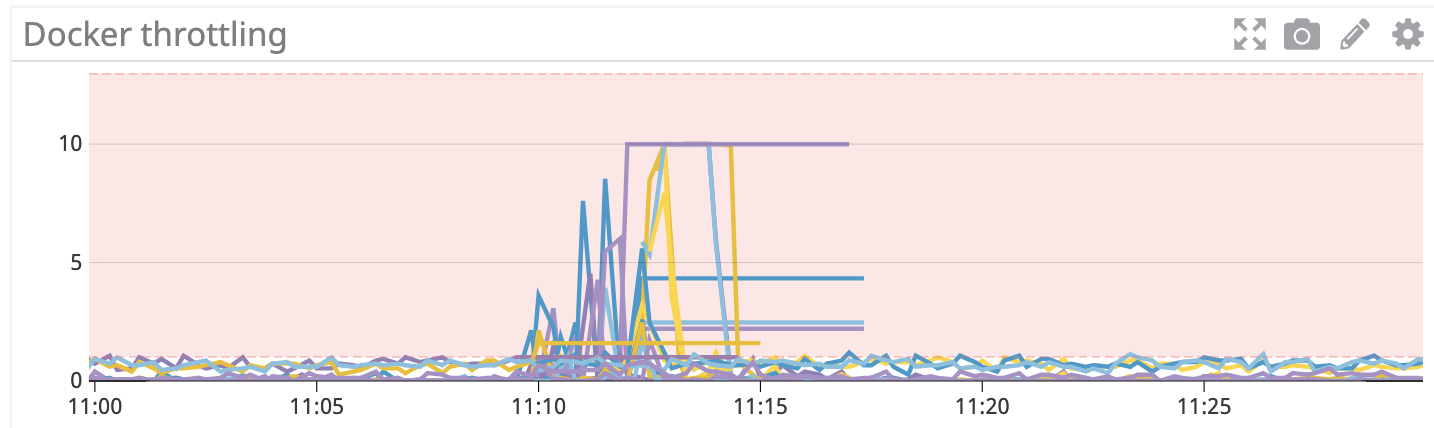
Steady state usage is around 250 mcores on both versions, but on 1.1.0-rc.0, we observed spikes in the CPU usage up to ~6 cores every 5-10 minutes. This caused cpu throttling and the mesh started serving 503s.
Both versions were using 1.1.0-rc.0 for the control plane components. We also tried 1.1.0-snapshot.6 with the same results.
Over the course of the day we increased the cpu requests and limits on the sidecar, and each time the sidecar used more and more.
We intend on rolling this out to 100% of the pods on this cluster, which makes these cpu requirements a deal breaker.
Cluster details
Nodes: 33
Pods: 845
Services: 1426
Namespaces: 61
VirtualServices: 4
ServiceEntries: 1
Pods on the mesh: 6 (therefore 6 sidecar proxies)
Mesh traffic: 300 qps
Also observed the same cpu spikes on another cluster:
Nodes: 18
Pods: 459
Services: 76
Namespaces: 48
VirtualServices: 3
ServiceEntries: 1
Pods on the mesh: 6
Mesh traffic: 300 qps
Version
1.0.6 to 1.1.0
Installation
{{ Please describe how Istio was installed }}
Environment
{{ Which environment, cloud vendor, OS, etc are you using? }}
Cluster state
{{ If you're running on Kubernetes, consider following the
instructions
to generate "istio-dump.tar.gz", then attach it here by dragging and dropping
the file onto this issue. }}
 oaktowner
All 73 comments
I heard from @costinm that they tried 1.1 control plane with 1.0 proxy and the regression went away. Next experiment: try 1.0 control plane with 1.1 proxy.
 duderino
on 28 Feb 2019
duderino
on 28 Feb 2019
Please ask them to set the proxy concurrency to 1. the issues should go away mostly.. I think the cpu resource to proxy concurrency conversion logic that @hzxuzhonghu and co added needs work..
 rshriram
on 28 Feb 2019
rshriram
on 28 Feb 2019
Why do concurrency cause periodic spikes?
 mandarjog
on 28 Feb 2019
mandarjog
on 28 Feb 2019
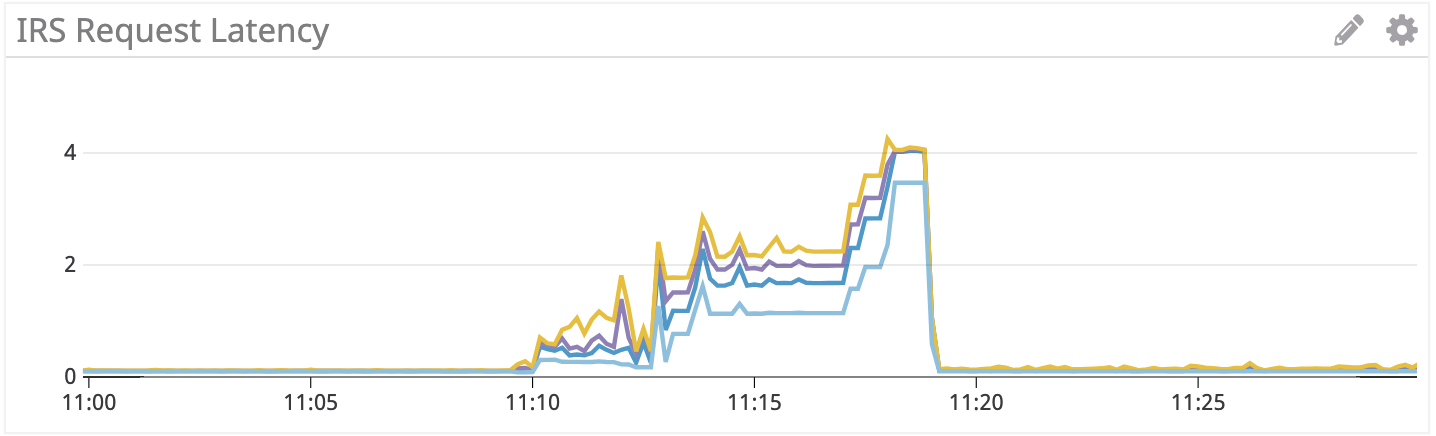
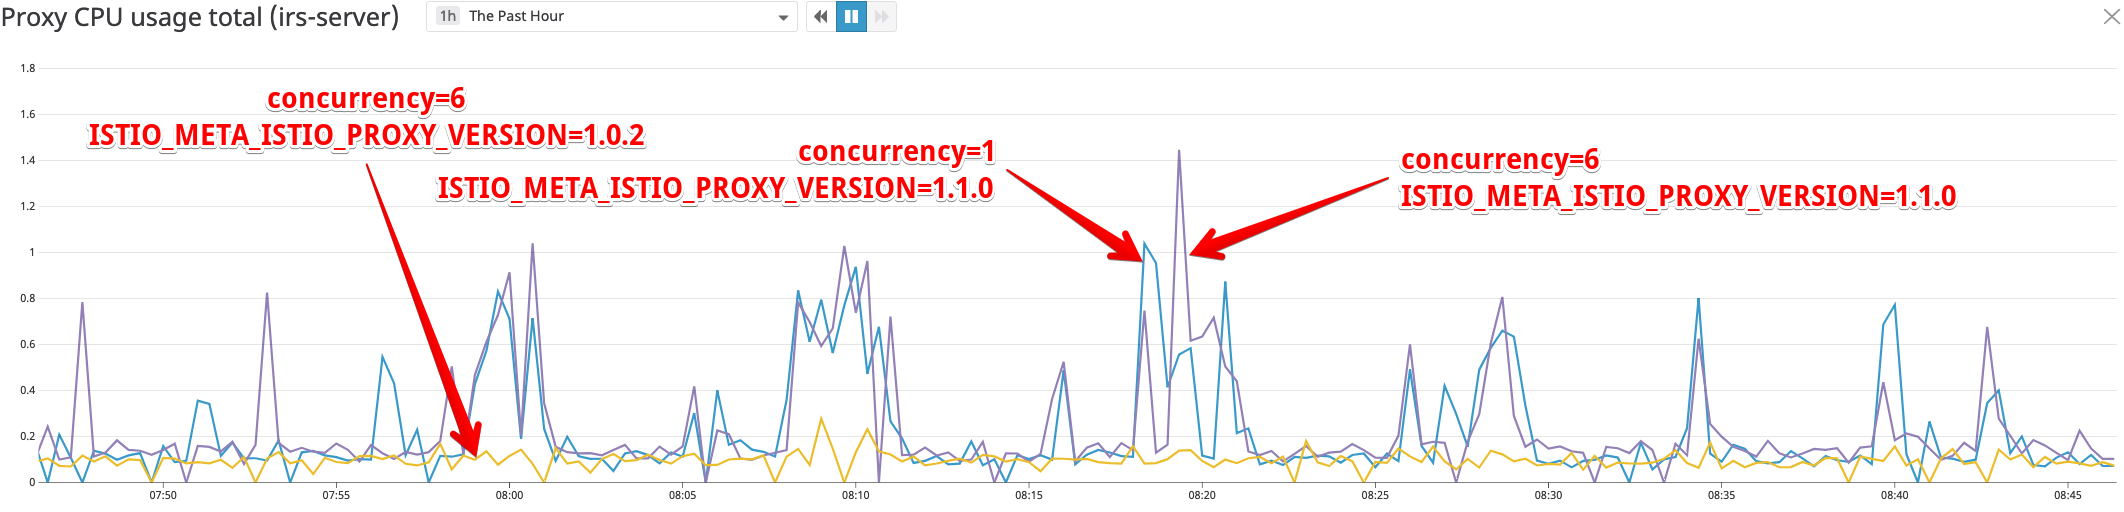
Latest update: We set ISTIO_META_ISTIO_PROXY_VERSION to 1.0.2 on Costin Manolache's advice, and the spikes went away and steady state CPU usage reverted to a normal level.
We still don't fully understand what this did, but this is no longer a blocker.
Doc is here: https://docs.google.com/document/d/1QCgnSDFto3S_UGKyU4OqOgeX35CS7VCIPdb_ewlYyOA/edit
cc: @oaktowner, @dwradcliffe, @jpittis
 michaelkipper
on 28 Feb 2019
michaelkipper
on 28 Feb 2019
@rshriram: Of the two options (set proxy concurrency to 1, set
ISTIO_META_ISTIO_PROXY_VERSION to an old version number), which one is more preferable?
michaelkipper
on 28 Feb 2019
hold on.. you set the istio_meta thing on a proxyv2 image from 1.1-rc0 and the CPU usage went down? if so, the concurrency is unlikely to make any difference.
But in terms of the concurrency, without changing the istio meta variable (i.e. let it be set to 1.1), there is a meshConfig variable in helm charts..
rshriram
on 28 Feb 2019
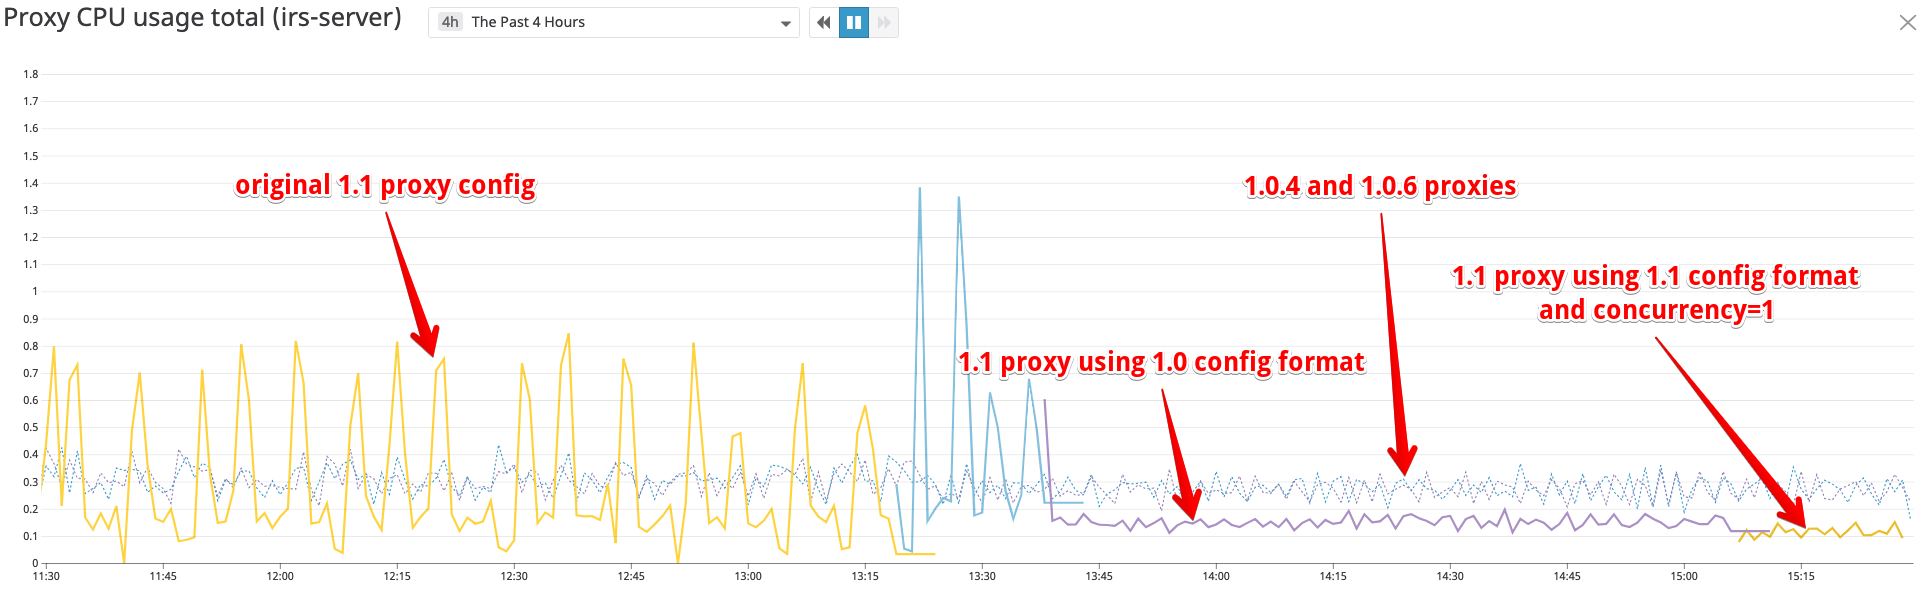
I tried without the ISTIO_META_ISTIO_PROXY_VERSION change (so using 1.1 format) and --concurrency=1 and this seems to have (also) solved the cpu spikes.
 dwradcliffe
on 28 Feb 2019
dwradcliffe
on 28 Feb 2019
Oh nice, Can you set concurrency higher to say 4 and see if those spikes are better or worse? What is the configured cpu limit for proxy?
mandarjog
on 28 Feb 2019
So we try to auto infer the concurrency (number of threads for envoy) based on the CPU resource in a pod. There is a logic somewhere in the kube inject code that does this translation (@hzxuzhonghu and co did this).. I think that logic is buggy to the extent that in your system, it ended up setting concurrency to a very high value (possibly more than num cores in your system). And when this happened, you increased the mcores and it added oil to fire, consuming more CPUs :)..
Now, what is perplexing is how did setting ISTIO_META to 1.0 bring the CPU usage down.. this seems to indicate that the common denominator in both cases is some config in Envoy that pilot is sending.. this config is potentially consuming too much CPU unless restrained by the concurrency parameter..
@mandarjog , I believe we should set the default concurrency to 1 in our helm charts for all users. Folks who want to customize it can do so, but 1 should be a very decent setting for all sidecars (afterall they are running as a process on a pod with other processes).. OTOH, for gateways, we should set the concurrency to 2 or more by default..
rshriram
on 28 Feb 2019
Can you set concurrency higher to say 4 and see if those spikes are better or worse? What is the configured cpu limit for proxy?
With 800m resuests and limits, --concurrency=2 seems fine, but --concurrency=4 had a spike.
dwradcliffe
on 28 Feb 2019
Very interesting debugging guys. Thank you.
@rshriram we want to do something close to what you suggest. @mandarjog has done a ton of perf qualification already, but it was done with concurrency=2. That's why we didn't catch this. We actually overrode the defaults. Proposal is to set to concurrency=2 for the 1.1 release since we have the most experience with it and keep this bug alive to do a more exhaustive analysis for 1.1.x
duderino
on 28 Feb 2019
@dwradcliffe thanks for confirming concurrency 2 is OK!
duderino
on 28 Feb 2019
Also, for 1.1.x. I think we should consider reverting https://github.com/istio/istio/pull/11311 in favor of https://github.com/istio/istio/issues/8938
@knrc and @rvansa put a lot of work and analysis into https://github.com/istio/istio/issues/8938 but we abandoned it in favor of the redundant https://github.com/istio/istio/pull/11311 because it was merged first. Sometimes the fastest isn't the best.
duderino
on 28 Feb 2019
I'll drop this to P1 as soon as @mandarjog's concurrency=2 PR is merged into release-1.1 branch
duderino
on 28 Feb 2019
We're in a much better state now (thanks @rshriram for the tip!), and I'll probably continue with concurrency=1 for now, but I'm still concerned with the config format difference. _Something_ is going on there.
dwradcliffe
on 28 Feb 2019
Thanks @dwradcliffe
The following information will be super useful to actually fix the problem.
- How many CPUs are available on your Node
- Unset concurrency, like your original configuration.
What is the automatic effective concurrency with req/limits 800m/800m in your environment ?
kubectl --namespace $NS exec -i -t $POD -c istio-proxy -- ps auxww
and
kubectl --namespace $NS exec -i -t $POD -c istio-proxy -- curl http://localhost:15000/stats | grep concurrency
mandarjog
on 28 Feb 2019
How many CPUs are available on your Node
This was on a 32 core node (31850m allocatable)
What is the automatic effective concurrency with req/limits 800m/800m in your environment
server.concurrency: 32
For this test I did _not_ set --concurrency in our injector, so it must be defaulting to 0 and therefore the number of cores on the node.
dwradcliffe
on 28 Feb 2019
ok Thanks.
@rshriram @duderino The Customer is not using the istio sidecar injector. I checked with some more tests of the injector auto-concurrency code, and it is fine.
They were running with unset concurrency, ie NCPU. defaulting to 2 would work just fine.
mandarjog
on 1 Mar 2019
I donot think this is related to concurrency set, previously if we donot set this value, it is default to the cpu core number of vm.
 hzxuzhonghu
on 1 Mar 2019
hzxuzhonghu
on 1 Mar 2019
@dwradcliffe and co, there is definitely something going on with the envoy config/envoy itself.. setting proxy version to 1.0.x shouldn't magically drop CPU usage. Would you be able to get some CPU profile from the envoy in question, as someone suggested in the docs? https://gist.github.com/silentdai/d00d0cf49e1bf84b723bb0b5214a5b31#file-gistfile1-txt-L3
It would also help if you could get the stat dump from the envoy in question..
Meanwhile, @lizan / @PiotrSikora anything jumps up in this regard? All our 1.0 proxies ran without any concurrency setting IIRC and this level of CPU spikes was not present. Given that the op was able to get a newer envoy to perform the same with the older config, I believe something new in envoy is causing these CPU spikes.. thoughts?
rshriram
on 1 Mar 2019
@dwradcliffe Have you tested 1.1 just with concurrency = 0?
hzxuzhonghu
on 1 Mar 2019
So i dont think this is concurrency. Concurrency merely exacerbates the issue.
@dwradcliffe / @michaelkipper could you run the experiment with all the usual stuff (proxyv2 from 1.1.0-rc0, no special istio_meta blah, no concurrency settings, etc.). but replace the pilot image with this image docker.io/rshriram/pilot:1.1.0-rc1-structonly ?
rshriram
on 1 Mar 2019
Have you tested 1.1 just with concurrency = 0?
I'm assuming this is the same as not passing any concurrency param to the istio-proxy container, so yes. This is what results in server.concurrency: 32
I'll try your test image now. (I can also try to get profile later tomorrow.)
dwradcliffe
on 1 Mar 2019
The main place where isV11 is used protobuf.any change.
Is there any deeper way that pilot changes behavior based on proxy version?
@rshriram
mandarjog
on 1 Mar 2019
No.. the image above effectively undoes the protobuf.any change. lets see how the tests turn out
rshriram
on 1 Mar 2019
I deployed the new pilot and restarted all my workloads to give it a clean start. The first 10 minutes of this were pretty brutal. At 800m cpu limit on the proxy there is so much cpu throttling that it took 6 minutes to stabilize and even able to get full traffic throughput. All the proxies and pilot had massive cpu spikes/throttling. Latency was crazy high too. However after about 10 minutes everything calmed down and looks stable and smooth now. I'm not seeing the periodic spikes. Overall cpu usage is higher than with concurrency=1 or 1.0 format.
dwradcliffe
on 1 Mar 2019
This ran stable overnight, no spikes or errors. Proxy cpu held steady around 300 mcores. This morning I restarted a single server pod, a single client pod, and then all the clients and server pods. This went relatively smoothly. The proxies still take a couple minutes to start up, which might be a different issue. This definitely appears to be much better than the upstream rc1 pilot.
What else can I do to help narrow this down? CPU profile?
dwradcliffe
on 1 Mar 2019
I realized I missed a couple of spots that need to be disabled. Would you be able to try out with this:
docker.io/rshriram/pilot:1.1-rc0-structonly-2 ? 🤞 that this cuts down the initial spikes you saw
rshriram
on 1 Mar 2019
https://github.com/istio/istio/pull/12182 is the code base from which this docker image is built
rshriram
on 1 Mar 2019
The setup where this ran, how many services in total (not ones with sidecars, but how many total services), and any disclosable info about the virtual service, protocols used by these services (redis?/mongo?/mysql?) would be very helpful.
I have narrowed down the issue down to one commit https://github.com/envoyproxy/envoy/pull/5435 and corresponding https://github.com/istio/istio/pull/11419 - which allows usage of protobuf.Any instead of protobuf.Struct for the Envoy filters.
All other checks in Pilot code around the Envoy version are for things like redis, mysql, weighted routing for TCP, SDS, etc. These features became available in envoy after 1.0 was released. I dont think these could be causing the CPU spikes or instability you saw. So it comes down to the protobuf.Any
@htuch for any pointers that might help spot the issue..
And finally, @dwradcliffe , the CPU profile, when concurrency is not specified (i.e. the case with wild spikes) would certainly be helpful. Also, when such spikes are happening, if you could get some envoy stats dump (curl localhost:15000/stats), it would help..
rshriram
on 1 Mar 2019
docker.io/rshriram/pilot:1.1-rc0-structonly-2 did not seem to help. Same behavior at the beginning.
I should mention that in all these tests it seems that a single pilot pod restarting (I have 2 running) causes the proxies to fail in such a way that they stop handing traffic and return 503s/failures. I'm not sure if this is related or if this is different bug. I planned on gathering more details about this and submitting a separate bug next week but wanted to mention in case it's related.
dwradcliffe
on 1 Mar 2019
I should mention that in all these tests it seems that a single pilot pod restarting (I have 2 running) causes the proxies to fail in such a way that they stop handing traffic and return 503s/failures. I'm not sure if this is related or if this is different bug.
We are aware of this issue for sure. but thanks for reporting. we have another data point for this issue.. (cc @costinm / @hzxuzhonghu / @mandarjog / @duderino ). Lets discuss this in https://github.com/istio/istio/issues/12117, where @morvencao observed same behavior. Lets keep this issue focussed on the spikes.
rshriram
on 1 Mar 2019
concurrency now defaults to 2 as of 1.1rc2. This PR from @mandarjog changed it: https://github.com/istio/istio/pull/11476/files
Demoting to P1 to cover any remaining work, but please close if nothing remains
duderino
on 4 Mar 2019
@rshriram Any progress figuring out what the problem is with the config format change?
dwradcliffe
on 5 Mar 2019
So the only culprit we have is the struct vs Any change. After talking to @htuch, we concluded that we need some detailed cpu profiles to identify why the use of Any is causing so much CPU usage when using >2 cores..
rshriram
on 10 Mar 2019
With rc3, concurrency=1, and 800m CPU we're still seeing periodic spikes of CPU usage/throttling. During these spikes we're seeing Envoy proxy is NOT ready: failed retrieving Envoy stats: Get http://127.0.0.1:15000/stats?usedonly: net/http: request canceled (Client.Timeout exceeded while awaiting headers) in the logs. Seems like maybe it's reloading the (huge) config and it's unavailable during that time?
dwradcliffe
on 10 Mar 2019
So the only culprit we have is the struct vs Any change. After talking to @htuch, we concluded that we need some detailed cpu profiles to identify why the use of Any is causing so much CPU usage when using >2 cores..
@rshriram that's because configs with Any have unstable hash, which results in full add/drain cycle for all listeners.
 PiotrSikora
on 11 Mar 2019
PiotrSikora
on 11 Mar 2019
@PiotrSikora Is there another source of non-deterministic apart from map order? It's easy to fix map marshalling in gogo for istio APIs. Not so sure about all of Envoy APIs though.
 kyessenov
on 11 Mar 2019
kyessenov
on 11 Mar 2019
https://github.com/istio/api/pull/846 fixes any for mixerclient
kyessenov
on 11 Mar 2019
https://github.com/envoyproxy/envoy/pull/6241 fixes for envoy (once it goes through go control plane)
kyessenov
on 11 Mar 2019
This will be in 1.1RC4 which should be published later today
duderino
on 12 Mar 2019
@michaelkipper @dwradcliffe we think this has been fixed in RC4, but please reopen if RC4 doesn't solve the issue for you
duderino
on 13 Mar 2019
Unfortunately I don't think this is fixed.
Running 1.1.0-rc.4 with --concurrency=1 on the same cluster scale that was originally reported I'm still seeing periodic spikes leading to throttling, higher latency, and 503s.
If we apply a Sidecar resource to scope down the config to a few egress clusters we don't seem to have the same spikes. (not pictured in the graph)
dwradcliffe
on 14 Mar 2019
could you test with: https://github.com/istio/istio/pull/12412
where you disable any using env var
rshriram
on 14 Mar 2019
and #12412 is present in 1.1rc5, but not 1.1rc4
duderino
on 14 Mar 2019
Actually, rereading the comment in https://github.com/istio/istio/issues/12162#issuecomment-472839097 I think this is to be expected.
The fix in https://github.com/istio/istio/pull/12412 eliminated spikes from the xDS updates when there are no changes, but envoy still does lots of work when the xDS update has actual changes. The same comment was made on https://github.com/istio/istio/issues/11937#issuecomment-472373863
So using the Sidecar resource is exactly the right thing to do here. This effectively reduces the frequency of xDS updates having actual changes because each Envoy only sees the changes it needs to see.
So I think we can go back to saying that this is fixed, use the Sidecar resource when scalability is a concern, and perhaps we can find some way to optimize Envoy's handling of xDS updates with changes in 1.1.x
duderino
on 14 Mar 2019
Hmmm, though I can't explain why 1.1 would be worse than 1.0. @rshriram @mandarjog @kyessenov @costinm any ideas?
duderino
on 14 Mar 2019
Ok, I tried rc5 with PILOT_DISABLE_XDS_MARSHALING_TO_ANY=true (and no Sidecar) and everything is MUCH BETTER! Zero failed requests, no cpu spikes, latency 3x lower.
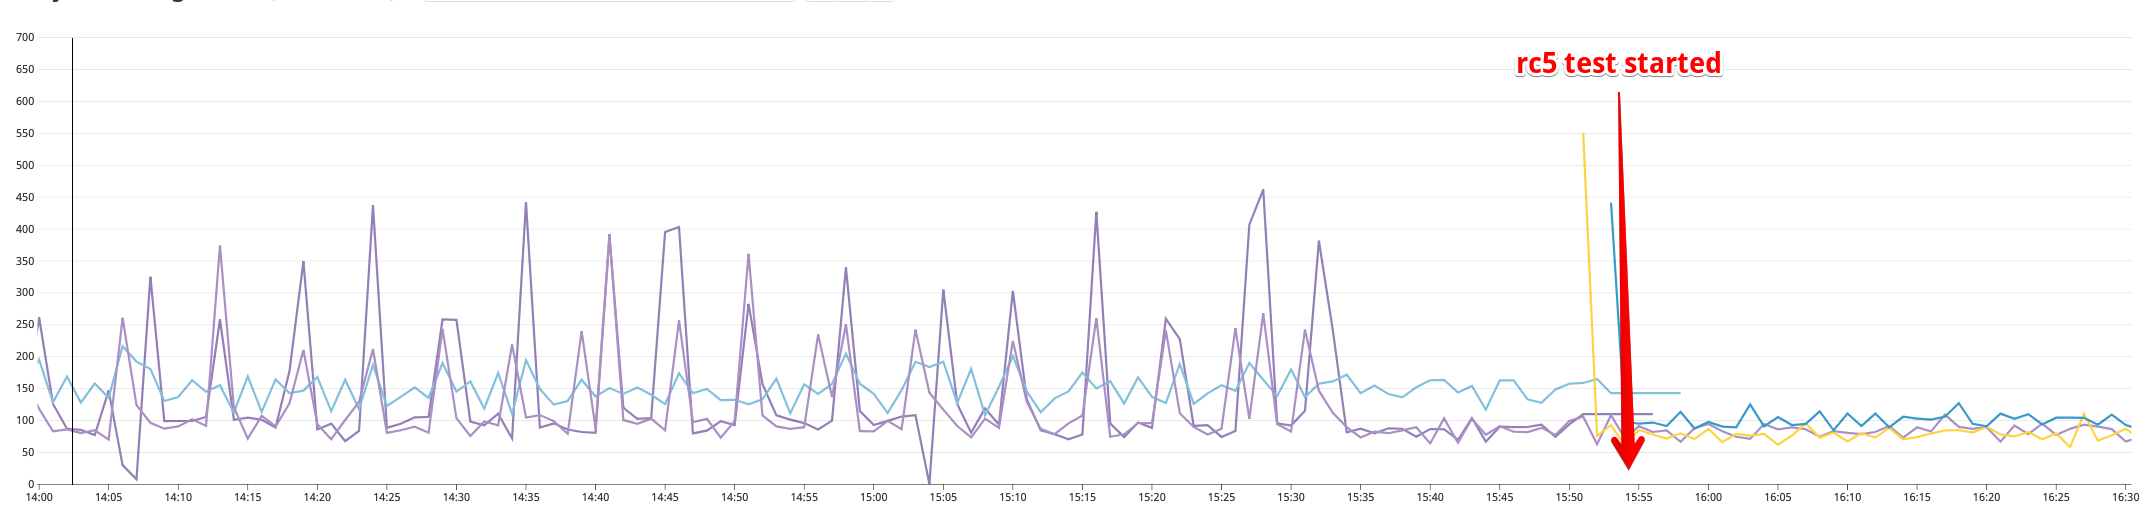
dwradcliffe
on 14 Mar 2019
@philrud boy am I glad we got your fallback plan into RC5.
OK, so there's a story here we still don't understand, and I'll leave the bug open to track the answer for it, but at least we can say this is not a 1.1 blocker.
@costinm @mandarjog @philrud @rshriram @hzxuzhonghu @kyessenov should we default PILOT_DISABLE_XDS_MARSHALING_TO_ANY to true for 1.1?
duderino
on 14 Mar 2019
My cluster is on the large end of the spectrum but even at smaller scale this is probably doing something undesirable, so to me it would make sense to default to true.
dwradcliffe
on 14 Mar 2019
I just noticed that the listener config on the proxies are now different. (Maybe that's expected?) But we are missing some functionality - such as JSON access logs. There might be more things missing?
Listener config dump: https://gist.github.com/dwradcliffe/cc79db75c9054468dc8bac2bd42df256
dwradcliffe
on 14 Mar 2019
Was there any other change there? AccessLog / json access log are only available for >=1.1 proxy. Is it possible that you also changed the proxy version in the middle? If you disable any by claiming proxy 1.0 I expect to see this output. If you used PILOT_DISABLE_XDS_MARSHALING_TO_ANY to disable any then we have to investigate further.
mandarjog
on 15 Mar 2019
No other changes. The proxy didn’t even restart, just got a new configuration push from the new pilot. If you look at my gist you can see all the keys of the config hash are different.
dwradcliffe
on 15 Mar 2019
Given that this continues to be a problem here, I do vote for having PILOT_DISABLE_XDS_MARSHALING_TO_ANY=1
@philrud can you make that change?
- In pilot values install/kubernetes/helm/istio/charts/pilot/values.yaml , add
PILOT_DISABLE_XDS_MARSHALING_TO_ANY=1along withGODEBUG - Update pilot so that
PILOT_DISABLE_XDS_MARSHALING_TO_ANY="0"will actually have the desired effect.
Thanks.
mandarjog
on 15 Mar 2019
agree
hzxuzhonghu
on 15 Mar 2019
@dwradcliffe When you say you "tried rc5" or "Running 1.1.0-rc.4", is the pilot version rc5(or rc4) or istio-proxy pod? My understanding is that the version of pilot matters. Maybe other components as well. But not the version of istio-proxy (aka the injected sidecar pod)
 lambdai
on 15 Mar 2019
lambdai
on 15 Mar 2019
Each time it was full control plane and proxy versions upgraded.
dwradcliffe
on 15 Mar 2019
@mandarjog @PhilipGough @philrud I found the reason the access log is broken, see my PR fix: https://github.com/istio/istio/pull/12516
dwradcliffe
on 15 Mar 2019
Here's a PR based on the discussion with @mandarjog and @costinm (see the PR description for details): https://github.com/istio/istio/pull/12537
 philrud
on 15 Mar 2019
philrud
on 15 Mar 2019
Last two PRs will be in 1.1rc6 (and nothing else except for some samples and doc changes)
duderino
on 16 Mar 2019
Confirmed access logs are fixed in 1.1.0-rc.6.
dwradcliffe
on 18 Mar 2019
Hi, we have a similar issue with istio 1.0.5. Do you know if this version is affected by this bug?
 aurolle
on 2 Apr 2019
aurolle
on 2 Apr 2019
Hi, we have a similar issue with istio 1.0.5. Do you know if this version is affected by this bug?
Any issues on 1.0.5 are unrelated to this particular issue.
dwradcliffe
on 2 Apr 2019
I think this issue can be closed.
hzxuzhonghu
on 3 Jun 2019
@hzxuzhonghu Was there a fix? Is it safe to re-enable XDS marshaling to Any?
dwradcliffe
on 3 Jun 2019
@silentdai is still investigating it.
mandarjog
on 3 Jun 2019
I am seeing consistent CPU with PILOT_DISABLE_XDS_MARSHALING_TO_ANY=0 and =1. Was anyone else ever able to reproduce the CPU spikes?
It is possible a fix went into envoy, or maybe my test setup is not as complex as the original issue so I didn't run into the problem. Here is a snapshot of CPU usage: https://snapshot.raintank.io/dashboard/snapshot/1RevrAsTsNpH6a04TBJSxIVcEB1PVdwL?orgId=2
I turned on Any marshalling at 14:51 and can see no difference in proxy CPU, but Pilot cpu is 10x less.
 howardjohn
on 25 Jun 2019
howardjohn
on 25 Jun 2019
Today when I am running trying to profile the envoy, protobuf::Any is always faster. It's reasonable as config(typed Struct) almost always transforms to Json and then transforms to typed_config (typed Any). See https://github.com/envoyproxy/envoy/blob/master/source/common/config/utility.cc#L257
lambdai
on 25 Jun 2019
benchmark(code [here] (https://github.com/silentdai/envoy/commit/ff042a35a73af8eb71cf3f6ac4721af7ffa34332))
Any is almost 100 times faster
Benchmark Time CPU Iterations
LdsBenchmarkFixture/TestStruct/1 135708 ns 135695 ns 5066
LdsBenchmarkFixture/TestStruct/8 1085932 ns 1085826 ns 633
LdsBenchmarkFixture/TestStruct/64 8698649 ns 8697656 ns 81
LdsBenchmarkFixture/TestStruct/512 69195938 ns 69190686 ns 10
LdsBenchmarkFixture/TestStruct/4096 551738739 ns 551696970 ns 1
LdsBenchmarkFixture/TestAny/1 1397 ns 1397 ns 500058
LdsBenchmarkFixture/TestAny/8 11189 ns 11188 ns 62539
LdsBenchmarkFixture/TestAny/64 89325 ns 89316 ns 7857
LdsBenchmarkFixture/TestAny/512 712695 ns 712639 ns 985
LdsBenchmarkFixture/TestAny/4096 5700993 ns 5700542 ns 123
lambdai
on 25 Jun 2019
@silentdai I think the average cpu was always better with “any”, but there are periodic spikes that can be throttled and they can result in 503s. @dwradcliffe can you re-run with “any”, perhaps a change in Envoy has already fixed the problem.
mandarjog
on 25 Jun 2019
The known potential 503 could be:
- Drain timeout: The default timeout is 45 seconds. It a long server request (not keep alive connection) is longer than 45 seconds that request will be interrupted and lead to 503 to downstream.
- envoy exit. This might be what we saw at the beginning. The
Anybroke the implicit promise that pilot and envoy should see the same config on the wire if there is no config update. The listeners were drained endless once the promise is broken. Still we should see no 503 until the endless and frequent drains oom envoy. - Early apps. Envoy announce ready when the incoming ports are ready. But there is no guarantee that envoy learn the latest mesh config at that moment. So the app as a client might see 503.
- There was also fixes in envoy that prevent reusing a broken connection to upstream since this issue was created.
If there is any other causes of 5XX please let me know
lambdai
on 25 Jun 2019
In 1.3 we have re-enabled PILOT_DISABLE_XDS_MARSHALING_TO_ANY, as after substantial testing we have not been able to see any negative impacts. This is assumed to be fixed because of this.
If you do run into any issues, please let us know ASAP
howardjohn
on 5 Aug 2019
Issue is back with 1.3 : https://github.com/istio/istio/issues/17383
 prune998
on 26 Sep 2019
prune998
on 26 Sep 2019
Related issues
 Stono
·
65Comments
Stono
·
92Comments
hzxuzhonghu
·
96Comments
Stono
·
65Comments
Stono
·
92Comments
hzxuzhonghu
·
96Comments
 yacut
·
73Comments
yacut
·
73Comments
 lhotrifork
·
78Comments
lhotrifork
·
78Comments
Most helpful comment
@philrud boy am I glad we got your fallback plan into RC5.
OK, so there's a story here we still don't understand, and I'll leave the bug open to track the answer for it, but at least we can say this is not a 1.1 blocker.
@costinm @mandarjog @philrud @rshriram @hzxuzhonghu @kyessenov should we default PILOT_DISABLE_XDS_MARSHALING_TO_ANY to true for 1.1?