Istio: 503 errors when scaling down, or rolling out a new application version
Describe the bug
Hey,
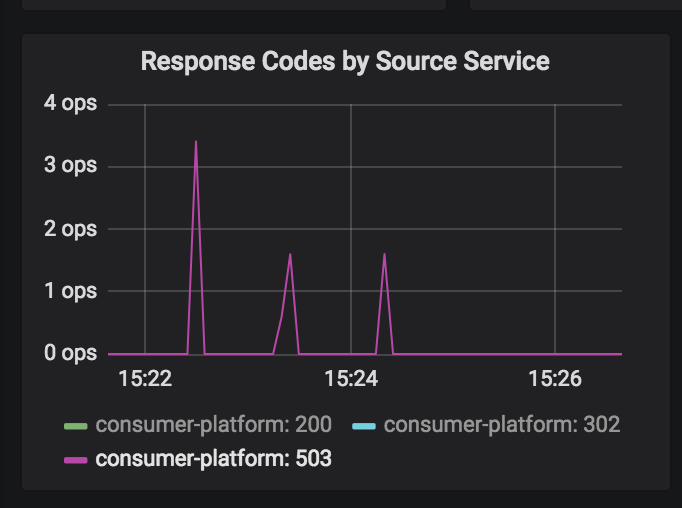
We are noticing blips in services under load during kubernetes rollouts. We observe a handful of 503 errors from istio-proxy on the pod being removed (either because of a rollout, or a scale down). This screenshot is from three separate "scale downs":
When scaling down, this is the sequence of events we observe:
- pod goes into TERMINATING state and is removed from kubernetes endpoints
- A handful of the last requests to the pod are reported by istio-proxy as 503
- those requests are also logged in the upstream calling service as 503
- application exits
- istio-proxy exits
As you can see here:

At the moment, our only saving grace is that we have configured a retry policy which means our end users experience a bit of a slow request, but not a failure - however relying on a retry mechanism in this scenario doesn't feel right.
Expected behavior
The isito-proxy on the application being scaled down should not receive any requests after it has entered a TERMINATING state.
Steps to reproduce the bug
As above, but I can get on hangouts and show you this in detail.
The application itself gracefully handles sigterms and drains and have confirmed this with load tests without istio-proxy in play. I have also added a preStop hook to the application with istio, to ensure the app doesn't receive a SIGTERM until well after istio-proxy shuts down.
Version
gke 1.10.5, istio 1.0
Is Istio Auth enabled or not?
Yes
Environment
GKE
 Stono
Stono
All 92 comments
@mandarjog @PiotrSikora it sounds like we need Envoy to properly enter a lameduck mode upon receiving SIGTERM. Is this something that Envoy currently supports? A quick look at the admin interface didn't reveal anything obvious.
 nmittler
on 7 Aug 2018
nmittler
on 7 Aug 2018
@nmittler what about https://www.envoyproxy.io/docs/envoy/latest/intro/arch_overview/draining? Do we care about SIGTERM in particular or just a mechanism for draining?
Also, does Pilot know about the pods being terminated to update routes to the particular service? Since draining will only help with not accepting new connections/requests, but they still have to be routed elsewhere.
 PiotrSikora
on 7 Aug 2018
PiotrSikora
on 7 Aug 2018
I agree with @PiotrSikora - from my observations - envoy and the app drain fine when they get a SIGTERM however envoy is still getting routed requests from other envoys after it's entered a "terminating" state.
Is there anyone actively looking at this work by the way? This is a real stickler for us as we fundamentally can't move any of our more critical applications as this problem results in client impacting events whenever a pod is terminated (rollout, reschedule, node upgrades, scaling).
I can actively demonstrate this on our pre-prod cluster and can dedicate as much time as needed to helping whoever can work on this problem, or even give them access to our test cluster.
Stono
on 9 Aug 2018
@mandarjog IIRC you were looking into this ... can you confirm or re-assign as appropriate?
nmittler
on 10 Aug 2018
I checked the kube client code as well as the docs. https://kubernetes.io/docs/concepts/workloads/pods/pod-lifecycle/#pod-and-container-status
There is no way for pilot to know whether a pod is being terminated, as that status doesn't exist in the API. If someone finds it, please let me know. Otherwise, retry seems like the best solution so far
 rshriram
on 23 Aug 2018
rshriram
on 23 Aug 2018
@rshriram I don't think you need to know if the other container is being terminated. That's not really what I was trying to get across in the original issue.
Think about the kubernetes lifecycle, when a pod is terminated, both containers, eg the app and istio-pilot receive a SIGTERM, the pod is also marked as TERMINATING, at which point it is removed from the kubernetes endpoint list.
Both the app, and istio-proxy handle the SIGTERM asynchronously, and drain accordingly, however we observe upstream istio-proxys on other applications still attempting to send traffic to the now draining container that has been SIGTERMd.
At the point of termination; the pod should be removed from istios registry, and any other istio-pilots trying to talk to it should send their traffic elsewhere.
Stono
on 23 Aug 2018
OK, apologies - I think I miss read your comment. In relation to pilot not knowing a pod is being terminated, wouldn't it get that event from the endpoint change?
As I mentioned before, when a pod is being terminated it is removed from the endpoints.
If that's not the case, couldn't you get istio-proxy to send a signal to istio-pilot when it gets its SIGTERM which is basically telling istio-pilot it's shutting down?
Stono
on 23 Aug 2018
I'm having the same issue.
Is there any workaround?
 diegomarangoni
on 28 Aug 2018
diegomarangoni
on 28 Aug 2018
@diegomarangoni it sucks :-( but it is improved in istio 1.0.1
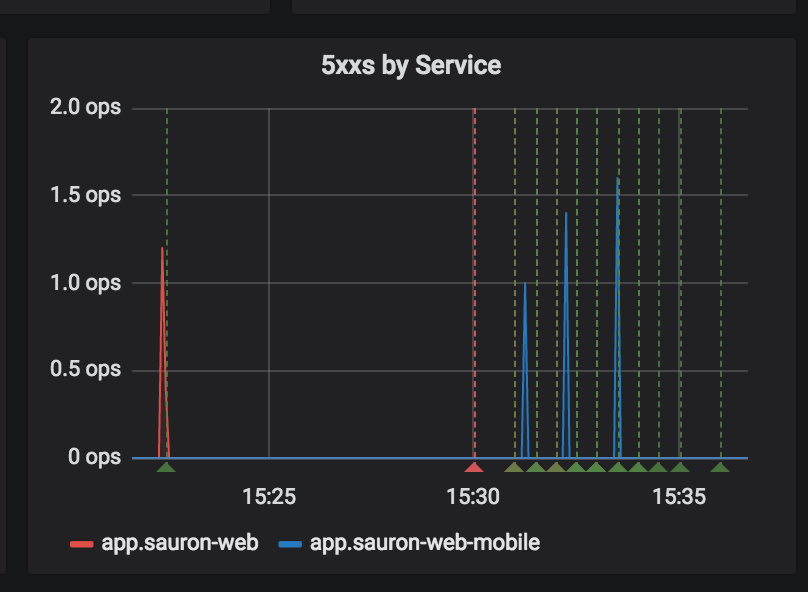
You can see these green lines as our deployments here and the blips are a small amount of ops/s:
We then use a RetryRule on the services:
apiVersion: networking.istio.io/v1alpha3
kind: VirtualService
metadata:
  name: sauron-web
  namespace: sauron-web
spec:
  hosts:
  - app
  http:
  - appendHeaders:
      x-envoy-upstream-rq-timeout-ms: "0"
    retries:
      attempts: 3
      perTryTimeout: 10s
    route:
    - destination:
        host: app
      weight: 100
    timeout: 30s
Which further smoothes it.
But yes, I'd much rather we had a proper solution to this :-(
Stono
on 28 Aug 2018
A chosen endpoint not being available can happen on the data path at any time. The sending proxy knows there is a problem when it receives conn reset, or 503 from upstream. The datapath must be able to handle the case where it has slightly stale endpoints. Pilot cannot guarantee removal of endpoints in a timely manner. This is because 1. The event may be delivered late to pilot
- Pilot may debounce many events
- There may be many sidecars
We can tighten this interval but cannot eliminate it. I think retry is the right solution,
Even after we implement quiesce.
 mandarjog
on 28 Aug 2018
mandarjog
on 28 Aug 2018
@Stono your workaround is working, increased the latency as expected, but working.
At least no more 503s, I am running in production :)
diegomarangoni
on 28 Aug 2018
Glad it helped @diegomarangoni. @mandarjog I largely agree with you, but we have to be very careful not to rely/fallback to "just do retries". As retries can very quickly cascade (in a large microservice architecture like ours), and cause other problems. They can also mask other issues.
I'm not sure how best to approach it, and I agree that 0 503's is probably unattainable, but there should be some sort of measured target/SLO that is tested as part of the istio release lifecycle, or we risk more and more sneaking in.
Stono
on 28 Aug 2018
@rshriram just a question related to this - does istio proxy use draining during rolling updates? If it uses, is it via /healthcheck/fail endpoint supported by envoy? If it does not, how does it take care of inflight requests that might require egress calls? Sorry if it has already been explained and I missed that.
 ramaraochavali
on 30 Aug 2018
ramaraochavali
on 30 Aug 2018
@rshriram when you get time, can you please help with this?
ramaraochavali
on 1 Sep 2018
@Stono Can't the circuit-breaking feature be used in this issue?
 thspinto
on 13 Sep 2018
thspinto
on 13 Sep 2018
I've set up a simple POC to reproduce this bug using minikube.
thspinto
on 17 Sep 2018
@thspinto maybe combined with retries. Circuit breaker would only kick in after a few fails
Stono
on 17 Sep 2018
@ramaraochavali sorry I missed your comment.
We don't do any draining, because we don't use envoy's active healthchecks. May be thats part of the problem, but K8S users seem to want the platform's passive health checks (readiness/liveness probes). So we/pilot is at the mercy of those checks - and the statuses that they report to kube API server. In terms of the lifecycle, the two containers/processes are just like anything else in k8s. Both get sigterm. We have the default envoy behavior when sigterm is received. We could trap sigterm and convert it to /healthcheck/fail but as I stated above, its pointless as we don't use envoy's active health checks at all.
As @nmittler mentioned, we need a way for Envoy to immediately enter into a lameduck mode where it stops accepting inbound connections. We also need a more principled approach to container termination (terminate envoy and then the app - per nathan's K8S feature request for dependency driven container start in a pod).
rshriram
on 17 Sep 2018
@rshriram how about using POD's Delete hook where you could run a command/binary or a better option a finalizer. With finalizer POD does not get removed until finalizer removes itself form the list. So the controller which implements a finalizer could track the actual app state and once everything is settled to let k8s cluster to remove pod.
 sbezverk
on 17 Sep 2018
sbezverk
on 17 Sep 2018
That is a nice idea. A bit more machinery but allows for a cleaner way to remove pods.
rshriram
on 17 Sep 2018
@rshriram if you already tracking POD's with envoy in some controller, then it will be really easy to add, otherwise it will require a new controller tracking all envoy enabled pods.
sbezverk
on 17 Sep 2018
@rshriram No problem. Thanks. We are in the same situation where we do not use active health checks and hence can not use the draining feature. During k8s rolling upgrades we see spikes in 503s. We are experimenting to see if combination of retry/outlier detection can help reduce the 503s. Probably Envoy should have the same behaviour on SIGTERM or some other equivalent of /healthcheck/fail for those who do not use active health checks?
ramaraochavali
on 18 Sep 2018
@ramaraochavali I was using retry to mitigate the 503s issues, but I can’t rely on that because some requests can’t just be repeated.
But I didn’t try the outlier detection. Could you give us an update when finish your experiments?
diegomarangoni
on 18 Sep 2018
Yes sure. retries for the specific reason you mentioned may not fully help here. Did you get any positive results with retries? How much improvement did you see in your tests?
ramaraochavali
on 18 Sep 2018
Yeah if Envoy had healthcheck/fail style behavior for sigterm and the Envoy cluster (client side) had a built in retry behavior that upon seeing x-Envoy-shutting-down, calls another endpoint in the cluster, we could solve this problem
rshriram
on 18 Sep 2018
I beg you to find a solution haha. The idea of sending back a x-envoy-shutting-down and then making it retry to another envoy seems to make sense
Stono
on 18 Sep 2018
It only works for http :(
rshriram
on 18 Sep 2018
Selfishly that's all I care about :D haha. I would actually suspect it is
the majority of use cases too?
My gut is there are going to have to be protocol specific ways of dealing
with things, probably unrealistic to be able to solve all issues in a
procotol agnostic way.
On Tue, 18 Sep 2018, 4:57 pm Shriram Rajagopalan, notifications@github.com
wrote:
It only works for http :(
—
You are receiving this because you were mentioned.
Reply to this email directly, view it on GitHub
https://github.com/istio/istio/issues/7665#issuecomment-422448522, or mute
the thread
https://github.com/notifications/unsubscribe-auth/ABavicH92DN811rdjtpfNUbEXLDdpoziks5ucRfagaJpZM4Vwg1y
.
Stono
on 18 Sep 2018
@ramaraochavali It worked at first, but some services where which I do file uploading/processing, where the request can take from 1s or 10m or random, it does not work because the istio retry timeout is fixed.
edit: I also had some concurrency issues
another alternative is use green/blue, but doesn’t prevent against Pod failure
diegomarangoni
on 19 Sep 2018
We are facing the same problem as well - whenever there is a pod restart, there is a spike in 503 responses on our gateway. Our gateway communicates with all the services using gRPC, and the retry solution above also doesn't seem to work.
@rshriram Does HTTPRetry work with gRPC services?
 ayushpateria
on 2 Oct 2018
ayushpateria
on 2 Oct 2018
Facing the same problem like @ayushpateria for grpc...
 cosmicnag
on 16 Oct 2018
cosmicnag
on 16 Oct 2018
I used these headers in my virtual service to avoid retry on legit 5xx:
apiVersion: networking.istio.io/v1alpha3
kind: VirtualService
metadata:
  name: test
  namespace: test
spec:
  http:
  - appendHeaders:
      x-envoy-max-retries: "10"
      x-envoy-retry-on: connect-failure
      x-envoy-upstream-rq-timeout-ms: "0"
    route:
    - destination:
        host: some-test
Still only helps with http requests though.
thspinto
on 16 Oct 2018
Probably linked: https://github.com/istio/istio/issues/9113
@thspinto - that didn't fix it for me :'( under any sort of load this is such a problem
Stono
on 24 Oct 2018
I've uploaded a recording showing just how bad this is, under 20 or so requests a second, during a rollout we got around a 10% error rate:
This test was doing a variety of urls which return either instantly, 250ms, 500ms or 1000ms delayed. Errors were visible on all routes.
https://asciinema.org/a/bVrgP5eL80R7qU2uSco3bOa75
Our VirtualService:
  spec:
    hosts:
    - app
    http:
    - appendHeaders:
        x-envoy-max-retries: "10"
        x-envoy-retry-on: connect-failure
        x-envoy-upstream-rq-timeout-ms: "0"
      route:
      - destination:
          host: app
        weight: 100
      timeout: 10s
We start seeing 503's basically the moment that a pod enters the Terminating state.
If you add a preStop hook to both istio-proxy and your app with a sleep 5, it'll delay the SIGTERM from getting to either pod for 5 seconds.
What you see in the istio-proxy logs then is:
[2018-10-24 12:12:02.073][27][info][main] external/envoy/source/server/drain_manager_impl.cc:63] shutting down parent after drain
[2018-10-24 12:12:11.331][27][info][upstream] external/envoy/source/common/upstream/cluster_manager_impl.cc:553] removing cluster inbound|80||app.karl-test.svc.cluster.local
[2018-10-24 12:12:16.870][27][warning][main] external/envoy/source/server/server.cc:373] caught SIGTERM
I'll start seeing 503 errors at 12:12:11.331, not 12:12:16.870 - which is when the pods actually receive their SIGTERM and start shutting down.
Stono
on 24 Oct 2018
@Stono
I also had this in the deployment:
  minReadySeconds: 5 # this was a random choice, you can test out other values here
  strategy:
    type: RollingUpdate
    rollingUpdate:
      maxSurge: 1          # if you have a large deployment a small % might be better
      maxUnavailable: 0 # or some number that is low relative to the replication count
The idea is that the % of instances updating should be small considering the size of the deployment, so the probability of hitting an unhealthy pod is low. Not perfect but might help though.
thspinto
on 24 Oct 2018
In our case it was mainly due to
--drainDuration 45s --parentShutdownDuration 1m0s --connectTimeout 10s parameters passed to istio-proxy.
We run istio 1.0.1, and the above values are the default ones generated by helm template.
I think istio 0.8 uses these default values:
- connectTimeout: 1s
- drainDuration: 2s
- parentShutdownDuration: 3s
I used some values more suitable for us and the 503s dramatically reduced in number.
Then using appendHeaders in the virtual service as suggested by @thspinto almost removed them completely, it's more manageable now.
 yoz2326
on 31 Oct 2018
yoz2326
on 31 Oct 2018
Any specific action item where one could start implementing a solution? Even though we can configure retries, circuit breakers et. al. I think a pod should still shutdown gracefully and the istio-proxy in particular should not drop active connections on the floor.
https://www.envoyproxy.io/docs/envoy/latest/intro/arch_overview/draining reads to me as if we'd need to call the healthcheck/fail endpoint preStop and then give it some time to drain. The default could be to have a hard sleep in there. A possible improvement over this could be to poll the /clusters endpoint until the number of active connections drops to 0.
WDYT? I feel like this is very important for error free operation in a production setup.
 markusthoemmes
on 7 Nov 2018
markusthoemmes
on 7 Nov 2018
A relevant upstream issue: https://github.com/envoyproxy/envoy/issues/3837
markusthoemmes
on 7 Nov 2018
How about having a kubernetes webhook that signals pilot when a pod IP is removed from a kubernetes service endpoints list, so it should not be used in load balancing anymore? Then pilot pushes updates to envoy pods.
yoz2326
on 7 Nov 2018
@yoz2326 that doesn't help for in-flight requests though. The proxy shouldn't just drop these connections to the floor.
markusthoemmes
on 7 Nov 2018
Doing a bit more reading, envoy does have something like a hot-reloading script, which also supports SIGTERM based exit.
https://github.com/istio/istio/pull/6734 was a PR that kinda attempted to replicate that in the pilot-agent. I'm happy to revive that PR and push it to completion if that's deemed useful. My current view of the situation:
The pilot agent would send SIGTERM to the envoy process and wait for it to be shut down before shutting down itself.
markusthoemmes
on 7 Nov 2018
@markusthoemmes it already captures sigterms and drains, I believe the 503s however are caused by upstream istio-proxies not knowing that the downstream proxy has been drained, because it takes
Eg:
 - user talks to a
 - a talks to b
 - b sends response, all good
 - user talks to a
 - b sigterms, and exits
 - a tries to talk to b because it hasn't had an update from pilot yet that b has gone
 - a 503s
 - pilot detects b has gone and pushes update to a
 - user talks to a
 - a talks to c instead as b has gone
@Stono Interesting. Still wondering though why my app's connections are dropped on the floor? If I delete a pod that has an in-flight request on it, that wouldn't be caused by misscheduling to a terminating pod right?
markusthoemmes
on 7 Nov 2018
@yoz2326 that doesn't help for in-flight requests though. The proxy shouldn't just drop these connections to the floor.
Wouldn't pod terminationGracePeriodSeconds setting allow for in flight connections to finish?
yoz2326
on 7 Nov 2018
@yoz2326 that's set to 30 by default IIRC, so requests from 0 to ~30s should be fine even with default behavior I think.
markusthoemmes
on 7 Nov 2018
@yoz2326 that doesn't help for in-flight requests though. The proxy shouldn't just drop these connections to the floor.
Wouldn't pod
terminationGracePeriodSecondssetting allow for in flight connections to finish?
Nope.... doesn't seem to help.
Stono
on 7 Nov 2018
@Stono what settings do you use for drainDuration, `parentShutdownDuration and discoveryRefreshDelay on istio-proxy?
yoz2326
on 7 Nov 2018
@Stono are you certain that the pilot-agent does drain already? It does seem to drain properly on configuration updates etc. Regarding shutdown logic, it looks more like a hard shutdown to me.
markusthoemmes
on 7 Nov 2018
nginx-ingress has a similar problem. It might update endpoints a few seconds later than the start of termination. In order for the pod to respond, it is advised to use sleep 15 in lifecycle.preStop.
However as @Stono reported, it does not work for the istio-proxy sidecar. When using sleep 15, I find this in the upstream istio-proxy, confirming that the 503 NR happens right after start of pod termination, not when the SIGTERM kicks in.
200 OK requests...
[2018-11-20T12:34:47.642Z] "GET /ping HTTP/1.1" 503 NR
503 NR NOT OK for ~1 second
[2018-11-20 12:35:01.785][18][warning][main] external/envoy/source/server/server.cc:373] caught SIGTERM
[2018-11-20 12:35:01.785][18][info][main] external/envoy/source/server/server.cc:436] main dispatch loop exited
So to me it seems the issue is not about the downstream envoy not having updated the endpoints, but that upstream envoy does not pass the traffic to service during the sleep period for some reason.
 mikksoone
on 21 Nov 2018
mikksoone
on 21 Nov 2018
Hmm interesting @mikksoone. We've tried so many combinations of sleeps etc in the downstreams but got nowhere with this, so very frustrating!
Stono
on 26 Nov 2018
So I've been working on another issue today and had a bit of a thought process around these 503s.
Take a scenario on a larger cluster like mine where it can take up to 10seconds for pilot to push config to all the proxies:
2018-11-26T22:56:36.877043Z     info    ads     Push finished: 10.120342411s {
    "Start": "2018-11-26T22:56:26.756693989Z",
    "End": "2018-11-26T22:56:36.876978375Z"
}
So; take an app that is up and running. You come along and you do a rolling deployment of the application, which starts a new endpoint.
That endpoint comes up, as soon as it becomes "ready" from a kubernetes perspective:
- Pilot detects it, waits
PILOT_CACHE_SQUASH(couple of seconds), then starts pushing that endpoint our via EDS to all other proxies - However, kubernetes has already triggered the previous version to TERMINATE.
This can result in a small window where upstream proxies have a config which points to terminated pods.
Ways to work around this that I can think of are:
- Ensure that all pods have a
minReadySecondssetting that is greater than the possible maximum duration of istio pilot push - Ensure that pods (both application and istio-proxy) have a
preStophook which effectively sleeps for a duration that is greater than the maximum duration of istio pilot push
Obviously incremental EDS and namespace scoping which are coming will help a lot with this, but I'm thinking about short term mitigations.
Thoughts?
CC. @costinm @rshriram @mandarjog
Stono
on 27 Nov 2018
Thoughts @costinm @rshriram @mandarjog? We need a plan for 1.1. If there is work to be done other than graph pruning we need to capture it here and get someone on it :)
 duderino
on 28 Nov 2018
duderino
on 28 Nov 2018
When a pod is terminating, it is removed from endpoint and a push will be triggered to remove it from outbound clusters. So as soon as a proxy applies this update, it will not ship traffic to the not existing cluster. But as @mandarjog said https://github.com/istio/istio/issues/7665#issuecomment-416634476 There is a delay, which can not be eliminated.
But IMO, if sidecar has a graceful termination period, like default 30s, after which it quit, instead of currently quit immediately when receive a SIGTERM. By this, this can be mitigated.
The grace termination period can help do:
let the in-flight request done
mitigate the configuration delay, new request can still come until all sidecars configuration take effect.
 hzxuzhonghu
on 29 Nov 2018
hzxuzhonghu
on 29 Nov 2018
Quick question: couldn't the Gateway just ignore a 503 provided it has other routes to try out? Notice that this is not about re-trying, but detecting the 503 and then discarding it, similarly to how a load balancer like HAProxy or NGINX work.
 emedina
on 29 Nov 2018
emedina
on 29 Nov 2018
couldn't the Gateway just ignore a 503 provided it has other routes to try out?
I think yes, if HTTP retry is configured. But we have retry limit, like timeout.
hzxuzhonghu
on 29 Nov 2018
Retries aren't fully effective and tbh are just a plaster on the problem of
stale cluster config
On Thu, 29 Nov 2018, 9:10 am Zhonghu Xu <[email protected] wrote:
couldn't the Gateway just ignore a 503 provided it has other routes to try
out?I think yes, if HTTP retry is configured. But we have retry limit, like
timeout.—
You are receiving this because you were mentioned.
Reply to this email directly, view it on GitHub
https://github.com/istio/istio/issues/7665#issuecomment-442759297, or mute
the thread
https://github.com/notifications/unsubscribe-auth/ABavidr5kDFJC3cKfDwgDonIDf13NKSLks5uz6SQgaJpZM4Vwg1y
.
Stono
on 29 Nov 2018
@hzxuzhonghu Then I'm afraid the issue is whether the retry guarantees idempotency.
emedina
on 29 Nov 2018
Also, has not #9805 solved it? At least based on #9480 it's about upgrading to 1.0.4.
emedina
on 29 Nov 2018
@emedina no - that fix just gets us back to the state we were in when this issue was originally raised.
Stono
on 29 Nov 2018
@Stono Weird, because in my case I have one cluster with 1.0.3 where I was facing this issue, and then another with 1.0.4 where it's working properly. But here I'm strictly speaking about #9480.
emedina
on 29 Nov 2018
Perhaps x-envoy-retry-on: gateway-error would help here?
PiotrSikora
on 5 Dec 2018
We use:
    http:
    - appendHeaders:
        x-envoy-max-retries: "10"
        x-envoy-retry-on: gateway-error,connect-failure,refused-stream
More feedback on this matter...
After a few days suffering from more consistent 503s, today I found out that it was due to the istio-pilot not being able to cope (apparently) with the load of change in my cluster (although we're only talking here about ~350 pods).
I could notice that when starting up new pods, the clusters configuration in their sidecar proxy was only having the static routes, but not the dynamic (so to say) ones; in other words, the sidecar proxy was not receiving the CDS information from the istio-pilot somehow. Additionally, the latter was throwing huge amounts of errors complaining about not being able to push CDS to sidecars:
2018-12-07T08:55:06.300944Z     warn    ads     Repeated failure to push 41 sidecar~174.16.213.15~test-webapp-bcd997dfb-m6g75.performance~performance.svc.cluster.local-269
2018-12-07T08:55:06.300945Z     warn    ads     Repeated failure to push 41 sidecar~174.16.213.187~mpc-wipo-ms-incoming-ftp-578fc5476b-8rzkn.intcorrective-cb~intcorrective-cb.svc.cluster.local-470
2018-12-07T08:55:11.301203Z     warn    ads     Repeated failure to push 41 sidecar~174.16.61.58~kibanatools-payment-data-pipeline-sink-elasticsearch-5b7b4hvm6p.preprod-cb~preprod-cb.svc.cluster.local-66
2018-12-07T08:55:11.301208Z     warn    ads     Repeated failure to push 41 sidecar~174.16.212.245~absolutegrounds-helper-processors-5c4d96f4f6-9ghcw.intcorrective-cb~intcorrective-cb.svc.cluster.local-272
2018-12-07T08:55:16.301500Z     warn    ads     Repeated failure to push 41 sidecar~174.16.61.48~ms-litigation-74b4bb8995-z556q.intcorrective-cb~intcorrective-cb.svc.cluster.local-151
2018-12-07T08:55:16.301643Z     warn    ads     Repeated failure to push 41 sidecar~174.16.74.71~parallelmarks-server-96f79f9-lm4h2.test-ds~test-ds.svc.cluster.local-137
2018-12-07T08:55:21.301748Z     warn    ads     Repeated failure to push 41 sidecar~174.16.61.60~classification-helper-sinks-79f95c5c5c-l4l6p.intcorrective-cb~intcorrective-cb.svc.cluster.local-202
2018-12-07T08:55:21.301801Z     warn    ads     Repeated failure to push 41 sidecar~174.16.15.140~kibanatools-webreports-frontend-64f8957886-zsjc9.preprod-cb~preprod-cb.svc.cluster.local-232
2018-12-07T08:55:26.301984Z     warn    ads     Repeated failure to push 41 sidecar~174.16.142.215~ms-appeal-85d649db59-228p5.preprod-cb~preprod-cb.svc.cluster.local-585
2018-12-07T08:55:26.301985Z     warn    ads     Repeated failure to push 41 sidecar~174.16.60.225~ms-register-6d8c87d86c-sszcn.intcorrective-cb~intcorrective-cb.svc.cluster.local-213
2018-12-07T08:55:31.302289Z     warn    ads     Repeated failure to push 41 sidecar~174.16.213.30~opposition-helper-ui-6649487dd8-jbhbn.intadaptive-cb~intadaptive-cb.svc.cluster.local-260
2018-12-07T08:55:31.302349Z     warn    ads     Repeated failure to push 41 sidecar~174.16.213.42~ms-design-77b78b8764-5b79n.test-cb~test-cb.svc.cluster.local-440
2018-12-07T08:55:36.302505Z     warn    ads     Repeated failure to push 41 sidecar~174.16.138.151~ms-register-pipeline-67b5489849-zgbfd.intadaptive-cb~intadaptive-cb.svc.cluster.local-542
2018-12-07T08:55:36.302505Z     warn    ads     Repeated failure to push 41 sidecar~174.16.142.215~ms-appeal-85d649db59-228p5.preprod-cb~preprod-cb.svc.cluster.local-585
2018-12-07T08:55:41.302759Z     warn    ads     Repeated failure to push 41 sidecar~174.16.213.42~ms-design-77b78b8764-5b79n.test-cb~test-cb.svc.cluster.local-440
2018-12-07T08:55:41.302878Z     warn    ads     Repeated failure to push 41 sidecar~174.16.61.48~ms-litigation-74b4bb8995-z556q.intcorrective-cb~intcorrective-cb.svc.cluster.local-151
2018-12-07T08:55:46.303016Z     warn    ads     Repeated failure to push 41 sidecar~174.16.138.151~ms-register-pipeline-67b5489849-zgbfd.intadaptive-cb~intadaptive-cb.svc.cluster.local-542
2018-12-07T08:55:46.305304Z     warn    ads     Repeated failure to push 41 sidecar~174.16.61.60~classification-helper-sinks-79f95c5c5c-l4l6p.intcorrective-cb~intcorrective-cb.svc.cluster.local-202
2018-12-07T08:55:51.303260Z     warn    ads     Repeated failure to push 41 sidecar~174.16.93.180~ms-register-pipeline-67b5489849-74w9d.intadaptive-cb~intadaptive-cb.svc.cluster.local-596
2018-12-07T08:55:51.305462Z     warn    ads     Repeated failure to push 41 sidecar~174.16.60.225~ms-register-6d8c87d86c-sszcn.intcorrective-cb~intcorrective-cb.svc.cluster.local-213
2018-12-07T08:55:56.303468Z     warn    ads     Repeated failure to push 41 sidecar~174.16.35.55~ms-invalidity-6dcc99fd5d-dgztr.intadaptive-cb~intadaptive-cb.svc.cluster.local-192
2018-12-07T08:55:56.305622Z     warn    ads     Repeated failure to push 41 sidecar~174.16.213.30~opposition-helper-ui-6649487dd8-jbhbn.intadaptive-cb~intadaptive-cb.svc.cluster.local-260
2018-12-07T08:56:01.303734Z     warn    ads     Repeated failure to push 41 sidecar~174.16.81.38~cancellation-helper-processors-fd977dc5-wddkc.test-cb~test-cb.svc.cluster.local-592
2018-12-07T08:56:01.305871Z     warn    ads     Repeated failure to push 41 sidecar~174.16.35.55~ms-invalidity-6dcc99fd5d-dgztr.intadaptive-cb~intadaptive-cb.svc.cluster.local-192
Restarting the istio-pilot does the trick, but this is not a long term solution whatsoever, so now I've basically scaled it out to 5 permanent instances (removing the hpa) to see how it behaves.
emedina
on 7 Dec 2018
@emedina yeah similar for us. Similar numbers of pods but very high churn (many deployments, scaling, pre-emptible nodes etc).
It's worth noting HPA basically does nothing and we have also disabled it in favour of fixed instances.
See https://github.com/istio/istio/issues/7878 for more details but at a high level, HPA scales up a new pilot but nothing goes to it anyway as everything has created long lived connections to the overloaded pilots. It's only when a pod restarts that it can go to the new pilot, and even then it's round robin, not least conn.
Right now, to keep things happy we run this cronjob nightly:
    #!/bin/bash
    set -e
    if kubectl --namespace=istio-system get svc istio-pilot &>/dev/null; then
      kubectl --namespace=istio-system patch svc istio-pilot -p "{\"spec\":{\"selector\": {\"istio\": \"pilot-deploying\"}}}"
      sleep 3
    fi

    # Restart pilot
    kubectl -n istio-system patch deployment istio-pilot -p "{\"spec\":{\"template\":{\"metadata\":{\"labels\":{\"RESTARTED_ON\":\"`date +'%s'`\"}}}}}"
    kubectl -n istio-system rollout status deployment/istio-pilot

    # Patch it back so things can connect to pilot
    if kubectl --namespace=istio-system get svc istio-pilot -o yaml | grep "pilot-deploying" &>/dev/null; then
      sleep 3
      kubectl --namespace=istio-system patch svc istio-pilot -p "{\"spec\":{\"selector\": {\"istio\": \"pilot\"}}}"
    fi
Which loosely rebalances all pods across our available pilots after a day of churn and round robin connection lottery.
You can monitor the pilot -> proxy numbers with this metric:
pilot_xds{instance="10.194.27.21:9093",job="pilot"} | 180
pilot_xds{instance="10.194.27.22:9093",job="pilot"} | 192
And then alert on an imbalance.
If you don't stay on top of pilot, and it's ability to push out changes, then you end up getting 503's as sidecars aren't getting updates fast enough
Stono
on 7 Dec 2018
@Stono I see the point in your nightly restart of istio-pilots; however, it still does not prevent the regular restart of pods during the day to also be impacted, right?
In our case, this is a development cluster which is constantly creating/destroying pods continuously.
emedina
on 7 Dec 2018
Yeah I'm finding that a day's worth of entropy is managable with periodic
rebalancing
On Fri, 7 Dec 2018, 11:46 am Enrique Medina Montenegro <
[email protected] wrote:
@Stono https://github.com/Stono I see the point in your nightly restart
of istio-pilots; however, it still does not prevent the regular restart
of pods during the day to also be impacted, right?In our case, this is a development cluster which is constantly
creating/destroying pods continuously.—
You are receiving this because you were mentioned.
Reply to this email directly, view it on GitHub
https://github.com/istio/istio/issues/7665#issuecomment-445208682, or mute
the thread
https://github.com/notifications/unsubscribe-auth/ABavibKksdJOY6ID0CJJMvtzTsaPXa5qks5u2lT_gaJpZM4Vwg1y
.
Stono
on 7 Dec 2018
What really surprises me is the fact that Istio has been announced recently as production-ready, but this seems like a very sensitive issue yet.
emedina
on 7 Dec 2018
IIUC, there are a couple of issues that are being discussed here:
- When an endpoint in a cluster goes down, Envoy doesn't appear to retry properly, leading to 503s being seen by the client.
- High pod churn seems to be exposing a Pilot issue where new endpoints are not propagated, requiring a reboot of Pilot to resolve the issue.
For 1, I believe I'm able to replicate this running locally. In my experiment, I had 3 Envoys: 1 frontend that has endpoints for 2 backends , each of which talks to a simple application that just returns 200. When I bring 1 backend down, requests going to the frontend alternate between 200 and 503 (using round-robin). Even if the requests use the header x-envoy-retry-on: gateway-error, I still see the alternating (possibly an Envoy bug? @PiotrSikora any thoughts?). However, if I set the retry policy directly on the cluster, I get all 200s as expected. This is something we can certainly look at doing for 1.1.
Number 2 sounds more like an ADS bug and falls more into @costinm's domain. Can you take a look?
nmittler
on 7 Dec 2018
- seems to be high priority for 1.1, and if the change is small I don't mind having it in 1.0.6 given the release expectations of 1.1
For 2 - I can take a look, we had a bug problem in 1.0.3 which is fixed in 1.0.4. Not sure which logs are associated with this case.
There is also 3 - which Josh is handling - if Mixer policy is enabled and in 'fail close' mode, an upgrade of mixer policy can cause 503 for any current request. He will add a retry for the Check call, to hit the new mixer instance.
 costinm
on 7 Dec 2018
costinm
on 7 Dec 2018
@emedina Can you open a separate bug on pilot ADS not coping and failing to push, and add more logs/info if you have them ?
costinm
on 7 Dec 2018
@costinm I just opened #10360 as you requested.
Not sure if related to #8554 as well, though.
emedina
on 8 Dec 2018
I could reproduce again the issue of the pilot not properly handling the restart of one of my pods and still keeping the old IP by using the bookinfo application.
# kubectl get all -owide
NAME                                  READY   STATUS            RESTARTS   AGE   IP               NODE           NOMINATED NODE
pod/curl-74f57bfd66-7wlhs             1/1     Running           0          4d    174.16.32.124    orhlp-dck015   <none>
pod/details-v1-6764bbc7f7-xc5cc       2/2     Running           0          2d    174.16.32.112    orhlp-dck015   <none>
pod/nfs-busybox-7fd4f7fdd8-vcrlq      1/1     Running           0          19d   174.16.32.121    orhlp-dck015   <none>
pod/productpage-v1-54b8b9f55-vmhfm    2/2     Terminating       0          2d    174.16.207.184   orhlp-dck011   <none>
pod/productpage-v1-77758fb579-srwqj   0/2     PodInitializing   0          23s   174.16.135.210   ochlp-dck018   <none>
pod/ratings-v1-7bc85949-28q5f         2/2     Running           0          2d    174.16.32.74     orhlp-dck015   <none>
pod/reviews-v1-fdbf674bb-kfmw4        2/2     Running           0          2d    174.16.32.120    orhlp-dck015   <none>
pod/reviews-v2-5bdc5877d6-967bp       2/2     Running           0          2d    174.16.135.217   ochlp-dck018   <none>
pod/reviews-v3-dd846cc78-qhpgj        2/2     Running           0          2h    174.16.186.67    orhlp-dck017   <none>

NAME                  TYPE        CLUSTER-IP       EXTERNAL-IP   PORT(S)    AGE   SELECTOR
service/details       ClusterIP   174.20.170.127   <none>        9080/TCP   2d    app=details
service/kubernetes    ClusterIP   174.20.0.1       <none>        443/TCP    21d   <none>
service/productpage   ClusterIP   174.20.178.143   <none>        9080/TCP   2d    app=productpage
service/ratings       ClusterIP   174.20.123.107   <none>        9080/TCP   2d    app=ratings
service/reviews       ClusterIP   174.20.1.215     <none>        9080/TCP   2d    app=reviews
Notice above that the old pod (productpage-v1-54b8b9f55-vmhfm) had an IP 174.16.207.184 and the new one (productpage-v1-77758fb579-srwqj) is 174.16.135.210. However, when I query the clusters endpoint from the sidecar proxy inside the new pod:
# kubectl exec -ti productpage-v1-77758fb579-srwqj -c istio-proxy -- curl localhost:15000/clusters|grep productpage|grep outbound

outbound|9080||productpage.default.svc.cluster.local::default_priority::max_connections::1024
outbound|9080||productpage.default.svc.cluster.local::default_priority::max_pending_requests::1024
outbound|9080||productpage.default.svc.cluster.local::default_priority::max_requests::1024
outbound|9080||productpage.default.svc.cluster.local::default_priority::max_retries::3
outbound|9080||productpage.default.svc.cluster.local::high_priority::max_connections::1024
outbound|9080||productpage.default.svc.cluster.local::high_priority::max_pending_requests::1024
outbound|9080||productpage.default.svc.cluster.local::high_priority::max_requests::1024
outbound|9080||productpage.default.svc.cluster.local::high_priority::max_retries::3
outbound|9080||productpage.default.svc.cluster.local::added_via_api::true
outbound|9080||productpage.default.svc.cluster.local::174.16.135.210:9080::cx_active::0
outbound|9080||productpage.default.svc.cluster.local::174.16.135.210:9080::cx_connect_fail::0
outbound|9080||productpage.default.svc.cluster.local::174.16.135.210:9080::cx_total::0
outbound|9080||productpage.default.svc.cluster.local::174.16.135.210:9080::rq_active::0
outbound|9080||productpage.default.svc.cluster.local::174.16.135.210:9080::rq_error::0
outbound|9080||productpage.default.svc.cluster.local::174.16.135.210:9080::rq_success::0
outbound|9080||productpage.default.svc.cluster.local::174.16.135.210:9080::rq_timeout::0
outbound|9080||productpage.default.svc.cluster.local::174.16.135.210:9080::rq_total::0
outbound|9080||productpage.default.svc.cluster.local::174.16.135.210:9080::health_flags::healthy
outbound|9080||productpage.default.svc.cluster.local::174.16.135.210:9080::weight::1
outbound|9080||productpage.default.svc.cluster.local::174.16.135.210:9080::region::
outbound|9080||productpage.default.svc.cluster.local::174.16.135.210:9080::zone::
outbound|9080||productpage.default.svc.cluster.local::174.16.135.210:9080::sub_zone::
outbound|9080||productpage.default.svc.cluster.local::174.16.135.210:9080::canary::false
outbound|9080||productpage.default.svc.cluster.local::174.16.135.210:9080::success_rate::-1
outbound|9080||productpage.default.svc.cluster.local::174.16.207.184:9080::cx_active::0
outbound|9080||productpage.default.svc.cluster.local::174.16.207.184:9080::cx_connect_fail::0
outbound|9080||productpage.default.svc.cluster.local::174.16.207.184:9080::cx_total::0
outbound|9080||productpage.default.svc.cluster.local::174.16.207.184:9080::rq_active::0
outbound|9080||productpage.default.svc.cluster.local::174.16.207.184:9080::rq_error::0
outbound|9080||productpage.default.svc.cluster.local::174.16.207.184:9080::rq_success::0
outbound|9080||productpage.default.svc.cluster.local::174.16.207.184:9080::rq_timeout::0
outbound|9080||productpage.default.svc.cluster.local::174.16.207.184:9080::rq_total::0
outbound|9080||productpage.default.svc.cluster.local::174.16.207.184:9080::health_flags::healthy
outbound|9080||productpage.default.svc.cluster.local::174.16.207.184:9080::weight::1
outbound|9080||productpage.default.svc.cluster.local::174.16.207.184:9080::region::
outbound|9080||productpage.default.svc.cluster.local::174.16.207.184:9080::zone::
outbound|9080||productpage.default.svc.cluster.local::174.16.207.184:9080::sub_zone::
outbound|9080||productpage.default.svc.cluster.local::174.16.207.184:9080::canary::false
outbound|9080||productpage.default.svc.cluster.local::174.16.207.184:9080::success_rate::-1
outbound|9080|v1|productpage.default.svc.cluster.local::default_priority::max_connections::1024
outbound|9080|v1|productpage.default.svc.cluster.local::default_priority::max_pending_requests::1024
outbound|9080|v1|productpage.default.svc.cluster.local::default_priority::max_requests::1024
outbound|9080|v1|productpage.default.svc.cluster.local::default_priority::max_retries::3
outbound|9080|v1|productpage.default.svc.cluster.local::high_priority::max_connections::1024
outbound|9080|v1|productpage.default.svc.cluster.local::high_priority::max_pending_requests::1024
outbound|9080|v1|productpage.default.svc.cluster.local::high_priority::max_requests::1024
outbound|9080|v1|productpage.default.svc.cluster.local::high_priority::max_retries::3
outbound|9080|v1|productpage.default.svc.cluster.local::added_via_api::true
outbound|9080|v1|productpage.default.svc.cluster.local::174.16.135.210:9080::cx_active::0
outbound|9080|v1|productpage.default.svc.cluster.local::174.16.135.210:9080::cx_connect_fail::0
outbound|9080|v1|productpage.default.svc.cluster.local::174.16.135.210:9080::cx_total::0
outbound|9080|v1|productpage.default.svc.cluster.local::174.16.135.210:9080::rq_active::0
outbound|9080|v1|productpage.default.svc.cluster.local::174.16.135.210:9080::rq_error::0
outbound|9080|v1|productpage.default.svc.cluster.local::174.16.135.210:9080::rq_success::0
outbound|9080|v1|productpage.default.svc.cluster.local::174.16.135.210:9080::rq_timeout::0
outbound|9080|v1|productpage.default.svc.cluster.local::174.16.135.210:9080::rq_total::0
outbound|9080|v1|productpage.default.svc.cluster.local::174.16.135.210:9080::health_flags::healthy
outbound|9080|v1|productpage.default.svc.cluster.local::174.16.135.210:9080::weight::1
outbound|9080|v1|productpage.default.svc.cluster.local::174.16.135.210:9080::region::
outbound|9080|v1|productpage.default.svc.cluster.local::174.16.135.210:9080::zone::
outbound|9080|v1|productpage.default.svc.cluster.local::174.16.135.210:9080::sub_zone::
outbound|9080|v1|productpage.default.svc.cluster.local::174.16.135.210:9080::canary::false
outbound|9080|v1|productpage.default.svc.cluster.local::174.16.135.210:9080::success_rate::-1
outbound|9080|v1|productpage.default.svc.cluster.local::174.16.207.184:9080::cx_active::0
outbound|9080|v1|productpage.default.svc.cluster.local::174.16.207.184:9080::cx_connect_fail::0
outbound|9080|v1|productpage.default.svc.cluster.local::174.16.207.184:9080::cx_total::0
outbound|9080|v1|productpage.default.svc.cluster.local::174.16.207.184:9080::rq_active::0
outbound|9080|v1|productpage.default.svc.cluster.local::174.16.207.184:9080::rq_error::0
outbound|9080|v1|productpage.default.svc.cluster.local::174.16.207.184:9080::rq_success::0
outbound|9080|v1|productpage.default.svc.cluster.local::174.16.207.184:9080::rq_timeout::0
outbound|9080|v1|productpage.default.svc.cluster.local::174.16.207.184:9080::rq_total::0
outbound|9080|v1|productpage.default.svc.cluster.local::174.16.207.184:9080::health_flags::healthy
outbound|9080|v1|productpage.default.svc.cluster.local::174.16.207.184:9080::weight::1
outbound|9080|v1|productpage.default.svc.cluster.local::174.16.207.184:9080::region::
outbound|9080|v1|productpage.default.svc.cluster.local::174.16.207.184:9080::zone::
outbound|9080|v1|productpage.default.svc.cluster.local::174.16.207.184:9080::sub_zone::
outbound|9080|v1|productpage.default.svc.cluster.local::174.16.207.184:9080::canary::false
outbound|9080|v1|productpage.default.svc.cluster.local::174.16.207.184:9080::success_rate::-1
As you can see, the old IP 174.16.207.184 is still there, therefore resulting in getting one 503 every two invocations to the productpage.
As usual, just patching either the service or pilot itself does the trick:
# kubectl edit svc productpage <--- Simply added a label to force a refresh of the service.
service/productpage edited

# kubectl exec -ti productpage-v1-77758fb579-srwqj -c istio-proxy -- curl localhost:15000/clusters|grep productpage

outbound|9080||productpage.default.svc.cluster.local::default_priority::max_connections::1024
outbound|9080||productpage.default.svc.cluster.local::default_priority::max_pending_requests::1024
outbound|9080||productpage.default.svc.cluster.local::default_priority::max_requests::1024
outbound|9080||productpage.default.svc.cluster.local::default_priority::max_retries::3
outbound|9080||productpage.default.svc.cluster.local::high_priority::max_connections::1024
outbound|9080||productpage.default.svc.cluster.local::high_priority::max_pending_requests::1024
outbound|9080||productpage.default.svc.cluster.local::high_priority::max_requests::1024
outbound|9080||productpage.default.svc.cluster.local::high_priority::max_retries::3
outbound|9080||productpage.default.svc.cluster.local::added_via_api::true
outbound|9080||productpage.default.svc.cluster.local::174.16.135.210:9080::cx_active::0
outbound|9080||productpage.default.svc.cluster.local::174.16.135.210:9080::cx_connect_fail::0
outbound|9080||productpage.default.svc.cluster.local::174.16.135.210:9080::cx_total::0
outbound|9080||productpage.default.svc.cluster.local::174.16.135.210:9080::rq_active::0
outbound|9080||productpage.default.svc.cluster.local::174.16.135.210:9080::rq_error::0
outbound|9080||productpage.default.svc.cluster.local::174.16.135.210:9080::rq_success::0
outbound|9080||productpage.default.svc.cluster.local::174.16.135.210:9080::rq_timeout::0
outbound|9080||productpage.default.svc.cluster.local::174.16.135.210:9080::rq_total::0
outbound|9080||productpage.default.svc.cluster.local::174.16.135.210:9080::health_flags::healthy
outbound|9080||productpage.default.svc.cluster.local::174.16.135.210:9080::weight::1
outbound|9080||productpage.default.svc.cluster.local::174.16.135.210:9080::region::
outbound|9080||productpage.default.svc.cluster.local::174.16.135.210:9080::zone::
outbound|9080||productpage.default.svc.cluster.local::174.16.135.210:9080::sub_zone::
outbound|9080||productpage.default.svc.cluster.local::174.16.135.210:9080::canary::false
outbound|9080||productpage.default.svc.cluster.local::174.16.135.210:9080::success_rate::-1
outbound|9080|v1|productpage.default.svc.cluster.local::default_priority::max_connections::1024
outbound|9080|v1|productpage.default.svc.cluster.local::default_priority::max_pending_requests::1024
outbound|9080|v1|productpage.default.svc.cluster.local::default_priority::max_requests::1024
outbound|9080|v1|productpage.default.svc.cluster.local::default_priority::max_retries::3
outbound|9080|v1|productpage.default.svc.cluster.local::high_priority::max_connections::1024
outbound|9080|v1|productpage.default.svc.cluster.local::high_priority::max_pending_requests::1024
outbound|9080|v1|productpage.default.svc.cluster.local::high_priority::max_requests::1024
outbound|9080|v1|productpage.default.svc.cluster.local::high_priority::max_retries::3
outbound|9080|v1|productpage.default.svc.cluster.local::added_via_api::true
outbound|9080|v1|productpage.default.svc.cluster.local::174.16.135.210:9080::cx_active::0
outbound|9080|v1|productpage.default.svc.cluster.local::174.16.135.210:9080::cx_connect_fail::0
outbound|9080|v1|productpage.default.svc.cluster.local::174.16.135.210:9080::cx_total::0
outbound|9080|v1|productpage.default.svc.cluster.local::174.16.135.210:9080::rq_active::0
outbound|9080|v1|productpage.default.svc.cluster.local::174.16.135.210:9080::rq_error::0
outbound|9080|v1|productpage.default.svc.cluster.local::174.16.135.210:9080::rq_success::0
outbound|9080|v1|productpage.default.svc.cluster.local::174.16.135.210:9080::rq_timeout::0
outbound|9080|v1|productpage.default.svc.cluster.local::174.16.135.210:9080::rq_total::0
outbound|9080|v1|productpage.default.svc.cluster.local::174.16.135.210:9080::health_flags::healthy
outbound|9080|v1|productpage.default.svc.cluster.local::174.16.135.210:9080::weight::1
outbound|9080|v1|productpage.default.svc.cluster.local::174.16.135.210:9080::region::
outbound|9080|v1|productpage.default.svc.cluster.local::174.16.135.210:9080::zone::
outbound|9080|v1|productpage.default.svc.cluster.local::174.16.135.210:9080::sub_zone::
outbound|9080|v1|productpage.default.svc.cluster.local::174.16.135.210:9080::canary::false
outbound|9080|v1|productpage.default.svc.cluster.local::174.16.135.210:9080::success_rate::-1
Also double-checked the RBAC permissions for the pilot just in case, but they allow it to be notified of changes in either pods, endpoints or services:
- apiGroups: [""]
  resources: ["endpoints", "pods", "services"]
  verbs: ["get", "list", "watch"]
To me, this is definitively not production-ready, and I would like to get in touch with people or organizations that claim to be using this in production to understand why it doesn't work for me with the simplest example (I've been trying out Istio since v0.1 and never found it ready, unfortunately).
emedina
on 8 Dec 2018
Hey,
What version are you doing that testing on? What you just described feels
like the 1.0.2 bug which is now fixed?
FYI I lead the infrastructure team at AutoTrader and we use Istio in
production (1.04) with circa 135 services.
Karl
On Sat, 8 Dec 2018, 1:53 pm Enrique Medina Montenegro <
[email protected] wrote:
I could reproduce again the issue of the pilot not properly handling the
restart of one of my pods and still keeping the old IP by using the
bookinfo application.kubectl get all -owide
NAME READY STATUS RESTARTS AGE IP NODE NOMINATED NODE
pod/curl-74f57bfd66-7wlhs 1/1 Running 0 4d 174.16.32.124 orhlp-dck015
pod/details-v1-6764bbc7f7-xc5cc 2/2 Running 0 2d 174.16.32.112 orhlp-dck015
pod/nfs-busybox-7fd4f7fdd8-vcrlq 1/1 Running 0 19d 174.16.32.121 orhlp-dck015
pod/productpage-v1-54b8b9f55-vmhfm 2/2 Terminating 0 2d 174.16.207.184 orhlp-dck011
pod/productpage-v1-77758fb579-srwqj 0/2 PodInitializing 0 23s 174.16.135.210 ochlp-dck018
pod/ratings-v1-7bc85949-28q5f 2/2 Running 0 2d 174.16.32.74 orhlp-dck015
pod/reviews-v1-fdbf674bb-kfmw4 2/2 Running 0 2d 174.16.32.120 orhlp-dck015
pod/reviews-v2-5bdc5877d6-967bp 2/2 Running 0 2d 174.16.135.217 ochlp-dck018
pod/reviews-v3-dd846cc78-qhpgj 2/2 Running 0 2h 174.16.186.67 orhlp-dck017NAME TYPE CLUSTER-IP EXTERNAL-IP PORT(S) AGE SELECTOR
service/details ClusterIP 174.20.170.1279080/TCP 2d app=details
service/kubernetes ClusterIP 174.20.0.1443/TCP 21d
service/productpage ClusterIP 174.20.178.1439080/TCP 2d app=productpage
service/ratings ClusterIP 174.20.123.1079080/TCP 2d app=ratings
service/reviews ClusterIP 174.20.1.2159080/TCP 2d app=reviews Notice above that the old pod (productpage-v1-54b8b9f55-vmhfm) had an IP
174.16.207.184 and the new one (productpage-v1-77758fb579-srwqj) is
174.16.135.210. However, when I query the clusters endpoint from the
sidecar proxy inside the new pod:kubectl exec -ti productpage-v1-77758fb579-srwqj -c istio-proxy -- curl localhost:15000/clusters|grep productpage|grep outbound
outbound|9080||productpage.default.svc.cluster.local::default_priority::max_connections::1024
outbound|9080||productpage.default.svc.cluster.local::default_priority::max_pending_requests::1024
outbound|9080||productpage.default.svc.cluster.local::default_priority::max_requests::1024
outbound|9080||productpage.default.svc.cluster.local::default_priority::max_retries::3
outbound|9080||productpage.default.svc.cluster.local::high_priority::max_connections::1024
outbound|9080||productpage.default.svc.cluster.local::high_priority::max_pending_requests::1024
outbound|9080||productpage.default.svc.cluster.local::high_priority::max_requests::1024
outbound|9080||productpage.default.svc.cluster.local::high_priority::max_retries::3
outbound|9080||productpage.default.svc.cluster.local::added_via_api::true
outbound|9080||productpage.default.svc.cluster.local::174.16.135.210:9080::cx_active::0
outbound|9080||productpage.default.svc.cluster.local::174.16.135.210:9080::cx_connect_fail::0
outbound|9080||productpage.default.svc.cluster.local::174.16.135.210:9080::cx_total::0
outbound|9080||productpage.default.svc.cluster.local::174.16.135.210:9080::rq_active::0
outbound|9080||productpage.default.svc.cluster.local::174.16.135.210:9080::rq_error::0
outbound|9080||productpage.default.svc.cluster.local::174.16.135.210:9080::rq_success::0
outbound|9080||productpage.default.svc.cluster.local::174.16.135.210:9080::rq_timeout::0
outbound|9080||productpage.default.svc.cluster.local::174.16.135.210:9080::rq_total::0
outbound|9080||productpage.default.svc.cluster.local::174.16.135.210:9080::health_flags::healthy
outbound|9080||productpage.default.svc.cluster.local::174.16.135.210:9080::weight::1
outbound|9080||productpage.default.svc.cluster.local::174.16.135.210:9080::region::
outbound|9080||productpage.default.svc.cluster.local::174.16.135.210:9080::zone::
outbound|9080||productpage.default.svc.cluster.local::174.16.135.210:9080::sub_zone::
outbound|9080||productpage.default.svc.cluster.local::174.16.135.210:9080::canary::false
outbound|9080||productpage.default.svc.cluster.local::174.16.135.210:9080::success_rate::-1
outbound|9080||productpage.default.svc.cluster.local::174.16.207.184:9080::cx_active::0
outbound|9080||productpage.default.svc.cluster.local::174.16.207.184:9080::cx_connect_fail::0
outbound|9080||productpage.default.svc.cluster.local::174.16.207.184:9080::cx_total::0
outbound|9080||productpage.default.svc.cluster.local::174.16.207.184:9080::rq_active::0
outbound|9080||productpage.default.svc.cluster.local::174.16.207.184:9080::rq_error::0
outbound|9080||productpage.default.svc.cluster.local::174.16.207.184:9080::rq_success::0
outbound|9080||productpage.default.svc.cluster.local::174.16.207.184:9080::rq_timeout::0
outbound|9080||productpage.default.svc.cluster.local::174.16.207.184:9080::rq_total::0
outbound|9080||productpage.default.svc.cluster.local::174.16.207.184:9080::health_flags::healthy
outbound|9080||productpage.default.svc.cluster.local::174.16.207.184:9080::weight::1
outbound|9080||productpage.default.svc.cluster.local::174.16.207.184:9080::region::
outbound|9080||productpage.default.svc.cluster.local::174.16.207.184:9080::zone::
outbound|9080||productpage.default.svc.cluster.local::174.16.207.184:9080::sub_zone::
outbound|9080||productpage.default.svc.cluster.local::174.16.207.184:9080::canary::false
outbound|9080||productpage.default.svc.cluster.local::174.16.207.184:9080::success_rate::-1
outbound|9080|v1|productpage.default.svc.cluster.local::default_priority::max_connections::1024
outbound|9080|v1|productpage.default.svc.cluster.local::default_priority::max_pending_requests::1024
outbound|9080|v1|productpage.default.svc.cluster.local::default_priority::max_requests::1024
outbound|9080|v1|productpage.default.svc.cluster.local::default_priority::max_retries::3
outbound|9080|v1|productpage.default.svc.cluster.local::high_priority::max_connections::1024
outbound|9080|v1|productpage.default.svc.cluster.local::high_priority::max_pending_requests::1024
outbound|9080|v1|productpage.default.svc.cluster.local::high_priority::max_requests::1024
outbound|9080|v1|productpage.default.svc.cluster.local::high_priority::max_retries::3
outbound|9080|v1|productpage.default.svc.cluster.local::added_via_api::true
outbound|9080|v1|productpage.default.svc.cluster.local::174.16.135.210:9080::cx_active::0
outbound|9080|v1|productpage.default.svc.cluster.local::174.16.135.210:9080::cx_connect_fail::0
outbound|9080|v1|productpage.default.svc.cluster.local::174.16.135.210:9080::cx_total::0
outbound|9080|v1|productpage.default.svc.cluster.local::174.16.135.210:9080::rq_active::0
outbound|9080|v1|productpage.default.svc.cluster.local::174.16.135.210:9080::rq_error::0
outbound|9080|v1|productpage.default.svc.cluster.local::174.16.135.210:9080::rq_success::0
outbound|9080|v1|productpage.default.svc.cluster.local::174.16.135.210:9080::rq_timeout::0
outbound|9080|v1|productpage.default.svc.cluster.local::174.16.135.210:9080::rq_total::0
outbound|9080|v1|productpage.default.svc.cluster.local::174.16.135.210:9080::health_flags::healthy
outbound|9080|v1|productpage.default.svc.cluster.local::174.16.135.210:9080::weight::1
outbound|9080|v1|productpage.default.svc.cluster.local::174.16.135.210:9080::region::
outbound|9080|v1|productpage.default.svc.cluster.local::174.16.135.210:9080::zone::
outbound|9080|v1|productpage.default.svc.cluster.local::174.16.135.210:9080::sub_zone::
outbound|9080|v1|productpage.default.svc.cluster.local::174.16.135.210:9080::canary::false
outbound|9080|v1|productpage.default.svc.cluster.local::174.16.135.210:9080::success_rate::-1
outbound|9080|v1|productpage.default.svc.cluster.local::174.16.207.184:9080::cx_active::0
outbound|9080|v1|productpage.default.svc.cluster.local::174.16.207.184:9080::cx_connect_fail::0
outbound|9080|v1|productpage.default.svc.cluster.local::174.16.207.184:9080::cx_total::0
outbound|9080|v1|productpage.default.svc.cluster.local::174.16.207.184:9080::rq_active::0
outbound|9080|v1|productpage.default.svc.cluster.local::174.16.207.184:9080::rq_error::0
outbound|9080|v1|productpage.default.svc.cluster.local::174.16.207.184:9080::rq_success::0
outbound|9080|v1|productpage.default.svc.cluster.local::174.16.207.184:9080::rq_timeout::0
outbound|9080|v1|productpage.default.svc.cluster.local::174.16.207.184:9080::rq_total::0
outbound|9080|v1|productpage.default.svc.cluster.local::174.16.207.184:9080::health_flags::healthy
outbound|9080|v1|productpage.default.svc.cluster.local::174.16.207.184:9080::weight::1
outbound|9080|v1|productpage.default.svc.cluster.local::174.16.207.184:9080::region::
outbound|9080|v1|productpage.default.svc.cluster.local::174.16.207.184:9080::zone::
outbound|9080|v1|productpage.default.svc.cluster.local::174.16.207.184:9080::sub_zone::
outbound|9080|v1|productpage.default.svc.cluster.local::174.16.207.184:9080::canary::false
outbound|9080|v1|productpage.default.svc.cluster.local::174.16.207.184:9080::success_rate::-1As you can see, the old IP 174.16.207.184 is still there, therefore
resulting in getting one 503 every two invocations to the productpage.As usual, just patching either the service or pilot itself does the trick:
kubectl edit svc productpage <--- Simply added a label to force a refresh of the service.
service/productpage edited
kubectl exec -ti productpage-v1-77758fb579-srwqj -c istio-proxy -- curl localhost:15000/clusters|grep productpage
outbound|9080||productpage.default.svc.cluster.local::default_priority::max_connections::1024
outbound|9080||productpage.default.svc.cluster.local::default_priority::max_pending_requests::1024
outbound|9080||productpage.default.svc.cluster.local::default_priority::max_requests::1024
outbound|9080||productpage.default.svc.cluster.local::default_priority::max_retries::3
outbound|9080||productpage.default.svc.cluster.local::high_priority::max_connections::1024
outbound|9080||productpage.default.svc.cluster.local::high_priority::max_pending_requests::1024
outbound|9080||productpage.default.svc.cluster.local::high_priority::max_requests::1024
outbound|9080||productpage.default.svc.cluster.local::high_priority::max_retries::3
outbound|9080||productpage.default.svc.cluster.local::added_via_api::true
outbound|9080||productpage.default.svc.cluster.local::174.16.135.210:9080::cx_active::0
outbound|9080||productpage.default.svc.cluster.local::174.16.135.210:9080::cx_connect_fail::0
outbound|9080||productpage.default.svc.cluster.local::174.16.135.210:9080::cx_total::0
outbound|9080||productpage.default.svc.cluster.local::174.16.135.210:9080::rq_active::0
outbound|9080||productpage.default.svc.cluster.local::174.16.135.210:9080::rq_error::0
outbound|9080||productpage.default.svc.cluster.local::174.16.135.210:9080::rq_success::0
outbound|9080||productpage.default.svc.cluster.local::174.16.135.210:9080::rq_timeout::0
outbound|9080||productpage.default.svc.cluster.local::174.16.135.210:9080::rq_total::0
outbound|9080||productpage.default.svc.cluster.local::174.16.135.210:9080::health_flags::healthy
outbound|9080||productpage.default.svc.cluster.local::174.16.135.210:9080::weight::1
outbound|9080||productpage.default.svc.cluster.local::174.16.135.210:9080::region::
outbound|9080||productpage.default.svc.cluster.local::174.16.135.210:9080::zone::
outbound|9080||productpage.default.svc.cluster.local::174.16.135.210:9080::sub_zone::
outbound|9080||productpage.default.svc.cluster.local::174.16.135.210:9080::canary::false
outbound|9080||productpage.default.svc.cluster.local::174.16.135.210:9080::success_rate::-1
outbound|9080|v1|productpage.default.svc.cluster.local::default_priority::max_connections::1024
outbound|9080|v1|productpage.default.svc.cluster.local::default_priority::max_pending_requests::1024
outbound|9080|v1|productpage.default.svc.cluster.local::default_priority::max_requests::1024
outbound|9080|v1|productpage.default.svc.cluster.local::default_priority::max_retries::3
outbound|9080|v1|productpage.default.svc.cluster.local::high_priority::max_connections::1024
outbound|9080|v1|productpage.default.svc.cluster.local::high_priority::max_pending_requests::1024
outbound|9080|v1|productpage.default.svc.cluster.local::high_priority::max_requests::1024
outbound|9080|v1|productpage.default.svc.cluster.local::high_priority::max_retries::3
outbound|9080|v1|productpage.default.svc.cluster.local::added_via_api::true
outbound|9080|v1|productpage.default.svc.cluster.local::174.16.135.210:9080::cx_active::0
outbound|9080|v1|productpage.default.svc.cluster.local::174.16.135.210:9080::cx_connect_fail::0
outbound|9080|v1|productpage.default.svc.cluster.local::174.16.135.210:9080::cx_total::0
outbound|9080|v1|productpage.default.svc.cluster.local::174.16.135.210:9080::rq_active::0
outbound|9080|v1|productpage.default.svc.cluster.local::174.16.135.210:9080::rq_error::0
outbound|9080|v1|productpage.default.svc.cluster.local::174.16.135.210:9080::rq_success::0
outbound|9080|v1|productpage.default.svc.cluster.local::174.16.135.210:9080::rq_timeout::0
outbound|9080|v1|productpage.default.svc.cluster.local::174.16.135.210:9080::rq_total::0
outbound|9080|v1|productpage.default.svc.cluster.local::174.16.135.210:9080::health_flags::healthy
outbound|9080|v1|productpage.default.svc.cluster.local::174.16.135.210:9080::weight::1
outbound|9080|v1|productpage.default.svc.cluster.local::174.16.135.210:9080::region::
outbound|9080|v1|productpage.default.svc.cluster.local::174.16.135.210:9080::zone::
outbound|9080|v1|productpage.default.svc.cluster.local::174.16.135.210:9080::sub_zone::
outbound|9080|v1|productpage.default.svc.cluster.local::174.16.135.210:9080::canary::false
outbound|9080|v1|productpage.default.svc.cluster.local::174.16.135.210:9080::success_rate::-1Also double-checked the RBAC permissions for the pilot just in case, but
they allow it to be notified of changes in either pods, endpoints or
services:
- apiGroups: [""]
resources: ["endpoints", "pods", "services"]
verbs: ["get", "list", "watch"]To me, this is definitively not production-ready, and I would like to get
in touch with people or organizations that claim to be using this in
production to understand why it doesn't work for me with the simplest
example (I've been trying out Istio since v0.1 and never found it ready,
unfortunately).—
You are receiving this because you were mentioned.
Reply to this email directly, view it on GitHub
https://github.com/istio/istio/issues/7665#issuecomment-445460885, or mute
the thread
https://github.com/notifications/unsubscribe-auth/ABavibKZSGuNiRkJjRtCqEIF7JOQcyMmks5u28RQgaJpZM4Vwg1y
.
Stono
on 8 Dec 2018
Are you using Istio 1.0.4 ? And you didn't use the istioctl proxy-status command (which is known to expose a bug - fixed in the upcoming 1.0.5) ?
I understand your concern - but 'production-ready' doesn't always mean bug free (or we would never run anything in production). For almost all prod launches I've worked on, some bugs were found and it takes
few iterations to get rid of them. What is important to me is to prioritize prod-related bugs and find fixes or workaround quickly.
One problem we have with Istio is that we rely a lot on automated testing - plus some semi-automated stability and perf testing. Most Istio developers are not 'on-call' for a large production system. @Stono
has been a critical help - but we need more people who can run pre-release builds on a realistic staging environment and provide actionable data.
What works very well in Google is running all releases on staging and canary - and in some cases long-running 'experiments' and 'dogfood' - before cutting the official prod. Unfortunately we don't have that yet, there are few efforts in progress to fix it.
costinm
on 8 Dec 2018
For what it's worth by the way for people questioning it not being "production ready".
One one of my (1.0.4) clusters which has 135 services, we have handled 12,790,459 requests in the last day (sum(increase(istio_requests_total{reporter="destination"}[1d])))
Of those, 535 were recorded as 503s (sum(increase(istio_requests_total{reporter="destination", response_code="503"}[1d])) by (source_app, destination_app) > 0), so an overall error rate of 0.004%, with only 6 combinations of source and destination actually recording any 503s.
{destination_app="gradle-cache",source_app="ingress-nginx-internal"} | 1.0001976993565997
{destination_app="vehicle-metric-service",source_app="auction-profiler-service"} | 4.003130575176589
{destination_app="vehicle-metric-service",source_app="sourcing-api"} | 2.000458646909729
{destination_app="vehicle-metric-service",source_app="ingress-nginx-internal"} | 39.00544190258205
{destination_app="build-status",source_app="ingress-nginx-internal"} | 481.0675197636025
{destination_app="vehicle-valuations-service",source_app="vehicle-metric-service"} | 8.001203254643215
Now bear in mind that these stats will include requests which have been retried using the x-retry-on policy in envoy. What you're interested in is actual client facing errors. We use ingress-nginx as an edge gateway so can query that too:
sum(increase(nginx_ingress_controller_requests{status="503"}[1d])) by (ingress) > 0
As you can see there was only a single service reporting 503's being returned to the client. These 503's are actually nothing to do with envoy/istio either, it's a known flakey application.
{ingress="build-status-internal"} | 2997.5204028477165
So yeah, there are some underlying improvements that can and will be worked on, as a customer who has worked with the Istio team closely for the last 6 months I have every faith that it'll continue to improve. You also need to ask yourself if you'd even have the visibility into your applications to see 0.004% error rate across a 135 micro service architecture so easily without Istio? Probably not, at least - we didn't have that level of visibility before.
So do I think istio is "production ready", absolutely - we use it. Do I think it's perfect? No, I'm yet to find any software that is.
Stono
on 8 Dec 2018
@costinm Yes, I'm not expecting a 0 bugs software, of course, just expressing my frustration about not having yet been able to run Istio in my PROD due to the issues already discussed in this thread due to the serious impact they would have had in my specific use cases. I've been betting for Istio since the very beginning (find my name in Google Groups, for reference) and I'm a strong believer that this is the definitive service mesh we need, but somehow I always run into a blocking issue once I try to deploy in PROD. But be sure I'll keep on trying. And let me know if I can help in testing here.
@Stono Thanks so much for throwing in such a proof of trust here, so I have better evidence than self practice to keep pushing about Istio in my organization (yes, I also have bosses who want clear evidence about the reliability of any tool I deploy in our PROD cluster ;-))
Also I applied your re-balance script and now pilot seems to be balanced:
pilot_xds{instance="174.16.127.180:9093",job="pilot"} | 63
pilot_xds{instance="174.16.138.140:9093",job="pilot"} | 54
pilot_xds{instance="174.16.191.200:9093",job="pilot"} | 50
pilot_xds{instance="174.16.241.253:9093",job="pilot"} | 46
pilot_xds{instance="174.16.78.102:9093",job="pilot"} | 75
Keep in mind, many of us experience much higher error rates than 0.004%
with no explanation as to the cause. I'm still hopeful it'll get worked
out, but my simple tests (basically scaling up bookinfo) produce a large
numbers of 503s -- and other users have confirmed the results. It works for
clusters of a certain size but once you hit some thresholds it sorta' falls
apart, so I definitely understand the skepticism around production-ready.
On Sun, Dec 9, 2018 at 5:26 AM Enrique Medina Montenegro <
[email protected]> wrote:
@costinm https://github.com/costinm Yes, I'm not expecting a 0 bugs
software, of course, just expressing my frustration about no having yet
been able to run Istio in my PROD due to the issues already discussed in
this thread due to the serious impact they would have had in my specific
use cases. I've been betting for Istio since the very beginning (find my
name in Google Groups, for reference) and I'm a strong believer that this
is the definitive service mesh we need, but somehow I always run into a
blocking issue once I try to deploy in PROD. But be sure I'll keep on
trying. And let me know if I can help in testing here.@Stono https://github.com/Stono Thanks so much for throwing in such a
proof of trust here, so I have better evidence than self practice to keep
pushing about Istio in my organization (yes, I also have bosses who want
clear evidence about the reliability of any tool I deploy iin our PROD
cluster ;-))—
You are receiving this because you are subscribed to this thread.
Reply to this email directly, view it on GitHub
https://github.com/istio/istio/issues/7665#issuecomment-445525810, or mute
the thread
https://github.com/notifications/unsubscribe-auth/ALnFDHKVyrMUEq1TObytxwpFNIpClUpeks5u3OVLgaJpZM4Vwg1y
.
 jaygorrell
on 9 Dec 2018
jaygorrell
on 9 Dec 2018
@jaygorrell it would be great if you could update this thread with logs and findings please, to help the istio folk debug. As another user I'm also interested to see your findings
Stono
on 9 Dec 2018
All of my findings as I've been going along are documented in
https://github.com/istio/istio/issues/9043
On Sun, Dec 9, 2018 at 9:41 AM Karl Stoney notifications@github.com wrote:
@jaygorrell https://github.com/jaygorrell it would be great if you
could update this thread with logs and findings please, to help the istio
folk debug. As another user I'm also interested to see your findings—
You are receiving this because you were mentioned.
Reply to this email directly, view it on GitHub
https://github.com/istio/istio/issues/7665#issuecomment-445543396, or mute
the thread
https://github.com/notifications/unsubscribe-auth/ALnFDGY6LRgPB_IWg5e-6-3I9ifPUyMcks5u3SEkgaJpZM4Vwg1y
.
jaygorrell
on 9 Dec 2018
Brill, ta. I will have a read
On Sun, 9 Dec 2018, 2:43 pm Jay Gorrell <[email protected] wrote:
All of my findings as I've been going along are documented in
https://github.com/istio/istio/issues/9043On Sun, Dec 9, 2018 at 9:41 AM Karl Stoney notifications@github.com
wrote:@jaygorrell https://github.com/jaygorrell it would be great if you
could update this thread with logs and findings please, to help the istio
folk debug. As another user I'm also interested to see your findings—
You are receiving this because you were mentioned.
Reply to this email directly, view it on GitHub
https://github.com/istio/istio/issues/7665#issuecomment-445543396, or
mute
the thread
<
https://github.com/notifications/unsubscribe-auth/ALnFDGY6LRgPB_IWg5e-6-3I9ifPUyMcks5u3SEkgaJpZM4Vwg1y.
—
You are receiving this because you were mentioned.
Reply to this email directly, view it on GitHub
https://github.com/istio/istio/issues/7665#issuecomment-445543513, or mute
the thread
https://github.com/notifications/unsubscribe-auth/ABaviWLCv1BI4T8zL8_h8UyUsKKshYIjks5u3SGGgaJpZM4Vwg1y
.
Stono
on 9 Dec 2018
https://github.com/istio/istio/pull/10420 may decrease 503s in some degree
hzxuzhonghu
on 12 Dec 2018
As of 1.0.5 version I no longer see 503 errors when scaling down my applications or when deleting a random pod. However, when rolling out a new application version the deployment file must have readiness and liveness probes configured in order to avoid downtime.
 Stocco
on 26 Dec 2018
Stocco
on 26 Dec 2018
I cannot reproduce the issue in 1.1-snaptshot as well. The application has liveness and readiness configured.
 iandyh
on 9 Jan 2019
iandyh
on 9 Jan 2019
@Stocco @iandyh thanks for the update.
Quick update on my end, I have a PR out for review that should even further reduce the likelihood of encountering 503s during pod churn: https://github.com/istio/istio/pull/10566
The main thing that this PR does is to apply a reasonable default retry policy to outbound clusters.
As a part of this PR, I added an e2e test to cause 503s by churning pods. I expected the new default to resolve the 503s, but I saw little improvement. Digging further, I found a couple things that were limiting the performance of the retry policy:
- Envoy's circuit breaker threshold
max_retries: By default,max_retriesis set to 3 in Envoy, meaning that only 3 clients can be performing a retry on the same cluster concurrently, beyond that the circuit breaker itself will cause 503s. My e2e test was running > 3 clients against the same Envoy/outbound cluster ... so this was a problem for the test and would likely be a real problem in production. I modified this PR to also provide a reasonable value formax_retriesby default. - When shutting down pods, I was occasionally encountering Envoy disconnect reason
connection-termination. The Envoy logic only handlesconnection-failed, so these will still propagate back to the client as 503s. I discussed with @PiotrSikora and we think the correct way to handle these cases is with graceful shutdown (i.e. lame-ducking) of Envoy, but that won't land in time for 1.1. Fortunately, in my testing, these accounted for a small portion of the overall 503s I was seeing, so I think it's something we can live with for now.
The PR is basically ready to go ... I just need to do some final testing and cleanup. It will definitely be in 1.1.
nmittler
on 11 Jan 2019
@Stono Thanks for the effort.
Speaking of retry, since Envoy really confuses me with connection error/timeout, I don't know whether retry will have impact on non-idempotent requests. In Nginx world, you can define what errors the retry will be performed. In Envoy/istio, it only says timeout. But connection timeout is different than application timeout.
From my understanding, if the pod is created carefully with liveness/readiness and terminationGracePeriodSeconds configured, 503 should never be encountered unless it's a persistent connection or the requests takes long than terminationGracePeriodSeconds to be processed.
iandyh
on 15 Jan 2019
Connection timeout (connectTimeout) in Envoy/Istio(?) is configurable on a per-cluster basis, and it's 10s by default in Istio. In this case, request wasn't sent, so it's safe to retry.
Retry policy (numRetries, retryOn, perTryTimeout, etc) in Envoy/Istio is configurable on per-route basis, and the default retry policy that @nmittler is adding in #10566 retries only on the connection failures and refused streams. In this case, request either wasn't sent, or it was and it was actively rejected by the peer, so again, it's safe to retry. If you configure other retryOn conditions, then it's up to you to make sure that those conditions are safe to retry for your application.
Separately, the timeout setting applies to the total request/retries/response cycle, not only connection establishment, and requests (even those still sending data) will be terminated once this timeout is reached.
Hope this helps!
PiotrSikora
on 15 Jan 2019
@PiotrSikora Thanks for the clarification. Things are getting much clearer than before.
Right now, unfortunately istio does not expose retryOn condition. ref: https://github.com/istio/old_issues_repo/issues/235
iandyh
on 15 Jan 2019
FYI #10566 has landed and will be included in 1.1.
nmittler
on 25 Jan 2019
@nmittler can this be closed?
 munrodg
on 27 Feb 2019
munrodg
on 27 Feb 2019
I think so
hzxuzhonghu
on 27 Feb 2019
Any reason Istio doesn't plan to incorporate Envoy active health checks? I don't think there's any reason to keep an unhealthy endpoint in the load balancing pool.
ayushpateria
on 27 Feb 2019
For anyone arriving here with similar issues in 1.1.x, I've opened a new issue: https://github.com/istio/istio/issues/13616
jaygorrell
on 26 Apr 2019
Related issues
 oaktowner
·
73Comments
Stono
·
65Comments
oaktowner
·
73Comments
Stono
·
65Comments
 fhoy
·
139Comments
Stono
·
65Comments
fhoy
·
139Comments
Stono
·
65Comments
 prune998
·
65Comments
prune998
·
65Comments
Most helpful comment
We are facing the same problem as well - whenever there is a pod restart, there is a spike in 503 responses on our gateway. Our gateway communicates with all the services using gRPC, and the retry solution above also doesn't seem to work.
@rshriram Does HTTPRetry work with gRPC services?