Istio: Istio instanced traces don't appear to be valid
Consider the following application flow:
service-a -> service-b -> service-c -> service-d
When we just rely on istio to start traces, we only ever see single traces (a->b, b->c, or c->d), we never see a->b->c->d in Jaeger. B is correctly forwarding the trace headers to C, and C to D.
Digging into this a little more, it looks like envoy is not correctly setting up the trace and the span. If I dump out the headers on service-b, you can see the only these tracing related headers that were added by envoy on service A.
"x-b3-traceid": "fcb5121ea0e8d5fc",
"x-b3-spanid": "fcb5121ea0e8d5fc",
"x-request-id": "740751d64d2d1ef9e328cc43e60e97fd"
I find it very odd that the traceid and spanid here are the same.
If I don't rely on istio to instantiate the trace, and a zipkin library in service-a to correctly instantiate a trace and span, and dump the headers in service b, I see:
"x-b3-traceid": "b00fe06a1b060c67",
"x-b3-spanid": "3f0783fb8b035aa4",
"x-b3-parentspanid": "564c4c8ee127f144",
"x-b3-flags": "0",
"x-request-id": "fbf97ddb-4728-9639-ad46-fe6ed86029d2"
Having service A instantiate the trace in this manner correctly gives me an a->b->c->d trace in Jaeger.
Obviously we don't want to have to do this, the whole idea is to have istio instantiate traces when they're not present rather than rely on client libraries in the applications.
 Stono
Stono
All 65 comments
I'm guessing in your example https://istio.io/docs/tasks/telemetry/distributed-tracing/, you have the ingress gateway start the trace, in my example we do not have an ingress gateway as the request is starting intra-mesh.
Stono
on 12 Feb 2019
@Stono you are correct in your understanding of the tracing task that we send requests via the ingressgateway. but i don't believe that is a strict requirement. the gateway is just a differently configured version the same proxy image.
How are you forwarding the headers exactly? Are you using a library or doing it manually?
 douglas-reid
on 12 Feb 2019
douglas-reid
on 12 Feb 2019
Doing it manually mate.
But as I say it works fine when we use a third party component to start the
trace.
The headers I show you above where the spanid and traceid are the same is a
dump from service B, before we forward anything to C. So they're what has
been generated by proxy either on the way out of A, or on the way in to B.
On Tue, 12 Feb 2019, 10:51 pm Douglas Reid <[email protected] wrote:
@Stono https://github.com/Stono you are correct in your understanding
of the tracing task that we send requests via the ingressgateway. but i
don't believe that is a strict requirement. the gateway is just a
differently configured version the same proxy image.How are you forwarding the headers exactly? Are you using a library or
doing it manually?—
You are receiving this because you were mentioned.
Reply to this email directly, view it on GitHub
https://github.com/istio/istio/issues/11696#issuecomment-462971209, or mute
the thread
https://github.com/notifications/unsubscribe-auth/ABavicKF1VtyVeS6rxYYw66g51K5nBfvks5vM0WIgaJpZM4a2ff_
.
Stono
on 12 Feb 2019
It should be easy to reproduce. Simply spin two services up on a cluster
(no ingress gateway), make the second service a headers echo server.
Exec into the first and curl the second to see the header dump and you'll
see it doesn't contain the correct set of headers for a instantiated trace.
Karl
On Tue, 12 Feb 2019, 10:54 pm Karl Stoney <[email protected] wrote:
Doing it manually mate.
But as I say it works fine when we use a third party component to start
the trace.The headers I show you above where the spanid and traceid are the same is
a dump from service B, before we forward anything to C. So they're what
has been generated by proxy either on the way out of A, or on the way in to
B.On Tue, 12 Feb 2019, 10:51 pm Douglas Reid <[email protected]
wrote:@Stono https://github.com/Stono you are correct in your understanding
of the tracing task that we send requests via the ingressgateway. but i
don't believe that is a strict requirement. the gateway is just a
differently configured version the same proxy image.How are you forwarding the headers exactly? Are you using a library or
doing it manually?—
You are receiving this because you were mentioned.
Reply to this email directly, view it on GitHub
https://github.com/istio/istio/issues/11696#issuecomment-462971209, or mute
the thread
https://github.com/notifications/unsubscribe-auth/ABavicKF1VtyVeS6rxYYw66g51K5nBfvks5vM0WIgaJpZM4a2ff_
.
Stono
on 13 Feb 2019
Any thoughts @douglas-reid ? We currently can't use tracing for requests unless they entire via our edge, which is only a fraction
Stono
on 13 Feb 2019
@Stono I haven't had time to try this out yet. I'll try today and see if I can provide more insight.
douglas-reid
on 14 Feb 2019
@Stono was this with 1.1 snapshots (or tip) or a 1.0.X release (just so I'm not testing something different)? It looks like 1.0.X, based on the 64bit traceids.
douglas-reid
on 14 Feb 2019
@Stono I cannot repro this issue. Here's what I'm doing:
- deployed Istio 1.0.6 from release via helm template:
helm template install/kubernetes/helm/istio --name istio --namespace istio-system --set tracing.enabled=true --set tracing.jaeger.enabled=true > $HOME/istio-1.0.6.yaml
- labeled the default namespace for automatic injection
- deployed everyone's favorite bookinfo sample
$ kubectl get pods
NAME                             READY     STATUS    RESTARTS   AGE
details-v1-6764bbc7f7-96vs5      2/2       Running   0          18m
productpage-v1-54b8b9f55-g25jf   2/2       Running   0          18m
ratings-v1-7bc85949-wwctb        2/2       Running   0          18m
reviews-v1-fdbf674bb-m4rch       2/2       Running   0          18m
reviews-v2-5bdc5877d6-lwjtb      2/2       Running   0          18m
reviews-v3-dd846cc78-r8z22       2/2       Running   0          18m
- created a new namespace (
fortio) and deployed the fortio server there (without fronting proxy), via:
```apiVersion: apps/v1beta1
kind: Deployment
metadata:
name: fortio-server
spec:
replicas: 1
template:
metadata:
labels:
app: fortio-server
version: v1
spec:
containers:
- name: fortio
image: fortio/fortio
ports:
- containerPort: 8080
- containerPort: 8079
args:
$ kubectl -n fortio get pods
NAME READY STATUS RESTARTS AGE
fortio-server-85d547bd8f-gwjfh 1/1 Running 0 16m
- using the fortio web UI to send load against productpage (100 qps for 30s)
- connecting to the Jaeger UI
`kubectl port-forward -n istio-system $(kubectl get pod -n istio-system -l app=jaeger -o jsonpath='{.items[0].metadata.name}') 16686:16686`
- see that tracing is working
- verify that the traffic is not going through ingressgateway
$ ki logs istio-ingressgateway-694576c7bb-9xc7v | grep GET
$
vs.
$ kubectl logs productpage-v1-54b8b9f55-g25jf -c istio-proxy | grep GET
[2019-02-14T19:00:37.757Z] "GET /details/0HTTP/1.1" 200 - 0 178 29 28 "-" "python-requests/2.18.4" "55d22cba-775e-43e3-b907-942746156a96" "details:9080" "10.36.1.16:9080" outbound|9080||details.default.svc.cluster.local - 10.39.253.195:9080 10.36.2.8:45562
[2019-02-14T19:00:37.794Z] "GET /reviews/0HTTP/1.1" 200 - 0 379 1155 1155 "-" "python-requests/2.18.4" "55d22cba-775e-43e3-b907-942746156a96" "reviews:9080" "10.36.2.7:9080" outbound|9080||reviews.default.svc.cluster.local - 10.39.252.135:9080 10.36.2.8:34780
[2019-02-14T19:00:37.743Z] "GET /productpageHTTP/1.1" 200 - 0 5723 1239 1232 "-" "fortio.org/fortio-1.3.2-pre" "55d22cba-775e-43e3-b907-942746156a96" "productpage.default:9080" "127.0.0.1:9080" inbound|9080||productpage.default.svc.cluster.local - 10.36.2.8:9080 10.36.0.10:52410
[2019-02-14T19:00:38.995Z] "GET /details/0HTTP/1.1" 200 - 0 178 14 12 "-" "python-requests/2.18.4" "b4f96914-4f56-4543-bc01-2daaeafa8930" "details:9080" "10.36.1.16:9080" outbound|9080||details.default.svc.cluster.local - 10.39.253.195:9080 10.36.2.8:45584
[2019-02-14T19:00:39.013Z] "GET /reviews/0HTTP/1.1" 200 - 0 295 752 752 "-" "python-requests/2.18.4" "b4f96914-4f56-4543-bc01-2daaeafa8930" "reviews:9080" "10.36.0.9:9080" outbound|9080||reviews.default.svc.cluster.local - 10.39.252.135:9080 10.36.2.8:34802
[2019-02-14T19:00:38.988Z] "GET /productpageHTTP/1.1" 200 - 0 4415 781 778 "-" "fortio.org/fortio-1.3.2-pre" "b4f96914-4f56-4543-bc01-2daaeafa8930" "productpage.default:9080" "127.0.0.1:9080" inbound|9080||productpage.default.svc.cluster.local - 10.36.2.8:9080 10.36.0.10:52412
[2019-02-14T19:00:39.782Z] "GET /details/0HTTP/1.1" 200 - 0 178 3 3 "-" "python-requests/2.18.4" "82510458-d3a3-4c66-838d-215ad9c17a64" "details:9080" "10.36.1.16:9080" outbound|9080||details.default.svc.cluster.local - 10.39.253.195:9080 10.36.2.8:45594
[2019-02-14T19:00:39.790Z] "GET /reviews/0HTTP/1.1" 200 - 0 375 1904 1904 "-" "python-requests/2.18.4" "82510458-d3a3-4c66-838d-215ad9c17a64" "reviews:9080" "10.36.1.18:9080" outbound|9080||reviews.default.svc.cluster.local - 10.39.252.135:9080 10.36.2.8:34810
[2019-02-14T19:00:39.776Z] "GET /productpageHTTP/1.1" 200 - 0 5719 1921 1921 "-" "fortio.org/fortio-1.3.2-pre" "82510458-d3a3-4c66-838d-215ad9c17a64" "productpage.default:9080" "127.0.0.1:9080" inbound|9080||productpage.default.svc.cluster.local - 10.36.2.8:9080 10.36.0.10:52418
[2019-02-14T19:00:41.704Z] "GET /details/0HTTP/1.1" 200 - 0 178 3 3 "-" "python-requests/2.18.4" "2cf4f5e5-18a0-4d30-aaae-e92b4bbe4cee" "details:9080" "10.36.1.16:9080" outbound|9080||details.default.svc.cluster.local - 10.39.253.195:9080 10.36.2.8:45612
[2019-02-14T19:00:41.711Z] "GET /reviews/0HTTP/1.1" 200 - 0 379 29 29 "-" "python-requests/2.18.4" "2cf4f5e5-18a0-4d30-aaae-e92b4bbe4cee" "reviews:9080" "10.36.2.7:9080" outbound|9080||reviews.default.svc.cluster.local - 10.39.252.135:9080 10.36.2.8:34828
[2019-02-14T19:00:41.701Z] "GET /productpageHTTP/1.1" 200 - 0 5723 44 44 "-" "fortio.org/fortio-1.3.2-pre" "2cf4f5e5-18a0-4d30-aaae-e92b4bbe4cee" "productpage.default:9080" "127.0.0.1:9080" inbound|9080||productpage.default.svc.cluster.local - 10.36.2.8:9080 10.36.0.10:52432
[2019-02-14T19:00:41.753Z] "GET /details/0HTTP/1.1" 200 - 0 178 3 3 "-" "python-requests/2.18.4" "4e935f2a-4088-40b4-91f7-812a50a9a646" "details:9080" "10.36.1.16:9080" outbound|9080||details.default.svc.cluster.local - 10.39.253.195:9080 10.36.2.8:45618
[2019-02-14T19:00:41.761Z] "GET /reviews/0HTTP/1.1" 200 - 0 295 7 7 "-" "python-requests/2.18.4" "4e935f2a-4088-40b4-91f7-812a50a9a646" "reviews:9080" "10.36.0.9:9080" outbound|9080||reviews.default.svc.cluster.local - 10.39.252.135:9080 10.36.2.8:34834
[2019-02-14T19:00:41.748Z] "GET /productpageHTTP/1.1" 200 - 0 4415 23 23 "-" "fortio.org/fortio-1.3.2-pre" "4e935f2a-4088-40b4-91f7-812a50a9a646" "productpage.default:9080" "127.0.0.1:9080" inbound|9080||productpage.default.svc.cluster.local - 10.36.2.8:9080 10.36.0.10:52434
...
```
I'm left wondering what is different in our scenarios.
- Are we using different Istio versions?
- Is your manual propagation not working?
- Are you sending enough traffic to generate tracespans?
- Is something else happening?
douglas-reid
on 14 Feb 2019
@Stono also, checking the stdio access logs, I see a bunch of incoming into productpage with the following:
{"level":"info","time":"2019-02-14T19:03:50.984120Z","instance":"accesslog.logentry.istio-system","apiClaims":"","apiKey":"","clientTraceId":"","connection_security_policy":"none","destinationApp":"productpage","destinationIp":"10.36.2.8","destinationName":"productpage-v1-54b8b9f55-g25jf","destinationNamespace":"default","destinationOwner":"kubernetes://apis/apps/v1/namespaces/default/deployments/productpage-v1","destinationPrincipal":"","destinationServiceHost":"productpage.default.svc.cluster.local","destinationWorkload":"productpage-v1","httpAuthority":"productpage.default:9080","latency":"113.439913ms","method":"GET","protocol":"http","receivedBytes":287,"referer":"","reporter":"destination","requestId":"27f0f844-b466-4794-9950-13dda64e1cc9","requestSize":0,"requestedServerName":"","responseCode":200,"responseSize":5723,"responseTimestamp":"2019-02-14T19:03:51.097501Z","sentBytes":5934,"sourceApp":"","sourceIp":"0.0.0.0","sourceName":"unknown","sourceNamespace":"default","sourceOwner":"unknown","sourcePrincipal":"","sourceWorkload":"unknown","url":"/productpage","userAgent":"fortio.org/fortio-1.3.2-pre","xForwardedFor":"0.0.0.0"}
fortio is the user-agent, and does not set trace headers.
douglas-reid
on 14 Feb 2019
Hey
Thanks so much for trying to reproduce.. my tests were on 1.0.5, we are
rolling out 1.0.6 today so I'll give it another go but judging from the
change log there shouldn't be anything.
Unfortunately I'm away for a few days, but let me gather as much
information about my setup as possible for you over the weekend or Monday
and maybe we can identify the delta.
Ta
Karl
On Thu, 14 Feb 2019, 7:16 pm Douglas Reid <[email protected] wrote:
@Stono https://github.com/Stono I cannot repro this issue. Here's what
I'm doing:
- deployed Istio 1.0.6 from release via helm template:
helm template install/kubernetes/helm/istio --name istio --namespace
istio-system --set tracing.enabled=true --set tracing.jaeger.enabled=true >
$HOME/istio-1.0.6.yaml
- labeled the default namespace for automatic injection
- deployed everyone's favorite bookinfo sample
$ kubectl get pods
NAME READY STATUS RESTARTS AGE
details-v1-6764bbc7f7-96vs5 2/2 Running 0 18m
productpage-v1-54b8b9f55-g25jf 2/2 Running 0 18m
ratings-v1-7bc85949-wwctb 2/2 Running 0 18m
reviews-v1-fdbf674bb-m4rch 2/2 Running 0 18m
reviews-v2-5bdc5877d6-lwjtb 2/2 Running 0 18m
reviews-v3-dd846cc78-r8z22 2/2 Running 0 18m
- created a new namespace (fortio) and deployed the fortio server
there (without fronting proxy), via:kind: Deployment
metadata:
name: fortio-server
spec:
replicas: 1
template:
metadata:
labels:
app: fortio-server
version: v1
spec:
containers:
- name: fortio
image: fortio/fortio
ports:
- containerPort: 8080
- containerPort: 8079
args:$ kubectl -n fortio get pods
NAME READY STATUS RESTARTS AGE
fortio-server-85d547bd8f-gwjfh 1/1 Running 0 16m
- using the fortio web UI to send load against productpage (100 qps
for 30s)- connecting to the Jaeger UI
kubectl port-forward -n istio-system $(kubectl get pod -n istio-system -l
app=jaeger -o jsonpath='{.items[0].metadata.name}') 16686:16686
- see that tracing is working
[image: istio-106-traces]
https://user-images.githubusercontent.com/21148125/52811126-2f8c9900-3049-11e9-9392-db36532cb6da.png
- verify that the traffic is not going through ingressgateway
$ ki logs istio-ingressgateway-694576c7bb-9xc7v | grep GET
$vs.
$ kubectl logs productpage-v1-54b8b9f55-g25jf -c istio-proxy | grep GET
[2019-02-14T19:00:37.757Z] "GET /details/0HTTP/1.1" 200 - 0 178 29 28 "-" "python-requests/2.18.4" "55d22cba-775e-43e3-b907-942746156a96" "details:9080" "10.36.1.16:9080" outbound|9080||details.default.svc.cluster.local - 10.39.253.195:9080 10.36.2.8:45562
[2019-02-14T19:00:37.794Z] "GET /reviews/0HTTP/1.1" 200 - 0 379 1155 1155 "-" "python-requests/2.18.4" "55d22cba-775e-43e3-b907-942746156a96" "reviews:9080" "10.36.2.7:9080" outbound|9080||reviews.default.svc.cluster.local - 10.39.252.135:9080 10.36.2.8:34780
[2019-02-14T19:00:37.743Z] "GET /productpageHTTP/1.1" 200 - 0 5723 1239 1232 "-" "fortio.org/fortio-1.3.2-pre" "55d22cba-775e-43e3-b907-942746156a96" "productpage.default:9080" "127.0.0.1:9080" inbound|9080||productpage.default.svc.cluster.local - 10.36.2.8:9080 10.36.0.10:52410
[2019-02-14T19:00:38.995Z] "GET /details/0HTTP/1.1" 200 - 0 178 14 12 "-" "python-requests/2.18.4" "b4f96914-4f56-4543-bc01-2daaeafa8930" "details:9080" "10.36.1.16:9080" outbound|9080||details.default.svc.cluster.local - 10.39.253.195:9080 10.36.2.8:45584
[2019-02-14T19:00:39.013Z] "GET /reviews/0HTTP/1.1" 200 - 0 295 752 752 "-" "python-requests/2.18.4" "b4f96914-4f56-4543-bc01-2daaeafa8930" "reviews:9080" "10.36.0.9:9080" outbound|9080||reviews.default.svc.cluster.local - 10.39.252.135:9080 10.36.2.8:34802
[2019-02-14T19:00:38.988Z] "GET /productpageHTTP/1.1" 200 - 0 4415 781 778 "-" "fortio.org/fortio-1.3.2-pre" "b4f96914-4f56-4543-bc01-2daaeafa8930" "productpage.default:9080" "127.0.0.1:9080" inbound|9080||productpage.default.svc.cluster.local - 10.36.2.8:9080 10.36.0.10:52412
[2019-02-14T19:00:39.782Z] "GET /details/0HTTP/1.1" 200 - 0 178 3 3 "-" "python-requests/2.18.4" "82510458-d3a3-4c66-838d-215ad9c17a64" "details:9080" "10.36.1.16:9080" outbound|9080||details.default.svc.cluster.local - 10.39.253.195:9080 10.36.2.8:45594
[2019-02-14T19:00:39.790Z] "GET /reviews/0HTTP/1.1" 200 - 0 375 1904 1904 "-" "python-requests/2.18.4" "82510458-d3a3-4c66-838d-215ad9c17a64" "reviews:9080" "10.36.1.18:9080" outbound|9080||reviews.default.svc.cluster.local - 10.39.252.135:9080 10.36.2.8:34810
[2019-02-14T19:00:39.776Z] "GET /productpageHTTP/1.1" 200 - 0 5719 1921 1921 "-" "fortio.org/fortio-1.3.2-pre" "82510458-d3a3-4c66-838d-215ad9c17a64" "productpage.default:9080" "127.0.0.1:9080" inbound|9080||productpage.default.svc.cluster.local - 10.36.2.8:9080 10.36.0.10:52418
[2019-02-14T19:00:41.704Z] "GET /details/0HTTP/1.1" 200 - 0 178 3 3 "-" "python-requests/2.18.4" "2cf4f5e5-18a0-4d30-aaae-e92b4bbe4cee" "details:9080" "10.36.1.16:9080" outbound|9080||details.default.svc.cluster.local - 10.39.253.195:9080 10.36.2.8:45612
[2019-02-14T19:00:41.711Z] "GET /reviews/0HTTP/1.1" 200 - 0 379 29 29 "-" "python-requests/2.18.4" "2cf4f5e5-18a0-4d30-aaae-e92b4bbe4cee" "reviews:9080" "10.36.2.7:9080" outbound|9080||reviews.default.svc.cluster.local - 10.39.252.135:9080 10.36.2.8:34828
[2019-02-14T19:00:41.701Z] "GET /productpageHTTP/1.1" 200 - 0 5723 44 44 "-" "fortio.org/fortio-1.3.2-pre" "2cf4f5e5-18a0-4d30-aaae-e92b4bbe4cee" "productpage.default:9080" "127.0.0.1:9080" inbound|9080||productpage.default.svc.cluster.local - 10.36.2.8:9080 10.36.0.10:52432
[2019-02-14T19:00:41.753Z] "GET /details/0HTTP/1.1" 200 - 0 178 3 3 "-" "python-requests/2.18.4" "4e935f2a-4088-40b4-91f7-812a50a9a646" "details:9080" "10.36.1.16:9080" outbound|9080||details.default.svc.cluster.local - 10.39.253.195:9080 10.36.2.8:45618
[2019-02-14T19:00:41.761Z] "GET /reviews/0HTTP/1.1" 200 - 0 295 7 7 "-" "python-requests/2.18.4" "4e935f2a-4088-40b4-91f7-812a50a9a646" "reviews:9080" "10.36.0.9:9080" outbound|9080||reviews.default.svc.cluster.local - 10.39.252.135:9080 10.36.2.8:34834
[2019-02-14T19:00:41.748Z] "GET /productpageHTTP/1.1" 200 - 0 4415 23 23 "-" "fortio.org/fortio-1.3.2-pre" "4e935f2a-4088-40b4-91f7-812a50a9a646" "productpage.default:9080" "127.0.0.1:9080" inbound|9080||productpage.default.svc.cluster.local - 10.36.2.8:9080 10.36.0.10:52434
...I'm left wondering what is different in our scenarios.
- Are we using different Istio versions?
- Is your manual propagation not working?
- Are you sending enough traffic to generate tracespans?
- Is something else happening?
—
You are receiving this because you were mentioned.
Reply to this email directly, view it on GitHub
https://github.com/istio/istio/issues/11696#issuecomment-463754933, or mute
the thread
https://github.com/notifications/unsubscribe-auth/ABavibtHznJFcA69TpDfE2XTMO0Zr0F7ks5vNbYRgaJpZM4a2ff_
.
Stono
on 14 Feb 2019
@douglas-reid I've upgraded to 1.0.6 but still get exactly the same result, traces only go two applications deep when i'm using istio instantiated tracing, i see the full trace when i use a client library to start the trace at the edge.
Even the simplest of traces though, Service A -> Service B, dumping the request headers in Service B shows what i believe to be invalid headers being generated by istio:
This is a curl from service a's pod, to service b
curl http://app.platform-testing
{
  "path": "/",
  "headers": {
    "host": "app.platform-testing",
    "user-agent": "curl/7.29.0",
    "accept": "*/*",
    "x-forwarded-proto": "http",
    "x-request-id": "88a4582e-517d-97ba-8527-e4c0089ecb98",
    "x-b3-traceid": "a0a596efd2d4a435",
    "x-b3-spanid": "a0a596efd2d4a435",
    "x-b3-sampled": "1",
    "content-length": "0"
  },
  "method": "GET",
  "body": "",
  "fresh": false,
  "hostname": "app.platform-testing",
  "ip": "::ffff:127.0.0.1",
  "ips": [],
  "protocol": "http",
  "query": {},
  "subdomains": [],
  "xhr": false,
  "os": {
    "hostname": "platform-testing-546f99d96b-r2j6r"
  }
Why would istio create a trace and add span headers where x-b3-spanid and x-b3-traceid are the same?
Like I mentioned before, when I use the client library in service A to instantiate a trace I get these in service B, which is what you would expect:
"x-b3-traceid": "f1915bfbbf0385a5",
"x-b3-spanid": "476cd6d818938e78",
"x-b3-sampled": "1",
"x-b3-parentspanid": "56e9cdea788416ac",
"x-request-id": "6e6d2959-64e8-9320-aff7-4458dc719cb1",
To answer your questions:
- Are we using different Istio versions?
No - Is your manual propagation not working?
Yes it's working as I get full traces in Jaeger when using a client library at the edge to start the trace
- Are you sending enough traffic to generate tracespans?
Sample rate is set to 100 - Is something else happening?
Yes but trying to debug what is proving impossible
Stono
on 16 Feb 2019
I have seen the same issue after forwarding tracing headers in my microservices.
x-b3-traceid and x-b3-spanid have the same value and I dont see those traces in the Jaeger.
info: [dcd546a1-5d8b-4927-a84f-f1f1bce0b4d3] ForwardTraceHeaders: {"_internal_repr":{"x-request-id":["52ad7e03-f69a-980d-ac46-f3f8604264fe"],"x-b3-traceid":["1a5bceb247e625c9"],"x-b3-spanid":["1a5bceb247e625c9"],"x-b3-sampled":["1"]}}
When I tried to debug this issue, didn't find a way to enable debug logs in jaeger-all-in-one deployment. How to enable debug logs for that?
@Stono When you mention "* when using a client library at the edge to start the trace*" do you mean that you are using opentracing libraries to create tracing headers in nginx?
 vijaykumark
on 18 Feb 2019
vijaykumark
on 18 Feb 2019
Yay someone validating my issue haha, thanks @vijaykumark
Yes that's exactly what i'm doing, using opentracing module in ingress-nginx, when i do that, my traces are spot on. But i need to enable traces for intra-cluster traffic (stuff that doesn't go via nginx) so need istio to do it; but as you've seen - it doesn't.
Stono
on 19 Feb 2019
@Stono I've tried duplicating this issue again -- and cannot. I believe that your traceid spanid concern may be a red herring.
I've taken a fortio instance (with 1.0.6) and had it send requests to the bookinfo app and was able to generate traces -- both with a sidecar injected client-side and without.
I've also used a pod with just curl and was also able to send requests and generate trace spans as expected.
In both cases, I'm not attempting to set any headers client-side.
What in your setup is sending the trace data? Did you have --set tracing.enabled=true and do you have a zipkin service in your cluster? Are you setting headers client-side?
I'm concerned that whatever you are doing client-side is messing up the headers and trace generation. Your original headers had a suspicious x-request-id.
douglas-reid
on 26 Feb 2019
@Stono Here's a trace JSON from jaeger from my 1.0.6 cluster for an example request. This request came from a sidecar-free (no sidecar) pod that sends no tracing headers to an istio endpoint:
{
    "data": [
        {
            "traceID": "b4af55778e3860fb",
            "spans": [
                {
                    "traceID": "b4af55778e3860fb",
                    "spanID": "b4af55778e3860fb",
                    "operationName": "ratings.default.svc.cluster.local:9080/*",
                    "references": [],
                    "startTime": 1551220524392147,
                    "duration": 1856,
                    "tags": [
                        {
                            "key": "component",
                            "type": "string",
                            "value": "proxy"
                        },
                        {
                            "key": "node_id",
                            "type": "string",
                            "value": "sidecar~10.36.1.17~ratings-v1-7bc85949-wwctb.default~default.svc.cluster.local"
                        },
                        {
                            "key": "guid:x-request-id",
                            "type": "string",
                            "value": "c576149e-014f-9035-b898-c46458d778d3"
                        },
                        {
                            "key": "http.url",
                            "type": "string",
                            "value": "http://ratings.default:9080/ratings/0"
                        },
                        {
                            "key": "http.method",
                            "type": "string",
                            "value": "GET"
                        },
                        {
                            "key": "downstream_cluster",
                            "type": "string",
                            "value": "-"
                        },
                        {
                            "key": "user_agent",
                            "type": "string",
                            "value": "fortio.org/fortio-1.3.2-pre"
                        },
                        {
                            "key": "http.protocol",
                            "type": "string",
                            "value": "HTTP/1.1"
                        },
                        {
                            "key": "request_size",
                            "type": "string",
                            "value": "0"
                        },
                        {
                            "key": "upstream_cluster",
                            "type": "string",
                            "value": "inbound|9080||ratings.default.svc.cluster.local"
                        },
                        {
                            "key": "http.status_code",
                            "type": "string",
                            "value": "200"
                        },
                        {
                            "key": "response_size",
                            "type": "string",
                            "value": "48"
                        },
                        {
                            "key": "response_flags",
                            "type": "string",
                            "value": "-"
                        },
                        {
                            "key": "span.kind",
                            "type": "string",
                            "value": "server"
                        }
                    ],
                    "logs": [],
                    "processID": "p1",
                    "warnings": null
                }
            ],
            "processes": {
                "p1": {
                    "serviceName": "ratings",
                    "tags": [
                        {
                            "key": "ip",
                            "type": "string",
                            "value": "10.36.1.17"
                        }
                    ]
                }
            },
            "warnings": null
        }
    ],
    "total": 0,
    "limit": 0,
    "offset": 0,
    "errors": null
}
Note: the traceid and spanid fields are the same; no issues resulted from this setting.
douglas-reid
on 26 Feb 2019
Here is also a snippet of my mesh config:
apiVersion: v1
data:
  mesh: "...
    # Set enableTracing to false to disable request tracing.
    enableTracing: true
    # Zipkin trace collector
    zipkinAddress: zipkin.istio-system:9411
    ..."
And some version information:
- docker.io/istio/pilot:1.0.6
- docker.io/istio/proxyv2:1.0.6
- docker.io/jaegertracing/all-in-one:1.5
douglas-reid
on 26 Feb 2019
In your (sidecar-less) implementation have you tried multiple apps in the chain?
The issue we see is that we never see an additional span, each app pair results in a new trace and new span (yes them being the same might be a red herring)
As for our setup, we don't set any headers other than a request id? I don't see how that would mess things up, and that's only when traffic enters our edge. Even intra mesh traces (so don't go near anything that generates headers, purely istio) do not generate nested traces!
If you have half an hour one day perhaps I can just screen share and show you? Something might stand out to you
Stono
on 28 Feb 2019
@Stono yes. I can send traces through productpage and see a full set of traces from a sidecar-less setup.
When you don't use a client, are you sure that you are forwarding all of the required headers (https://preliminary.istio.io/help/faq/distributed-tracing/#how-to-support-tracing) ? It really sounds like something is stripping the headers inside your applications (applications are required to forward all of the b3 headers on each request).
I'd be happy to do a screenshare session one day... maybe sometime next week?
douglas-reid
on 28 Feb 2019
Absolutely sure we are forwarding the headers, when we use the client in
our edge app, we only start the trace with that, the downstream apps are
just header forwarding and envoy taking care of the rest, and it's
absolutely fine and we see the trace. If we weren't forwarding headers
correctly we wouldn't see the trace.
I think a screen share is the only way we will get to the bottom of this
and see if it's user error or not!
Karl
On Thu, 28 Feb 2019, 5:42 pm Douglas Reid, notifications@github.com wrote:
@Stono https://github.com/Stono yes. I can send traces through
productpage and see a full set of traces from a sidecar-less setup.When you don't use a client, are you sure that you are forwarding all of
the required headers (
https://preliminary.istio.io/help/faq/distributed-tracing/#how-to-support-tracing)
? It really sounds like something is stripping the headers inside your
applications (applications are required to forward all of the b3 headers on
each request).I'd be happy to do a screenshare session one day... maybe sometime next
week?—
You are receiving this because you were mentioned.
Reply to this email directly, view it on GitHub
https://github.com/istio/istio/issues/11696#issuecomment-468367249, or mute
the thread
https://github.com/notifications/unsubscribe-auth/ABaviXVPgVYrl0a6B-0MIJ4izq3Kx2aOks5vSBUggaJpZM4a2ff_
.
Stono
on 28 Feb 2019
@Stono is it possible to (perhaps offline) share the app you are using to eliminate differences in behavior between our two setups?
douglas-reid
on 1 Mar 2019
I've tried doing distributed tracing a few times (different languages, rest+grpc, rest-only, grpc-only) - each resulting in a similar issue - all requests show up in the trace, but the inheritance isn't right.
Of course it works right for the bookinfo app, and I'm parroting the same headers to child requests that the sample app is, so I'm at a loss as to what I'm doing wrong.
What makes it weirder is that it tends to be "more correct" if you don't go through the ingress gateway to start the trace.
I'm using istio 1.0.5, no mtls enabled, but obviously tracing is enabled. Running k8s 1.13.3 At this point I've created some dummy services, with a deployment yaml so I can easily share them, if you have any time on slack (although I would need an invite seemingly)
Mike
 venezia
on 5 Mar 2019
venezia
on 5 Mar 2019
Same, absolutely at a loose end with it.
Doug, what day this week (or next) is good for a screen share?
On Tue, 5 Mar 2019, 7:44 pm Michael Venezia, notifications@github.com
wrote:
I've tried doing distributed tracing a few times (different languages,
rest+grpc, rest-only, grpc-only) - each resulting in a similar issue - all
requests show up in the trace, but the inheritance isn't right.Of course it works right for the bookinfo app, and I'm parroting the same
headers to child requests that the sample app is, so I'm at a loss as to
what I'm doing wrong.What makes it weirder is that it tends to be "more correct" if you don't
go through the ingress gateway to start the trace.I'm using istio 1.0.5, no mtls enabled, but obviously tracing is enabled.
Running k8s 1.13.3 At this point I've created some dummy services, with a
deployment yaml so I can easily share them, if you have any time on slack
(although I would need an invite seemingly)Mike
—
You are receiving this because you were mentioned.
Reply to this email directly, view it on GitHub
https://github.com/istio/istio/issues/11696#issuecomment-469830422, or mute
the thread
https://github.com/notifications/unsubscribe-auth/ABavic3QoGxOFg4ExxpHe2EnJ66y3uKuks5vTskZgaJpZM4a2ff_
.
Stono
on 5 Mar 2019
@Stono Thursday is looking best for me. please let me know through some channel what time is best for you.
I've used other non-bookinfo apps as well, without issue. I'm happy to setup a cluster with whatever apps we think makes a good test bed in advance of any screenshare in the interest of full disclosure.
@venezia I believe slack is open now. At least, that was my understanding. If that is not yet the case, if you could post a gist or something of the yaml (+source code ideally), that'd be great.
I'm not sure what is meant by "inheritance isn't right", but if you are seeing all of the traces, could this just be a timing issue ?
One possibility is that there is some other proxy stripping headers between requests in your setups, I guess.
For debugging, it might be good to set up mixer-driven logging for requests through the system and see what envoy thinks the headers are at each end the request (client/server) that is breaking the chain. You can do this in a number of ways, including adding --log_output_level=api:debug to the istio-telemetry deployment args (or doing via the ctrlz interface on each telemetry pod). You could also create a special logentry that just logs workloads, reporters, and the value of the tracing headers and then use kubectl logs to watch a request flow through the system.
douglas-reid
on 5 Mar 2019
@douglas-reid per this faq I need to find someone that already is in the slack, which could be you :)
You can look at this repo - its just a dummy example (I've tried this many times, but always run into the same issue) of:
svc1 -> svc2 -> { svc3 -> { svc4, svc5 -> svc4 }, svc4, svc5 -> svc4 }
At this point, just some random timeouts are put in the requests to help simulate "doing something" and the goal was to see the distributed tracing. Headers are being parroted per the docs over here and if you look at the logs you'll see
[Tue Mar 05 20:44:31.753714 2019] [php7:notice] [pid 21] [client 127.0.0.1:55548] I'm going to send out requests, and here's the headers I'm parroting:
[Tue Mar 05 20:44:31.753820 2019] [php7:notice] [pid 21] [client 127.0.0.1:55548] x-request-id: 13220c2b-ff14-9bb4-9c94-c494ae63c758
[Tue Mar 05 20:44:31.753838 2019] [php7:notice] [pid 21] [client 127.0.0.1:55548] x-b3-traceid: b9216e7f4cc9e64c
[Tue Mar 05 20:44:31.753849 2019] [php7:notice] [pid 21] [client 127.0.0.1:55548] x-b3-spanid: b9216e7f4cc9e64c
[Tue Mar 05 20:44:31.753859 2019] [php7:notice] [pid 21] [client 127.0.0.1:55548] x-b3-sampled: 1
[Tue Mar 05 20:44:31.753870 2019] [php7:notice] [pid 21] [client 127.0.0.1:55548] End of parroting
Incidentally, the same header values are passed on to every derivative request (which might be the problem) ... so child requests are having the same traceid, spanid, request id - which I suspect is not what should be happening.
Some other details:
- istio-pilot is configured to have a 100% trace sampling rate
- I've tried this from a virutalservice + ingress gateway or even from within the cluster, the results are largely the same, however often going through the virtualservice/ingress gateway you will find a child service is the root service in the span instead of the true service.
- you can start a request by hitting
http://stream-live-service/api/v1/live.phpor however you want to expose it through an ingress gateway - the cluster resides in AWS, ingress gateway is an ELB created by the istio helm chart
- istio 1.0.5, k8s 1.13.3
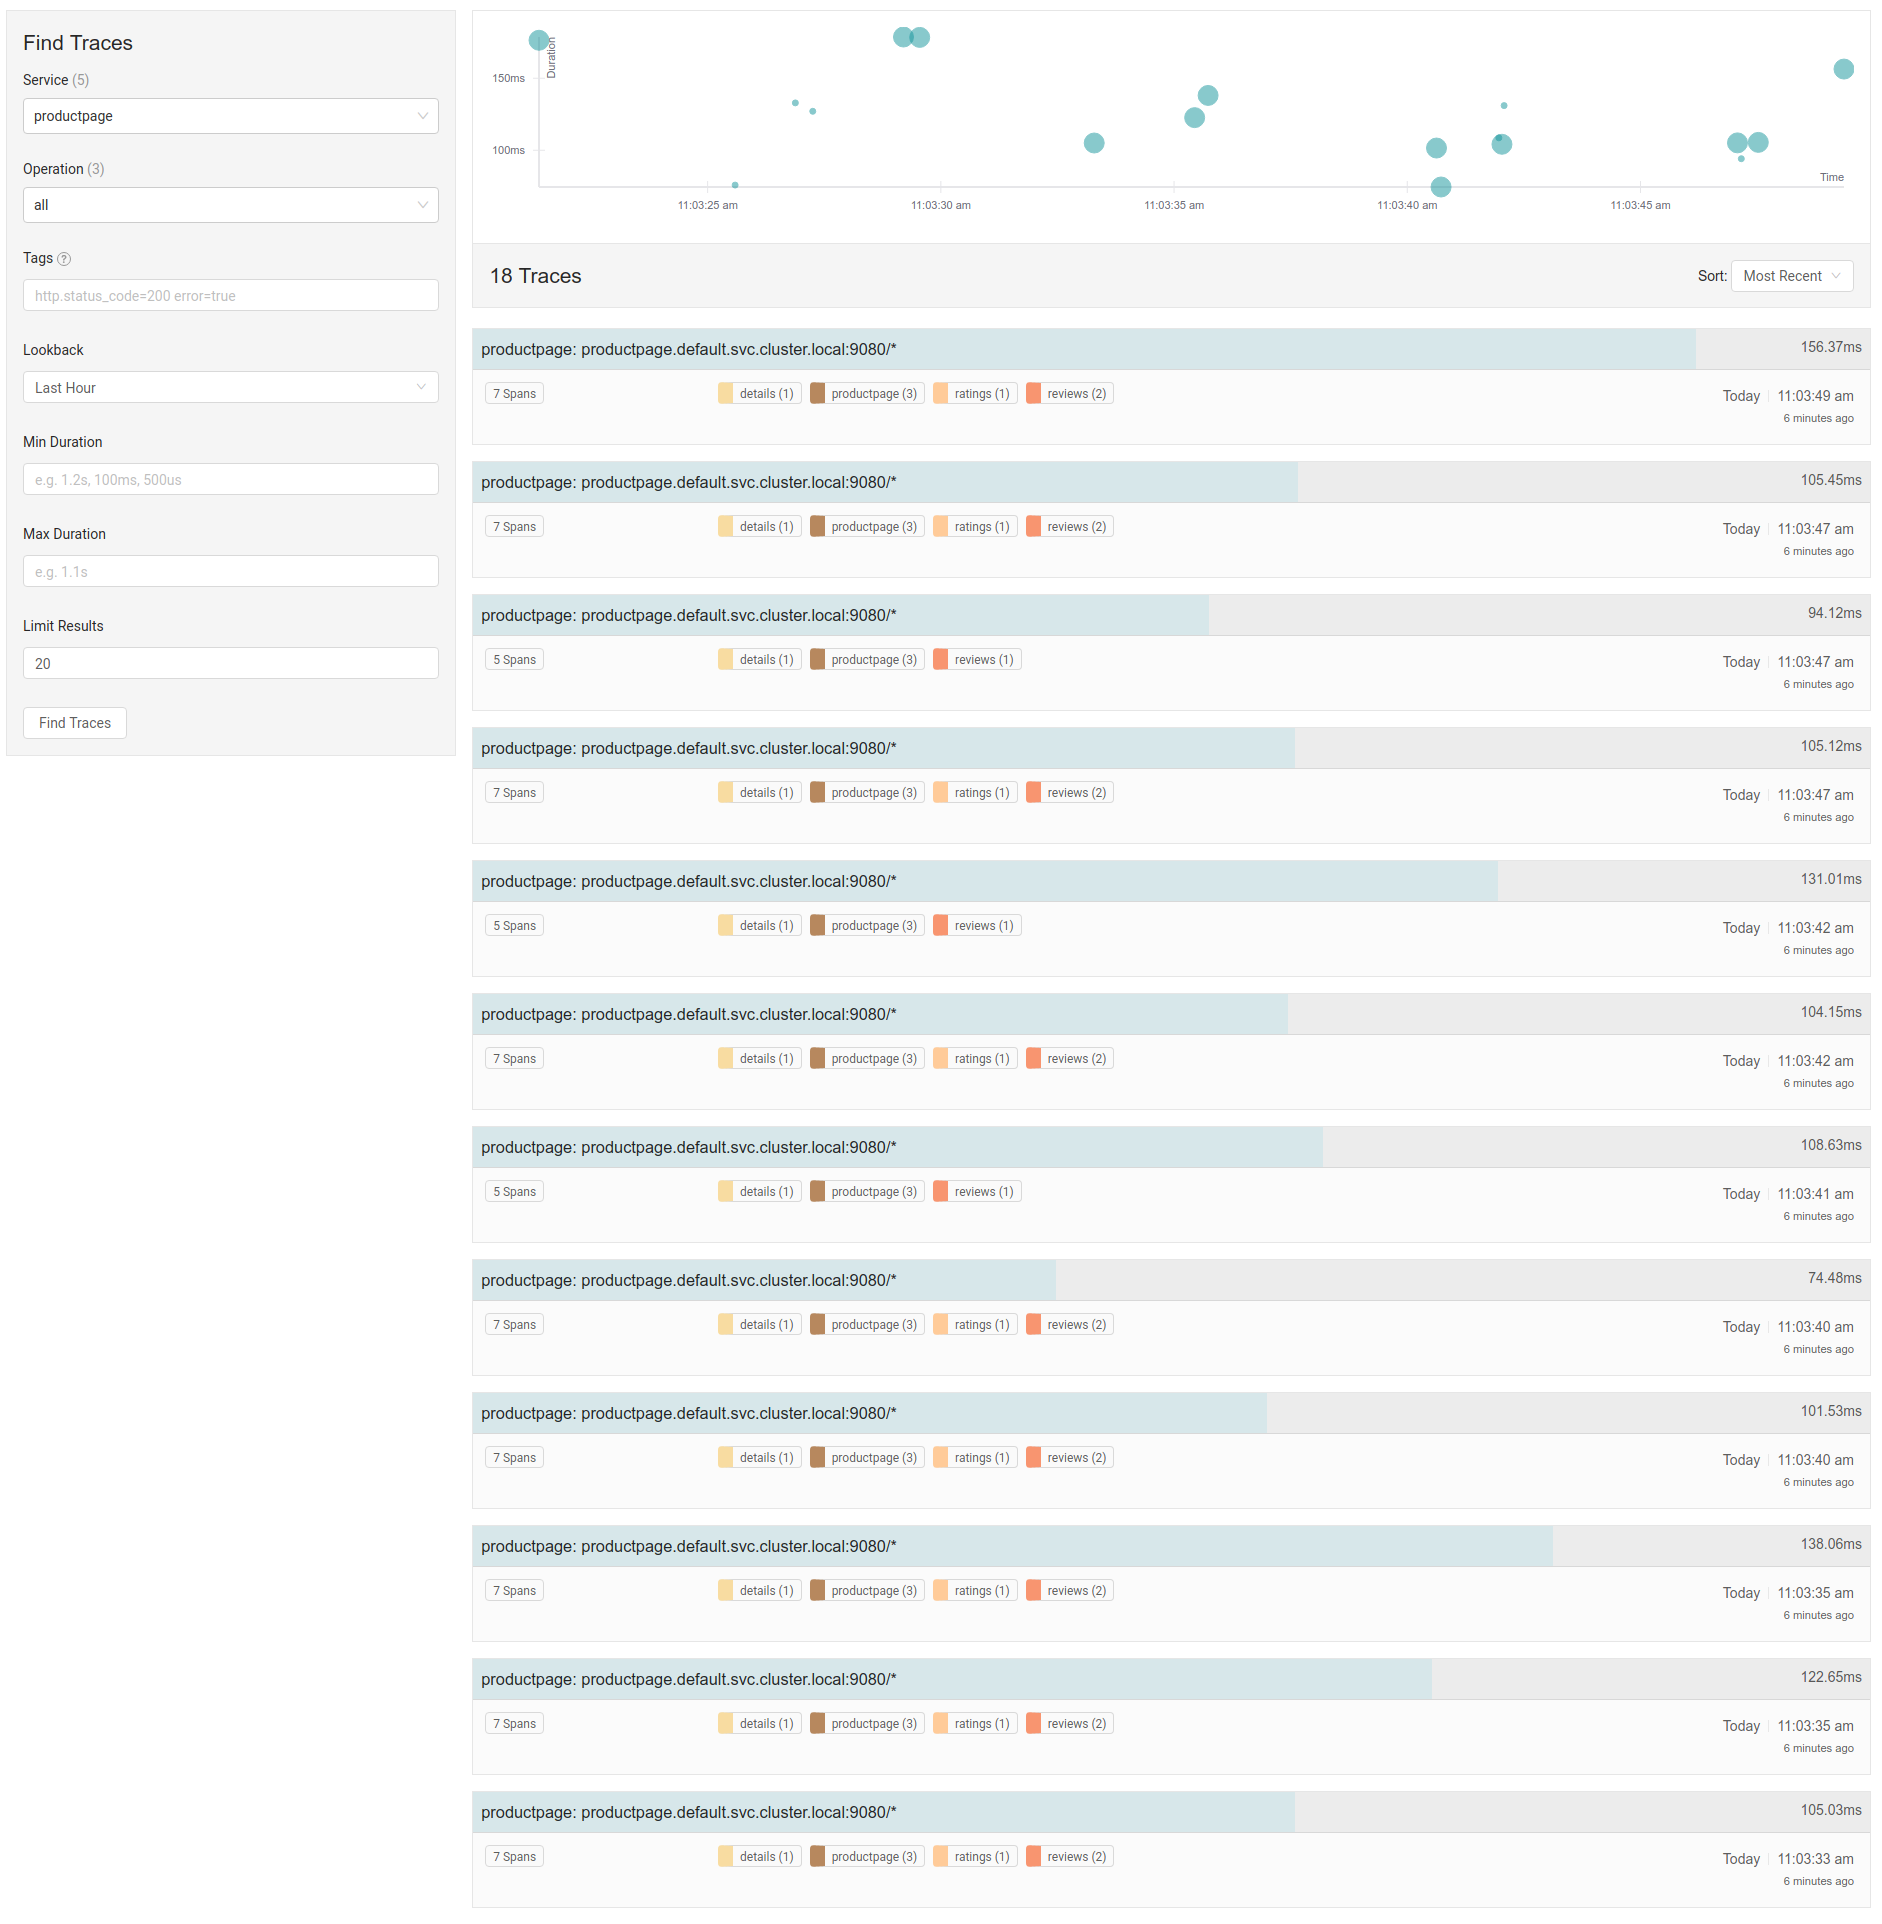
- Here's a snapshot of jaeger with a call from within the cluster - note how the jaeger properly identifies that stream-live-service is the right "initial service" but the rest of the child calls are all sort of flat within the hierarchy
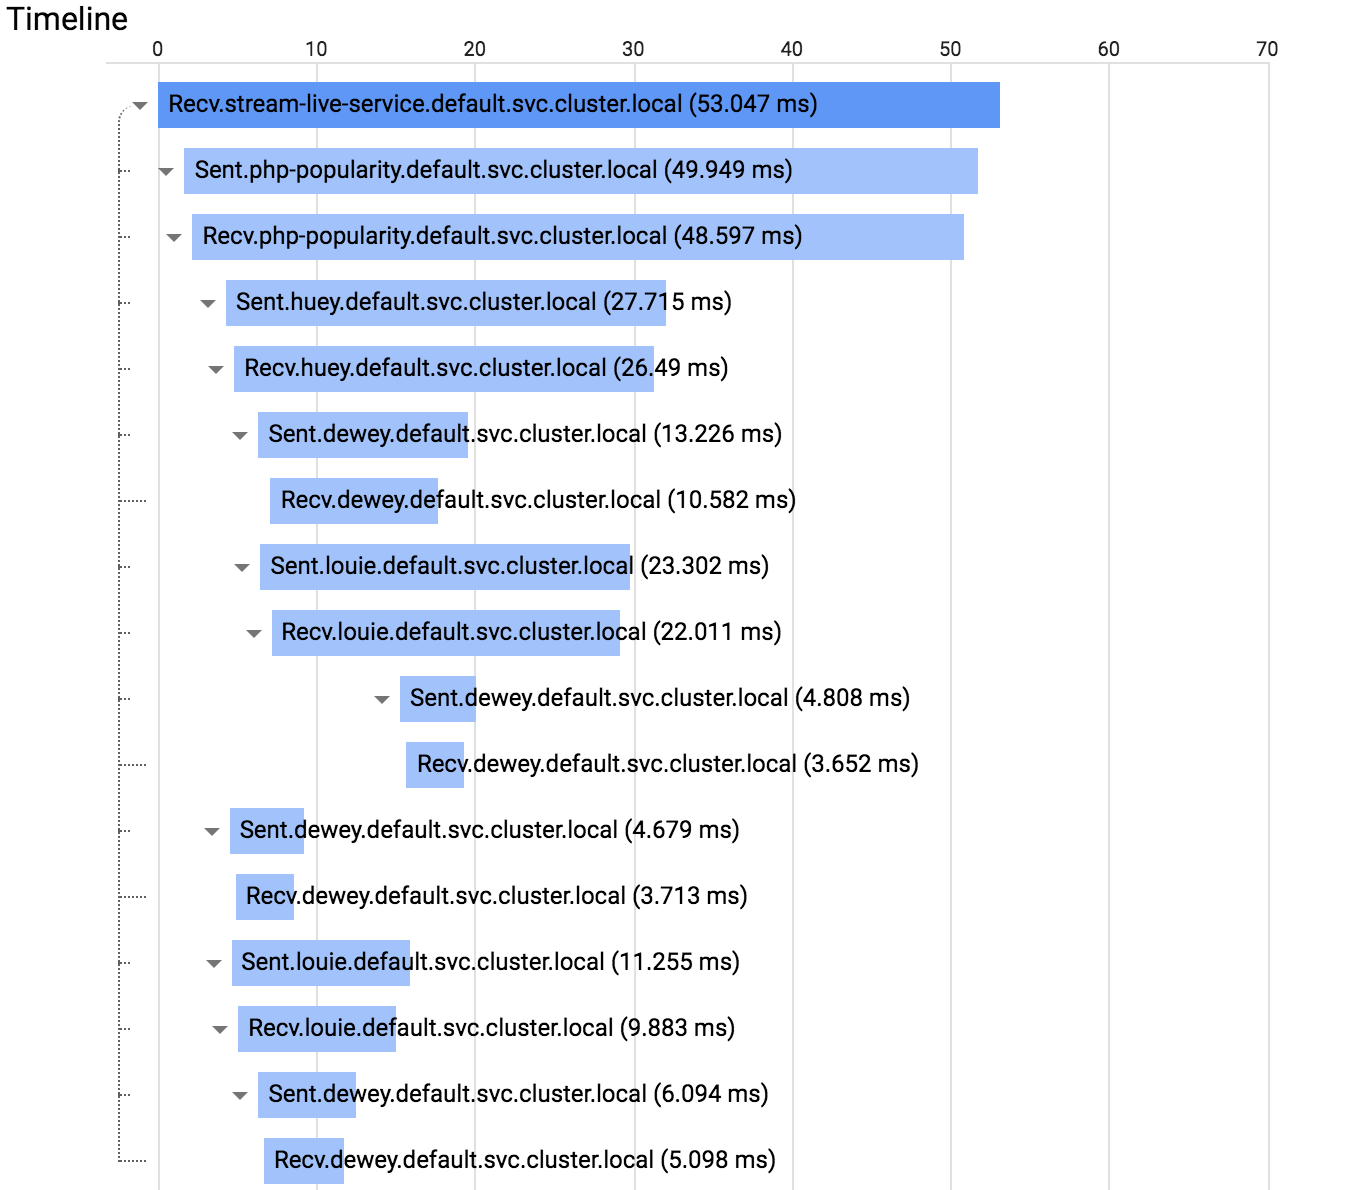
- Here's another snapshot where stream-live-service was invoked across an istio ingress gateway - note how in this case it thinks huey is the initial service, which isn't right. That service would be at least two levels deep from the original invocation.
venezia
on 5 Mar 2019
@venezia here's what I'm doing to debug on my side. maybe it will help suss out the diff. I had a 1.0.3 cluster sitting around, which I used to save time as I had recently torn down my 1.0.6 cluster to make room for 1.1 release testing.
I applied the following config:
apiVersion: "config.istio.io/v1alpha2"
kind: logentry
metadata:
  name: trace
  namespace: istio-system
spec:
  severity: '"Info"'
  timestamp: request.time
  variables:
    sourceApp: source.labels["app"] | ""
    destinationApp: destination.labels["app"] | ""
    requestId: request.headers["x-request-id"] | ""
    traceId: request.headers["x-b3-traceid"] | ""
    spanId: request.headers["x-b3-spanid"] | ""
    parentSpanId: request.headers["x-b3-parentspanid"] | ""
    reporter: conditional((context.reporter.kind | "inbound") == "outbound", "source", "destination")
  monitored_resource_type: '"global"'
---
apiVersion: "config.istio.io/v1alpha2"
kind: rule
metadata:
  name: stdio-test
  namespace: istio-system
spec:
  match: context.protocol == "http" || context.protocol == "grpc"
  actions:
  - handler: test.stdio
    instances:
    - trace.logentry
---
apiVersion: "config.istio.io/v1alpha2"
kind: stdio
metadata:
  name: test
  namespace: istio-system
spec:
  outputAsJson: true
Then sent a request to the bookinfo app (just as an example).
Then retrieved all the generated logs at mixer, via: kubectl -n istio-system log <istio-telemetry pod> mixer | grep trace.log | grep -v telemetry | grep -v policy.
Got:
{"level":"info","time":"2019-03-05T22:31:32.387437Z","instance":"trace.logentry.istio-system","destinationApp":"details","parentSpanId":"824220ac950bfe41","reporter":"destination","requestId":"b38b8584-a51d-4681-a91a-4d24dff533b0","sourceApp":"productpage","spanId":"d305af99b4274a42","traceId":"824220ac950bfe41"}
{"level":"info","time":"2019-03-05T22:31:32.385427Z","instance":"trace.logentry.istio-system","destinationApp":"details","parentSpanId":"824220ac950bfe41","reporter":"source","requestId":"b38b8584-a51d-4681-a91a-4d24dff533b0","sourceApp":"productpage","spanId":"d305af99b4274a42","traceId":"824220ac950bfe41"}
{"level":"info","time":"2019-03-05T22:31:32.398360Z","instance":"trace.logentry.istio-system","destinationApp":"reviews","parentSpanId":"824220ac950bfe41","reporter":"source","requestId":"b38b8584-a51d-4681-a91a-4d24dff533b0","sourceApp":"productpage","spanId":"2380206df9fe593c","traceId":"824220ac950bfe41"}
{"level":"info","time":"2019-03-05T22:31:32.399343Z","instance":"trace.logentry.istio-system","destinationApp":"reviews","parentSpanId":"824220ac950bfe41","reporter":"destination","requestId":"b38b8584-a51d-4681-a91a-4d24dff533b0","sourceApp":"productpage","spanId":"2380206df9fe593c","traceId":"824220ac950bfe41"}
{"level":"info","time":"2019-03-05T22:31:32.376820Z","instance":"trace.logentry.istio-system","destinationApp":"productpage","parentSpanId":"","reporter":"destination","requestId":"b38b8584-a51d-4681-a91a-4d24dff533b0","sourceApp":"istio-ingressgateway","spanId":"824220ac950bfe41","traceId":"824220ac950bfe41"}
{"level":"info","time":"2019-03-05T22:31:32.368941Z","instance":"trace.logentry.istio-system","destinationApp":"productpage","parentSpanId":"","reporter":"source","requestId":"b38b8584-a51d-4681-a91a-4d24dff533b0","sourceApp":"istio-ingressgateway","spanId":"824220ac950bfe41","traceId":"824220ac950bfe41"}
A couple of items are immediately obvious:
traceIdandx-request-idare consistent across all logsspanIdis only shared for the tworeportersfor the same transaction
In your comment, you claim that spanId is always the same, regardless of which services are involved. As you suspect, this is likely the core issue.
Can you try out using this config and doing the same generation? Maybe also add in the x-b3-sampled info too?
douglas-reid
on 6 Mar 2019
Sure thing, I got:
{"level":"info","time":"2019-03-05T23:22:51.548996Z","instance":"trace.logentry.istio-system","destinationApp":"","parentSpanId":"","reporter":"source","requestId":"caf55a84-c147-94b5-b78f-148909521ef4","sourceApp":"external-dns","spanId":"eaa1300c57ca815f","traceId":"eaa1300c57ca815f"}
{"level":"info","time":"2019-03-05T23:23:06.579104Z","instance":"trace.logentry.istio-system","destinationApp":"dewey","parentSpanId":"","reporter":"destination","requestId":"760e527f-fe06-9aca-8425-9992a8b1a82a","sourceApp":"","spanId":"d4b0fc197a992f6a","traceId":"d4b0fc197a992f6a"}
{"level":"info","time":"2019-03-05T23:23:06.589371Z","instance":"trace.logentry.istio-system","destinationApp":"dewey","parentSpanId":"","reporter":"destination","requestId":"760e527f-fe06-9aca-8425-9992a8b1a82a","sourceApp":"","spanId":"d4b0fc197a992f6a","traceId":"d4b0fc197a992f6a"}
{"level":"info","time":"2019-03-05T23:23:06.588837Z","instance":"trace.logentry.istio-system","destinationApp":"dewey","parentSpanId":"","reporter":"destination","requestId":"760e527f-fe06-9aca-8425-9992a8b1a82a","sourceApp":"","spanId":"d4b0fc197a992f6a","traceId":"d4b0fc197a992f6a"}
{"level":"info","time":"2019-03-05T23:23:06.592178Z","instance":"trace.logentry.istio-system","destinationApp":"dewey","parentSpanId":"","reporter":"destination","requestId":"760e527f-fe06-9aca-8425-9992a8b1a82a","sourceApp":"","spanId":"d4b0fc197a992f6a","traceId":"d4b0fc197a992f6a"}
{"level":"info","time":"2019-03-05T23:23:06.613887Z","instance":"trace.logentry.istio-system","destinationApp":"louie","parentSpanId":"","reporter":"destination","requestId":"760e527f-fe06-9aca-8425-9992a8b1a82a","sourceApp":"","spanId":"d4b0fc197a992f6a","traceId":"d4b0fc197a992f6a"}
{"level":"info","time":"2019-03-05T23:23:06.608018Z","instance":"trace.logentry.istio-system","destinationApp":"louie","parentSpanId":"","reporter":"destination","requestId":"760e527f-fe06-9aca-8425-9992a8b1a82a","sourceApp":"","spanId":"d4b0fc197a992f6a","traceId":"d4b0fc197a992f6a"}
{"level":"info","time":"2019-03-05T23:23:06.608018Z","instance":"trace.logentry.istio-system","destinationApp":"huey","parentSpanId":"","reporter":"destination","requestId":"760e527f-fe06-9aca-8425-9992a8b1a82a","sourceApp":"","spanId":"d4b0fc197a992f6a","traceId":"d4b0fc197a992f6a"}
{"level":"info","time":"2019-03-05T23:23:06.573785Z","instance":"trace.logentry.istio-system","destinationApp":"php-popularity","parentSpanId":"","reporter":"destination","requestId":"760e527f-fe06-9aca-8425-9992a8b1a82a","sourceApp":"","spanId":"d4b0fc197a992f6a","traceId":"d4b0fc197a992f6a"}
{"level":"info","time":"2019-03-05T23:23:06.593261Z","instance":"trace.logentry.istio-system","destinationApp":"stream-live-service","parentSpanId":"","reporter":"destination","requestId":"760e527f-fe06-9aca-8425-9992a8b1a82a","sourceApp":"istio-ingressgateway","spanId":"d4b0fc197a992f6a","traceId":"d4b0fc197a992f6a"}
{"level":"info","time":"2019-03-05T23:23:06.591670Z","instance":"trace.logentry.istio-system","destinationApp":"stream-live-service","parentSpanId":"","reporter":"source","requestId":"760e527f-fe06-9aca-8425-9992a8b1a82a","sourceApp":"istio-ingressgateway","spanId":"d4b0fc197a992f6a","traceId":"d4b0fc197a992f6a"}
Right after (well a few minutes after anyway) I requested the bookinfo page (this was running on the cluster all this time) and grab those logs:
{"level":"info","time":"2019-03-05T23:26:40.650341Z","instance":"trace.logentry.istio-system","destinationApp":"details","parentSpanId":"760ba21402609299","reporter":"destination","requestId":"cd2176b7-e58e-9333-b495-a84d403731e1","sourceApp":"productpage","spanId":"b3fb959fc4745b45","traceId":"760ba21402609299"}
{"level":"info","time":"2019-03-05T23:26:40.650139Z","instance":"trace.logentry.istio-system","destinationApp":"details","parentSpanId":"760ba21402609299","reporter":"source","requestId":"cd2176b7-e58e-9333-b495-a84d403731e1","sourceApp":"productpage","spanId":"b3fb959fc4745b45","traceId":"760ba21402609299"}
{"level":"info","time":"2019-03-05T23:26:41.740931Z","instance":"trace.logentry.istio-system","destinationApp":"ratings","parentSpanId":"f80f7817ec5f9eee","reporter":"destination","requestId":"cd2176b7-e58e-9333-b495-a84d403731e1","sourceApp":"reviews","spanId":"093466278ab861db","traceId":"760ba21402609299"}
{"level":"info","time":"2019-03-05T23:26:41.740137Z","instance":"trace.logentry.istio-system","destinationApp":"ratings","parentSpanId":"f80f7817ec5f9eee","reporter":"source","requestId":"cd2176b7-e58e-9333-b495-a84d403731e1","sourceApp":"reviews","spanId":"093466278ab861db","traceId":"760ba21402609299"}
{"level":"info","time":"2019-03-05T23:26:40.655934Z","instance":"trace.logentry.istio-system","destinationApp":"reviews","parentSpanId":"760ba21402609299","reporter":"destination","requestId":"cd2176b7-e58e-9333-b495-a84d403731e1","sourceApp":"productpage","spanId":"f80f7817ec5f9eee","traceId":"760ba21402609299"}
{"level":"info","time":"2019-03-05T23:26:40.655625Z","instance":"trace.logentry.istio-system","destinationApp":"reviews","parentSpanId":"760ba21402609299","reporter":"source","requestId":"cd2176b7-e58e-9333-b495-a84d403731e1","sourceApp":"productpage","spanId":"f80f7817ec5f9eee","traceId":"760ba21402609299"}
{"level":"info","time":"2019-03-05T23:26:40.644627Z","instance":"trace.logentry.istio-system","destinationApp":"productpage","parentSpanId":"","reporter":"source","requestId":"cd2176b7-e58e-9333-b495-a84d403731e1","sourceApp":"istio-ingressgateway","spanId":"760ba21402609299","traceId":"760ba21402609299"}
{"level":"info","time":"2019-03-05T23:26:40.646396Z","instance":"trace.logentry.istio-system","destinationApp":"productpage","parentSpanId":"","reporter":"destination","requestId":"cd2176b7-e58e-9333-b495-a84d403731e1","sourceApp":"istio-ingressgateway","spanId":"760ba21402609299","traceId":"760ba21402609299"}
{"level":"info","time":"2019-03-05T23:26:43.326081Z","instance":"trace.logentry.istio-system","destinationApp":"","parentSpanId":"","reporter":"source","requestId":"786a66cd-7cbc-9030-b895-0ba24b91bdd3","sourceApp":"istio-ingressgateway","spanId":"daeb5364c8b96e86","traceId":"daeb5364c8b96e86"}
The product page spans look "right" (they change, spans become parents, etc.) and jaeger shows things in a great way too.
The thing I figure I should mention is that while the details python code seem to just parrot back those aforementioned headers, the product page seems to do more While the docs suggest you just need to parrot the incoming headers, perhaps there is something special that needs to be done at the start of a trace that I'm not doing which is causing this problem.
Again, it could be a configuration issue as well if you're not having any issues. I installed istio through the helm chart (with the tracing option enabled) - I know istio is non trivial software with a lot of configuration options, so there might be something amiss there - at least potentially.
Personally I think it is that the product page is seemingly doing more than just parroting headers, and that this is what's causing the system to not transparently adjust the "spanid" to be "parentspanid" in child requests's incoming headers.
Unsure what to tell you about x-b3-sampled - it is always "1" in the logs.
Also, thanks for all the help!
venezia
on 6 Mar 2019
@venezia the one I thing I notice is that your traces never seem to set the parentSpanId. I believe that the bit in productpage app that creates a span ends up setting a parentSpanId.
Quickly checking the source code for the jaeger client, I believe ends up in this block:
https://github.com/jaegertracing/jaeger-client-python/blob/master/jaeger_client/tracer.py#L173-L174
That creates the span with a parentSpanId, which I don't believe is happening in your code.
What happens if you add that bit of logic (copying the spanId into parentSpanId in your code)?
douglas-reid
on 6 Mar 2019
@venezia i've found the bit in the envoy source code where the span id's are created/overridden. it all depends on a bit of tracing config in the outbound filter where the tracing operation is set to EGRESS.
Can you also confirm that you have a listener config in your proxy config (port-forward to 15000 and navigate to config_dump) for 0.0.0.0_80 that contains a tracing stanza that looks like:
"tracing": {
  "overall_sampling": {
    "value": 100
  },
  "random_sampling": {
    "value": 1
  },
  "operation_name": "EGRESS",
  "client_sampling": {
     "value": 100
  }
}
@venezia the other strange thing i notice in the generated logs you sent is that reporter: "destination" for all of your services. It shows up twice for each hop as "destination", but never as "source". Also odd is that your "source_app" label is never populated, but your "destination_app" label always is.
We really need to look at your envoy config to figure out what is going on.
I would also suggest rerunning, but altering the config for trace.logentry to change reporter to just be reporter: context.reporter.kind | "unknown" and adding reporterUid: context.reporter.uid | "unknown". This will help assess which filter, etc., is being applied.
douglas-reid
on 6 Mar 2019
@venezia deploying your yaml into my existing cluster, with bookinfo also deployed alongside, i'm able to generate the following:
{"level":"info","time":"2019-03-06T05:59:10.549577Z","instance":"trace.logentry.istio-system","destinationApp":"dewey","flags":"","parentSpanId":"66f98d858325c43b","reporter":"destination","requestId":"c9b0cf27-db03-4636-a072-f4fb2894872b","sampled":"0","sourceApp":"louie","spanContext":"","spanId":"6eb95c6d692babd9","traceId":"c4fa0b669dc5baa7"}
{"level":"info","time":"2019-03-06T05:59:10.550329Z","instance":"trace.logentry.istio-system","destinationApp":"dewey","flags":"","parentSpanId":"880b79bbc5eeea17","reporter":"destination","requestId":"c9b0cf27-db03-4636-a072-f4fb2894872b","sampled":"0","sourceApp":"huey","spanContext":"","spanId":"93a228e7552ad3de","traceId":"c4fa0b669dc5baa7"}
{"level":"info","time":"2019-03-06T05:59:10.563917Z","instance":"trace.logentry.istio-system","destinationApp":"dewey","flags":"","parentSpanId":"62bc476e7be8007c","reporter":"destination","requestId":"c9b0cf27-db03-4636-a072-f4fb2894872b","sampled":"0","sourceApp":"louie","spanContext":"","spanId":"8803c06f83908363","traceId":"c4fa0b669dc5baa7"}
{"level":"info","time":"2019-03-06T05:59:10.531579Z","instance":"trace.logentry.istio-system","destinationApp":"louie","flags":"","parentSpanId":"270e9af45a932c6a","reporter":"destination","requestId":"c9b0cf27-db03-4636-a072-f4fb2894872b","sampled":"0","sourceApp":"php-popularity","spanContext":"","spanId":"66f98d858325c43b","traceId":"c4fa0b669dc5baa7"}
{"level":"info","time":"2019-03-06T05:59:10.549418Z","instance":"trace.logentry.istio-system","destinationApp":"louie","flags":"","parentSpanId":"880b79bbc5eeea17","reporter":"destination","requestId":"c9b0cf27-db03-4636-a072-f4fb2894872b","sampled":"0","sourceApp":"huey","spanContext":"","spanId":"62bc476e7be8007c","traceId":"c4fa0b669dc5baa7"}
{"level":"info","time":"2019-03-06T05:59:10.546615Z","instance":"trace.logentry.istio-system","destinationApp":"dewey","flags":"","parentSpanId":"66f98d858325c43b","reporter":"source","requestId":"c9b0cf27-db03-4636-a072-f4fb2894872b","sampled":"0","sourceApp":"louie","spanContext":"","spanId":"6eb95c6d692babd9","traceId":"c4fa0b669dc5baa7"}
{"level":"info","time":"2019-03-06T05:59:10.558265Z","instance":"trace.logentry.istio-system","destinationApp":"dewey","flags":"","parentSpanId":"62bc476e7be8007c","reporter":"source","requestId":"c9b0cf27-db03-4636-a072-f4fb2894872b","sampled":"0","sourceApp":"louie","spanContext":"","spanId":"8803c06f83908363","traceId":"c4fa0b669dc5baa7"}
{"level":"info","time":"2019-03-06T05:59:10.548254Z","instance":"trace.logentry.istio-system","destinationApp":"dewey","flags":"","parentSpanId":"880b79bbc5eeea17","reporter":"source","requestId":"c9b0cf27-db03-4636-a072-f4fb2894872b","sampled":"0","sourceApp":"huey","spanContext":"","spanId":"93a228e7552ad3de","traceId":"c4fa0b669dc5baa7"}
{"level":"info","time":"2019-03-06T05:59:10.548631Z","instance":"trace.logentry.istio-system","destinationApp":"louie","flags":"","parentSpanId":"880b79bbc5eeea17","reporter":"source","requestId":"c9b0cf27-db03-4636-a072-f4fb2894872b","sampled":"0","sourceApp":"huey","spanContext":"","spanId":"62bc476e7be8007c","traceId":"c4fa0b669dc5baa7"}
{"level":"info","time":"2019-03-06T05:59:10.530653Z","instance":"trace.logentry.istio-system","destinationApp":"huey","flags":"","parentSpanId":"270e9af45a932c6a","reporter":"destination","requestId":"c9b0cf27-db03-4636-a072-f4fb2894872b","sampled":"0","sourceApp":"php-popularity","spanContext":"","spanId":"880b79bbc5eeea17","traceId":"c4fa0b669dc5baa7"}
{"level":"info","time":"2019-03-06T05:59:10.516124Z","instance":"trace.logentry.istio-system","destinationApp":"php-popularity","flags":"","parentSpanId":"c4fa0b669dc5baa7","reporter":"destination","requestId":"c9b0cf27-db03-4636-a072-f4fb2894872b","sampled":"0","sourceApp":"stream-live-service","spanContext":"","spanId":"270e9af45a932c6a","traceId":"c4fa0b669dc5baa7"}
{"level":"info","time":"2019-03-06T05:59:10.513906Z","instance":"trace.logentry.istio-system","destinationApp":"php-popularity","flags":"","parentSpanId":"c4fa0b669dc5baa7","reporter":"source","requestId":"c9b0cf27-db03-4636-a072-f4fb2894872b","sampled":"0","sourceApp":"stream-live-service","spanContext":"","spanId":"270e9af45a932c6a","traceId":"c4fa0b669dc5baa7"}
{"level":"info","time":"2019-03-06T05:59:10.503451Z","instance":"trace.logentry.istio-system","destinationApp":"stream-live-service","flags":"","parentSpanId":"","reporter":"destination","requestId":"c9b0cf27-db03-4636-a072-f4fb2894872b","sampled":"0","sourceApp":"sleep","spanContext":"","spanId":"c4fa0b669dc5baa7","traceId":"c4fa0b669dc5baa7"}
{"level":"info","time":"2019-03-06T05:59:10.502500Z","instance":"trace.logentry.istio-system","destinationApp":"stream-live-service","flags":"","parentSpanId":"","reporter":"source","requestId":"c9b0cf27-db03-4636-a072-f4fb2894872b","sampled":"0","sourceApp":"sleep","spanContext":"","spanId":"c4fa0b669dc5baa7","traceId":"c4fa0b669dc5baa7"}
This shows everything working as expected. So, I'm left wondering what is different about our environments.
douglas-reid
on 6 Mar 2019
@venezia just to show that I did get this working visually, here's output from that same test via Stackdriver Trace:
douglas-reid
on 6 Mar 2019
So I dumped the config though now it might not be all that useful.
After you showed my sample app suite was working for you, I decided to just delete istio (and bookinfo, and my previous services since any changes to the sidecar injector wouldn't be realized) and reinstall using 1.0.6. I used the same approach to installing istio ( helm install install/kubernetes/helm/istio --name istio --namespace istio-system --set tracing.enabled=true ) and proceeded to reinstall bookinfo, my sample services, and adjusting pilot to always do a trace.
Sure enough, it worked. I then tried my mixed mode grpc+rest, go+php example, and it too worked.
I'm at a loss of what was mangled in the installation, but I'm happy that it works.
Perhaps there might be some value in creating a script (or something) that would:
- deploy some sample app suite
- adjust pilot to enable tracing
- verify that a "complete" trace was sent to jaeger
- cleanup
Not that the bookinfo app isn't great, but that's more or less (to me) a lesson/interactive-exercise, while something that would give you a simple boolean that tracing is indeed working on the cluster as intended might be useful for people who want to verify that they have tracing working right.
Given that bookinfo _worked_ while my sample app did not in that installation of istio, perhaps something that literally only forwards the enumerated header list (and doesn't try to import jaeger/ot libraries like the productpage was doing - since again the docs don't say "must use jaeger/ot libraries" but rather "must forward this enumerated list of headers") ... as there may be others in the future that are deploying applications written in a language that doesn't have jaeger/ot libraries. Showing examples that use no libraries might help remove any concerns that something "magical" happened in a library for people that are having difficulties implementing the tracing in their app.
I'm willing to try to contribute something that does that, if there's any interest.
Again, thanks so much. Its rather beautiful seeing the tracing being visualized correctly when you have so many nested services.
venezia
on 6 Mar 2019
Yes, it's my understanding that we shouldn't need any client libraries at
all.
If product page uses libraries then that explains why my setup (which does
nothing more than forward) does not.
Karl
On Wed, 6 Mar 2019, 2:31 pm Michael Venezia, notifications@github.com
wrote:
So I dumped the config
https://gist.github.com/venezia/487fd0edfc7f312fce8747a62c6fdde8 though
now it might not be all that useful.After you showed my sample app suite was working for you, I decided to
just delete istio (and bookinfo, and my previous services since any changes
to the sidecar injector wouldn't be realized) and reinstall using 1.0.6. I
used the same approach to installing istio ( helm install
install/kubernetes/helm/istio --name istio --namespace istio-system --set
tracing.enabled=true ) and proceeded to reinstall bookinfo, my sample
services, and adjusting pilot to always do a trace.Sure enough, it worked. I then tried my mixed mode grpc+rest, go+php
example, and it too worked.I'm at a loss of what was mangled in the installation, but I'm happy that
it works.Perhaps there might be some value in creating a script (or something) that
would:
- deploy some sample app suite
- adjust pilot to enable tracing
- verify that a "complete" trace was sent to jaeger
- cleanup
Not that the bookinfo app isn't great, but that's more or less (to me) a
lesson/interactive-exercise, while something that would give you a simple
boolean that tracing is indeed working on the cluster as intended might be
useful for people who want to verify that they have tracing working right.Given that bookinfo worked while my sample app did not in that
installation of istio, perhaps something that literally only forwards the
enumerated header list (and doesn't try to import jaeger/ot libraries like
the productpage was doing - since again the docs don't say "must use
jaeger/ot libraries" but rather "must forward this enumerated list of
headers") ... as there may be others in the future that are deploying
applications written in a language that doesn't have jaeger/ot libraries.
Showing examples that use no libraries might help remove any concerns that
something "magical" happened in a library for people that are having
difficulties implementing the tracing in their app.I'm willing to try to contribute something that does that, if there's any
interest.Again, thanks so much. Its rather beautiful seeing the tracing being
visualized correctly when you have so many nested services.—
You are receiving this because you were mentioned.
Reply to this email directly, view it on GitHub
https://github.com/istio/istio/issues/11696#issuecomment-470118201, or mute
the thread
https://github.com/notifications/unsubscribe-auth/ABaviQqML45KnfWLat6UAv7iX8p4isD2ks5vT9EmgaJpZM4a2ff_
.
Stono
on 6 Mar 2019
@venezia Happy to hear things are working for you.
@Stono @venezia The productpage using the client library should have no impact on the tracing functionality. It wasn't that long ago that it was completely manual -- and everything still worked. Forwarding is all that is required.
The productpage sample's use of ot libraries was explicitly added to provide an example of how to use such libraries. The other services in that sample, including reviews service (which calls out), are examples of doing manual header forwarding.
What I've noticed is that, sometimes (for reasons not clear to me), restarting Pilot can cause issues with the config supplied to proxies. @venezia I can't be sure, without having seen your old cluster, but I strongly suspect your envoy config for the new proxies after you changed the sampling rate was missing the required config for outbound tracing.
@Stono I don't know if you are in the same boat or not. Hopefully, we can find out more soon.
As for the script, there is a long-standing FR for a full tracing e2e test. I agree that more validation in that area would be nice. There are already some pilot e2e tests that exercise tracing, at least superficially, but we could always use more validation.
douglas-reid
on 6 Mar 2019
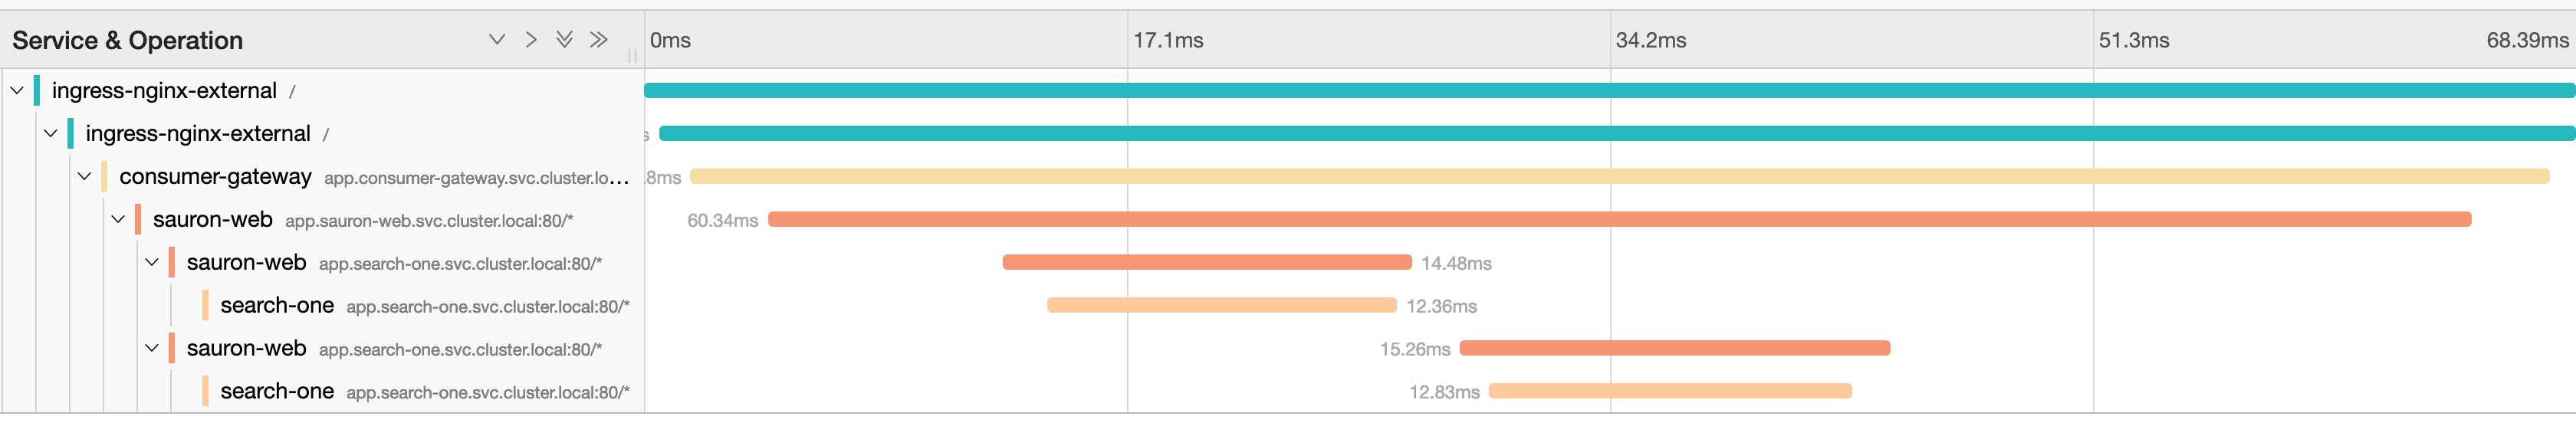
Thanks again for your time today @douglas-reid, as promised, here are the logs.
The setup here is:
[nginx | envoy] -> [envoy | consumer-gateway | envoy] -> [envoy | sauron-web | envoy]
As we demonstrated, hitting nginx directly, which invokes the nginx opentracing module, will set parentspanid on the outbound request, and we get a full trace in jaeger.
Now, if we exec into the nginx pod and directly curl consumer-gateway, thus bypassing nginx, we get the following inbound on consumer-gateway:
[2019-03-11 18:21:08.174][63][debug][http] external/envoy/source/common/http/conn_manager_impl.cc:490] [C207][S7288662475704803025] request headers complete (end_stream=true):
':authority', 'mysite'
':path', '/car-search?search-target=usedcars&advertising-location=at_cars&is-quick-search=TRUE&price-to=&price-search-type=total-price&radius=&price-from=&make=&postcode=m202be'
':method', 'GET'
'user-agent', 'curl/7.64.0'
'accept', '*/*'
'x-forwarded-proto', 'http'
'x-request-id', '7852a752-c4c5-9cb8-afb0-7c3c94c9e095'
'x-envoy-decorator-operation', 'app.consumer-gateway.svc.cluster.local:80/*'
'x-b3-traceid', '93d3a272c0072cb2'
'x-b3-spanid', '93d3a272c0072cb2'
'x-b3-sampled', '1'
'x-istio-attributes', 'Cl0KCnNvdXJjZS51aWQSTxJNa3ViZXJuZXRlczovL2luZ3Jlc3MtbmdpbngtaW50ZXJuYWwtY29udHJvbGxlci04NDdjZDc5YmNjLTc4Z2I0LmluZ3Jlc3MtbmdpbngKPwoTZGVzdGluYXRpb24uc2VydmljZRIoEiZhcHAuY29uc3VtZXItZ2F0ZXdheS5zdmMuY2x1c3Rlci5sb2NhbApEChhkZXN0aW5hdGlvbi5zZXJ2aWNlLmhvc3QSKBImYXBwLmNvbnN1bWVyLWdhdGV3YXkuc3ZjLmNsdXN0ZXIubG9jYWwKQgoXZGVzdGluYXRpb24uc2VydmljZS51aWQSJxIlaXN0aW86Ly9jb25zdW1lci1nYXRld2F5L3NlcnZpY2VzL2FwcAohChhkZXN0aW5hdGlvbi5zZXJ2aWNlLm5hbWUSBRIDYXBwCjMKHWRlc3RpbmF0aW9uLnNlcnZpY2UubmFtZXNwYWNlEhISEGNvbnN1bWVyLWdhdGV3YXk='
'x-envoy-expected-rq-timeout-ms', '10000'
'content-length', '0'
We see the following outbound request to sauron-web, note the '' parent span id:
':authority', 'app.sauron-web'
':path', '/car-search?search-target=usedcars&advertising-location=at_cars&is-quick-search=TRUE&price-to&postcode=m202be&price-search-type=total-price&radius&price-from&make'
':method', 'GET'
'x-request-id', '7852a752-c4c5-9cb8-afb0-7c3c94c9e095'
'accept', '*/*'
'x-b3-traceid', '93d3a272c0072cb2'
'x-b3-spanid', '93d3a272c0072cb2'
'x-b3-sampled', '1'
'user-agent', 'curl/7.64.0'
'x-b3-parentspanid', ''
'x-forwarded-host', 'mysite'
'x-forwarded-proto', 'https'
'cookie', 'bucket=desktop'
'x-forwarded-port', '80,80'
'x-forwarded-for', '127.0.0.1'
'x-secure', 'true'
'x-b3-flags', ''
'accept-encoding', 'gzip'
'connection', 'Keep-Alive'
We see the following inbound request on sauron-web, note the '' parent span id:
':authority', 'app.sauron-web'
':path', '/car-search?search-target=usedcars&advertising-location=at_cars&is-quick-search=TRUE&price-to&postcode=m202be&price-search-type=total-price&radius&price-from&make'
':method', 'GET'
'x-request-id', '7852a752-c4c5-9cb8-afb0-7c3c94c9e095'
'accept', '*/*'
'x-b3-traceid', '93d3a272c0072cb2'
'x-b3-spanid', '93d3a272c0072cb2'
'x-b3-sampled', '1'
'user-agent', 'curl/7.64.0'
'x-b3-parentspanid', ''
'x-forwarded-host', 'mysite'
'x-forwarded-proto', 'https'
'cookie', 'bucket=desktop'
'x-forwarded-port', '80,80'
'x-forwarded-for', '127.0.0.1'
'x-secure', 'true'
'x-b3-flags', ''
'accept-encoding', 'gzip'
'x-envoy-internal', 'true'
'x-envoy-decorator-operation', 'app.sauron-web.svc.cluster.local:80/*'
'x-istio-attributes', 'Ci0KHWRlc3RpbmF0aW9uLnNlcnZpY2UubmFtZXNwYWNlEgwSCnNhdXJvbi13ZWIKIQoYZGVzdGluYXRpb24uc2VydmljZS5uYW1lEgUSA2FwcApPCgpzb3VyY2UudWlkEkESP2t1YmVybmV0ZXM6Ly9jb25zdW1lci1nYXRld2F5LTg1ZDU0NWQ5OTctN2dzc3IuY29uc3VtZXItZ2F0ZXdheQo5ChNkZXN0aW5hdGlvbi5zZXJ2aWNlEiISIGFwcC5zYXVyb24td2ViLnN2Yy5jbHVzdGVyLmxvY2FsCj4KGGRlc3RpbmF0aW9uLnNlcnZpY2UuaG9zdBIiEiBhcHAuc2F1cm9uLXdlYi5zdmMuY2x1c3Rlci5sb2NhbAo8ChdkZXN0aW5hdGlvbi5zZXJ2aWNlLnVpZBIhEh9pc3RpbzovL3NhdXJvbi13ZWIvc2VydmljZXMvYXBw'
'x-envoy-expected-rq-timeout-ms', '10000'
'content-length', '0'
We see the following outbound request to search-one, note the '' parent span id:
':authority', 'app.search-one'
':path', '/api/v1/advert?advert_classification=standard&advertising_location=at_cars&advertising_location=at_new_cars&postcode=m202be&distance=1501&condition=New&condition=Nearly+New&condition=Used&include_finance_option=10000_1000_36&sort=sponsored-adverts-dt-asc&facet=doors_values&facet=fuel_consumption_values&facet=distance&facet=aggregated_trim&facet=advert_classification&facet=plate&facet=advertising_location&facet=insurance_group&facet=seats&facet=transmission&facet=trim&facet=price&facet=body_type&facet=seller_type&facet=model&facet=fuel_type&facet=make&facet=mileage&facet=annual_tax_values&facet=postal_region&facet=drivetrain&facet=part_exchange_available&facet=condition&facet=colour&facet=acceleration_values&facet=with_manufacturer_rrp_saving&facet=engine_size&facet=co2_emission_values&facet=year_manufactured&page=1&size=10'
':method', 'GET'
'accept', 'application/json'
'x-log-data', '{"context":"NATURAL_SEARCH_JOURNEY","channel":"CARS","device":{"ipAddress":"127.0.0.1","sessionId":"c4a29e40-75c3-4eee-a215-7c2d2dca9706","userAgent":"curl/7.64.0"},"eventSource":{"site":"AT2.0","type":"SEARCH"},"user":{"id":"70794e78-4135-40f7-8787-947312e10f7e"},"additionalParams":{},"experimentIds":["cape","binc","cchpe","mdc","caih1","dzI","dmI","nrI","dgI","dsI","OEMDC","cfpat","deT","dqI","dfT","dhcce","rdI","dpv1","pbI","paT","drI","dcT","invit1"]}'
'x-request-id', '7852a752-c4c5-9cb8-afb0-7c3c94c9e095'
'x-b3-parentspanid', ''
'x-b3-traceid', '93d3a272c0072cb2'
'x-b3-spanid', '93d3a272c0072cb2'
'x-b3-sampled', '1'
'x-b3-flags', ''
'x-include-consumer-insight', 'true'
'x-facet-links', 'false'
'x-include-vehicle-check', 'true'
'x-client-identifier', 'AT2.0'
'connection', 'Keep-Alive'
'user-agent', 'Apache-HttpClient/4.5.4 (Java/1.8.0_191)'
'accept-encoding', 'gzip,deflate'
So the problem appears to be an empty parent-span-id being sent all the way down the stack.
Now doing the same thing again, this time manually setting a parentspanid on the curl, we see the following in the inbound request on consumer-gateway:
':authority', 'mysite'
':path', '/car-search?search-target=usedcars&advertising-location=at_cars&is-quick-search=TRUE&price-to=&price-search-type=total-price&radius=&price-from=&make=&postcode=m202be'
':method', 'GET'
'user-agent', 'curl/7.64.0'
'accept', '*/*'
'x-b3-parentspanid', 'd7e6163bac8f6393'
'x-forwarded-proto', 'http'
'x-request-id', 'c76f512e-554c-9002-8a98-ff75076f085d'
'x-envoy-decorator-operation', 'app.consumer-gateway.svc.cluster.local:80/*'
'x-b3-traceid', '38645eec2a84d271'
'x-b3-spanid', '38645eec2a84d271'
'x-b3-sampled', '1'
'x-istio-attributes', 'CkQKGGRlc3RpbmF0aW9uLnNlcnZpY2UuaG9zdBIoEiZhcHAuY29uc3VtZXItZ2F0ZXdheS5zdmMuY2x1c3Rlci5sb2NhbApCChdkZXN0aW5hdGlvbi5zZXJ2aWNlLnVpZBInEiVpc3RpbzovL2NvbnN1bWVyLWdhdGV3YXkvc2VydmljZXMvYXBwCiEKGGRlc3RpbmF0aW9uLnNlcnZpY2UubmFtZRIFEgNhcHAKMwodZGVzdGluYXRpb24uc2VydmljZS5uYW1lc3BhY2USEhIQY29uc3VtZXItZ2F0ZXdheQpdCgpzb3VyY2UudWlkEk8STWt1YmVybmV0ZXM6Ly9pbmdyZXNzLW5naW54LWludGVybmFsLWNvbnRyb2xsZXItODQ3Y2Q3OWJjYy03OGdiNC5pbmdyZXNzLW5naW54Cj8KE2Rlc3RpbmF0aW9uLnNlcnZpY2USKBImYXBwLmNvbnN1bWVyLWdhdGV3YXkuc3ZjLmNsdXN0ZXIubG9jYWw='
'x-envoy-expected-rq-timeout-ms', '10000'
'content-length', '0'
We see the following outbound request to sauron-web, note the correctly updated parent-span-id:
':authority', 'app.sauron-web'
':path', '/car-search?search-target=usedcars&advertising-location=at_cars&is-quick-search=TRUE&price-to&postcode=m202be&price-search-type=total-price&radius&price-from&make'
':method', 'GET'
'x-request-id', 'c76f512e-554c-9002-8a98-ff75076f085d'
'x-b3-parentspanid', 'd7e6163bac8f6393'
'accept', '*/*'
'x-b3-traceid', '38645eec2a84d271'
'x-b3-spanid', '38645eec2a84d271'
'x-b3-sampled', '1'
'user-agent', 'curl/7.64.0'
'x-forwarded-host', 'mysite'
'x-forwarded-proto', 'https'
'cookie', 'bucket=desktop'
'x-forwarded-port', '80,80'
'x-forwarded-for', '127.0.0.1'
'x-secure', 'true'
'x-b3-flags', ''
'accept-encoding', 'gzip'
'connection', 'Keep-Alive'
And we see the same in sauron-web to search-one (the parent span id correctly updated with the current span.
In writing this.... I think I may have had a eureka moment. If consumer-gateway is forwarding parent-span-id, but parent span id is empty, that is the '', and then that is being passed down all the way!
so I think there are two angles here:
- I bet you can reproduce this by doing a request on bookinfo with
parent-span-idset to'', envoy should probably disregard this because people will just be blindly forwarding headers! - I'll add some
if req.headers[parent] !== null the outbound_headers[parent] === req.headerskinda stuff in consumer-gateway and see if it magically resolves the issues, however i'd rather everyone didn't need conditional logic in their header forwarding.
Stono
on 11 Mar 2019
@objectiser any thoughts here? If an app explicitly sets a parent span id of "", what is the expected behavior? I would have expected it not to matter, as the Envoy code _should_ replace it given the other headers, but that seems to not be happening in this case.
douglas-reid
on 11 Mar 2019
@douglas-reid @Stono The parent span id shouldn't be manually set, as it would essentially provide misleading information at the tracing backend. The information provided shows the root span (i.e. where both the trace and span id are the same), so it shouldn't have a parent span id.
The parent span id will be set appropriately once the next child span is created within the envoy proxy.
Can the same test (using curl from nginx pod) be performed using 1.1 (assuming it wasn't already using that version?) - as shared span context was disabled in that version.
 objectiser
on 11 Mar 2019
objectiser
on 11 Mar 2019
I can't replicate on 1.1 unfortunately, I'm on 1.0.6. The problem should be easily testable by you on 1.1 by manually setting that header to an empty value. We only manually set the header for the purposes of the test to prove something out, that isn't typical behaviour - it's replicating what i think is happening in the outbound request of consumer-gateway.
I do think I get what you're saying, but think from the consumers perspective, we're telling people to blindly forward headers, in the case where the incoming request has no x-b3-parentspanid (eg the initial span) then they're forwarding on x-b3-parentspanid: "", this is then being passed all the way down the stack as an empty value, never actually being updated as you say it would be.
In an ideal world, those apps should probably have only be forwarding x-b3-parentspanid if it's empty on the incoming request, but in reality they won't, and we don't want to need to have them having to put conditional logic into their app.
So in reality what we need is for envoy to treat x-b3-parentspanid: "", as if it isn't there at all, remove it if its empty and set it to the correct value when required.
Stono
on 11 Mar 2019
@Stono One thing I am not clear about with your comment
We see the following outbound request to sauron-web, note the correctly updated parent-span-id:
The inbound request to consumer-gateway and outbound request to sauron-web have exactly the same trace, span and parentspan ids. So this is just the service propagating the headers - same as when the empty parentspan id was being propagated.
The outbound request should be creating a new child span, with a different span id, with the current span id now being parentspan id of that child span. So for some reason the envoy proxy is not creating new spans on the outbound requests. All that is happening is the headers are being transparently passed through the proxies and services.
@douglas-reid Any thoughts on why tracing would be disabled? Are the endpoints using httos - as that would result in no tracing (I believe)?
objectiser
on 11 Mar 2019
@objectiser I don't have any real thoughts on why tracing would be disabled. I've just tried to verify on my own 1.0.6 cluster and am seeing the following behavior.
I set up two namespaces, one with bookinfo (injected) and one with sleep (not injected). I ran the following command:
kubectl -n sleep exec -it sleep-7ffd5cc988-r9r2x -- curl -v -S -o /dev/null -H "x-b3-parentspanid: ''" http://productpage.default:9080/productpage
And see all of the correct trace bits. productpage is using OT (w/ jaeger) client libs now.
However, if I go to reviews instead of productpage, I can see this behavior when setting the parent span id.
kubectl -n sample exec -it sleep-7ffd5cc988-r9r2x -- curl -v -S -o /dev/null -H "Host: reviews.default" -H "x-b3-sampled: 1" -H "x-b3-parentspanid: ''" http://reviews.default:9080/reviews/0
v.
kubectl -n sample exec -it sleep-7ffd5cc988-r9r2x -- curl -v -S -o /dev/null -H "Host: reviews.default" -H "x-b3-sampled: 1" http://reviews.default:9080/reviews/0
So, something about parentspan not being nil but being empty is creating an impact when blind forwarding is occurring, it seems (for at least 1.0.6).
douglas-reid
on 11 Mar 2019
@douglas-reid Are you able to try the same test in 1.1 to see if it has the same problem? Probably won't be reproduced, because shared span context is disabled, so the inbound request would have a new span created. But might be worth confirming.
objectiser
on 11 Mar 2019
@objectiser I can try with 1.1 in a bit.
I think this is the applicable code chunk from the 1.0.6 envoy version:
douglas-reid
on 11 Mar 2019
Was wondering if https://github.com/envoyproxy/envoy/blob/2d8386532f68899ca1fe6476dc458b0df1260b29/source/extensions/tracers/zipkin/zipkin_tracer_impl.cc#L123 may be the cause - if the parentspan id is set, but not a 64 bit id, then would return a null (noop) span - which would then cause problems creating a child span for the outbound request.
objectiser
on 11 Mar 2019
Ah, yes... that seems to make more sense. What does that look like for 1.1 ?
douglas-reid
on 11 Mar 2019
@douglas-reid Might have the same problem: https://github.com/envoyproxy/envoy/blob/7b4675d184c661a24634207f914112d083f640da/source/extensions/tracers/zipkin/span_context_extractor.cc#L109
Sorry need to sign off for tonight - if you get a chance to try it out with 1.1 to confirm one way or the other, if it is a problem I will try to get a fix in envoy for 1.1 asap.
objectiser
on 11 Mar 2019
@objectiser I can verify that this exists in 1.1 as well.
douglas-reid
on 11 Mar 2019
@douglas-reid Fix has been merged https://github.com/envoyproxy/envoy/commit/8912fa36acdf4367d37998d98cead376762d2b49 but not clear whether this is too late for 1.1? The last envoy sha used by istio proxy was from 8th Feb.
objectiser
on 12 Mar 2019
@objectiser thanks a bunch for the quick turnaround! I suspect that this is too late for 1.1, given that pulling in an updated proxy after all of the testing seems a bit risky.
/cc @duderino for comment.
douglas-reid
on 12 Mar 2019
What would be the suggested workaround to use in Istio 1.0 / 1.1 deployments given that the fix won't make it into 1.1? Manually propagating the parentspan id header in each service to service call?
 ykoyfman
on 13 Mar 2019
ykoyfman
on 13 Mar 2019
@ykoyfman Propagating the x-b3-parentspan-id would need to be conditional on it having a real value. So if it is an empty string, then it should not be propagated.
objectiser
on 13 Mar 2019
So what we've done, which isn't perfect, is have our edge applications that take the client traffic use an opentracing library to instantiate a trace correctly. So we get traces from the edge down.
Doesn't work for intra-mesh stuff though.
Stono
on 13 Mar 2019
@Stono Before forwarding B3 propagation headers, are you checking if they have real values?
Tested it in 1.1.0-rc.0 for intra-mesh scenario and it works fine if you only forward non-empty headers.
Deployed this example to test it: Istio101 repo
Check Lines 67-72 where it checks if the headers are present before forwarding them.
I have called frontend pod using curl http://frontend from inside another pod and it generated traces for the trace frontend --> middleware --> backend --> external URL
vijaykumark
on 14 Mar 2019
@Stono To clarify - edge application sets x-b3-* headers before traffic even reaches the ingress gateway?
So what we've done, which isn't perfect, is have our edge applications that take the client traffic use an opentracing library to instantiate a trace correctly. So we get traces from the edge down.
ykoyfman
on 14 Mar 2019
Nono I don't use ingress-gateway. TBH my use case / work around is probably too specific to my infrastructure to help you out @ykoyfman
@vijaykumark yes if we have the app devs check the content of headers not to be nil or empty that fixes the problem, my issue is that they will not, they'll just (and are) blinding forward them.
Looks like it's resolved now anyway, but will probably have to wait for 1.1.1 to see it.
@douglas-reid is there a 1.1.1 PR or issue that I can track for this? As you say, it'd be an envoy upgrade
Stono
on 14 Mar 2019
@Stono this should be resolved in 1.1.1. Can you confirm? I'd like to close this out.
douglas-reid
on 27 Mar 2019
Will try and test it later today for you @douglas-reid - ta!
Stono
on 27 Mar 2019
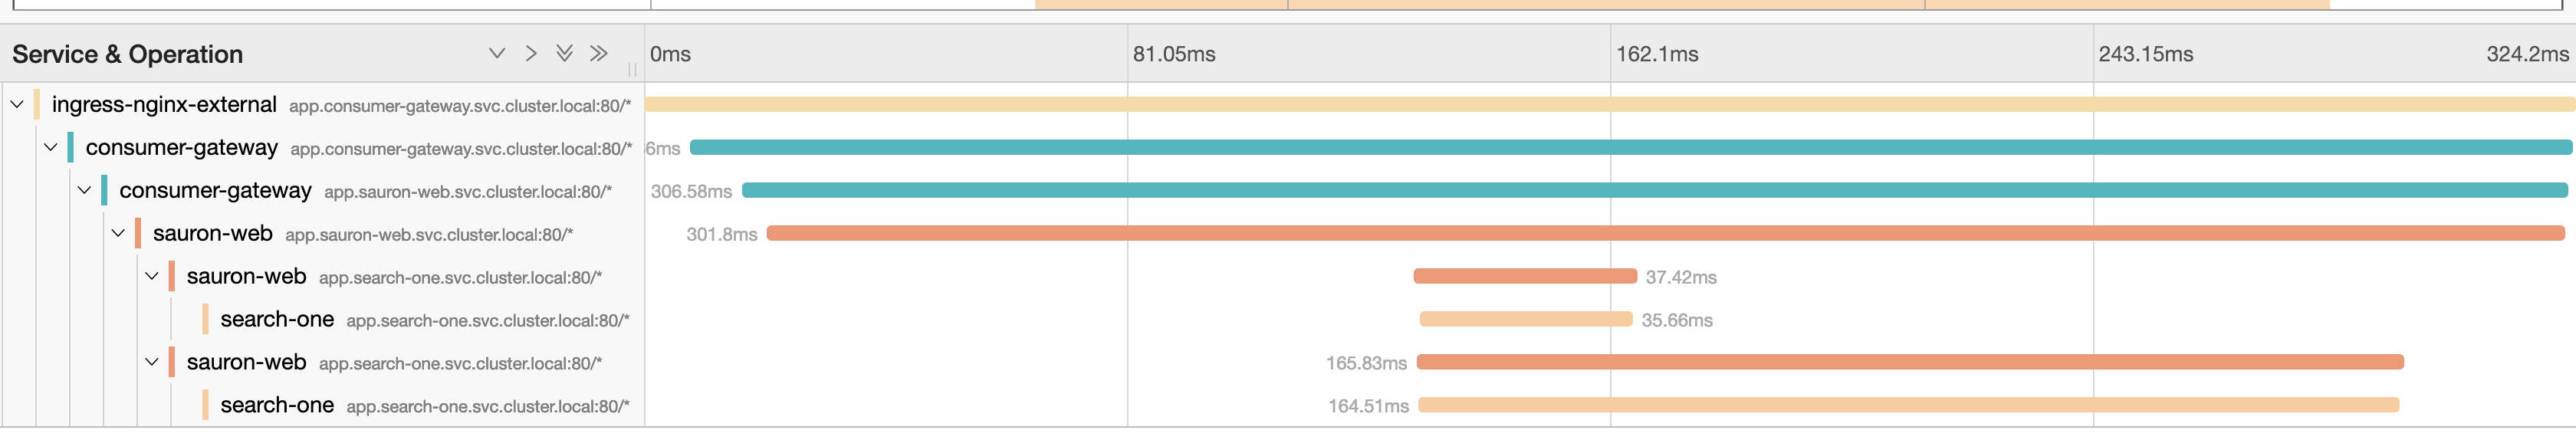
yayyy fixed. Thanks @douglas-reid and @objectiser
Stono
on 28 Mar 2019
We had a related issue, and submitted a fix to the node client:
https://github.com/jaegertracing/jaeger-client-node/pull/305
 m1o1
on 5 Apr 2019
m1o1
on 5 Apr 2019
I'm encountering a similar problem when trying to propagate gRPC requests across services. I am using go and github.com/grpc-ecosystem/go-grpc-middleware/tracing/opentracing middleware to propagate gRPC headers throughout the request. Can Istio/Envoy propagate gRPC headers for you or does it only work for HTTP 1.1?
 triplewy
on 24 Mar 2020
triplewy
on 24 Mar 2020
I'm using ingress-nginx instead of Istio gateway (due to that I need to have external auth, which Istio currently doesn't support) and traces don't get collected to Jaeger. The traffic flow is like so:
ingress-nginx -> service1 -> service2 -> service3
There is an Envoy sidecar on the ingress-nginx and every service pod. For the services, I only forward the tracing headers as instructed here https://istio.io/latest/docs/tasks/observability/distributed-tracing/overview/ . However, when I tried the Bookinfo example on the same cluster, the traces for all of its services (productpage, ratings, reviews etc) get collected properly.
Some info about my cluster:
- EKS
- Istio 1.7 with demo profile
@Stono From your comments in other issues, it looks like you're also using ingress-nginx at the edge, have you got similar issues? These are the headers I got from service1 before I forward them to service2:
{
  host: 'service1.default.svc.cluster.local',
  'x-request-id': 'f91879fea8e0ca51789a28c63638e6ce',
  'x-real-ip': '82.203.153.234',
  'x-forwarded-for': '82.203.153.234',
  'x-forwarded-host': 'd606ec7f53b3a4767a14fb134b648003-164176fd6fc21b2c.elb.us-east-1.amazonaws.com',
  'x-forwarded-port': '80',
  'x-forwarded-proto': 'http',
  'x-scheme': 'http',
  pragma: 'no-cache',
  'cache-control': 'no-cache',
  accept: 'application/json, text/plain, */*',
  'user-agent': 'Mozilla/5.0 (Macintosh; Intel Mac OS X 10_15_6) AppleWebKit/537.36 (KHTML, like Gecko) Chrome/86.0.4240.111 Safari/537.36',
  origin: 'http://localhost:3000',
  referer: 'http://localhost:3000/',
  'accept-encoding': 'gzip, deflate',
  'accept-language': 'en-US,en;q=0.9,vi;q=0.8',
  'x-envoy-attempt-count': '1',
  'content-length': '0',
  'x-forwarded-client-cert': 'By=spiffe://cluster.local/ns/default/sa/default;Hash=4c607e5595332e2af7e48eac1456c65c140e6302b813bc90e3a2e76aa2c5f693;Subject="";URI=spiffe://cluster.local/ns/ingress-nginx/sa/ingress-nginx',
  'x-b3-traceid': 'e389edd90eb01646b315ac217066fea1',
  'x-b3-spanid': 'd2efe67ac3a308c1',
  'x-b3-parentspanid': 'b315ac217066fea1',
  'x-b3-sampled': '0'
}
 ngocketit
on 29 Oct 2020
ngocketit
on 29 Oct 2020
One thing I noticed is that x-b3-sampled is always zero. Looking into this https://stackoverflow.com/questions/63507749/x-b3-sampled-header-is-always-set-to-0-when-accessing-service-through-ingress-co and it seems it's somehow related to the x-request-id format but what I don't understand is that since Envoy generates request id, why doesn't it put it in the correct UUID format.
ngocketit
on 29 Oct 2020
Hi @ngocketit - yes I use ingress-nginx, the way we have it configured though is to set istios trace sampling to 0, and then instantiate traces on ingress-nginx using opentracing. nginx will then create the trace and initial span and set b3-sampled:1, and then the downstream envoys will report the spans.
[ user ]-> [ nginx | sidecar-out ] -> [ sidecar-in | app | sidecar-out ] -....->
Stono
on 29 Oct 2020
@Stono Thanks for your comment but isn't that enabling opentracing in ingress-nginx will bypass Istio & Envoy tracing capability because as shown in the guide, you need to specify tracer backend agent host that ingress-nginx will send traces to? What I'd like to have is tracing being handled automatically by Istio. Currently with my setup, it doesn't work because as I said in my previous comment, there seems to be an issue with x-request-id generated by ingress-nginx (sorry I thought it was generated by the Envoy sidecar that comes along side ingress-nginx, but it's not), which is not a valid UUID string. If I provide a valid UUID for x-request-id header from client then everything works.
ngocketit
on 29 Oct 2020
I think I may have figured it out. By setting generate-request-id to false in ConfigMap, ingress-nginx won't generate a random ID and instead that would be taken care of by Envoy sidecar.
ngocketit
on 29 Oct 2020
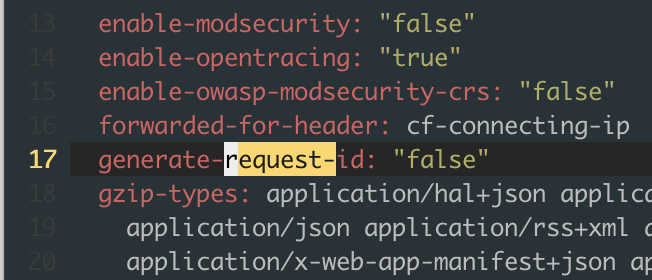
:)
Stono
on 29 Oct 2020
Related issues
 hzxuzhonghu
·
96Comments
hzxuzhonghu
·
96Comments
 prune998
·
65Comments
prune998
·
65Comments
 yacut
·
73Comments
Stono
·
65Comments
yacut
·
73Comments
Stono
·
65Comments
 lanceliuu
·
82Comments
lanceliuu
·
82Comments
Most helpful comment
I've tried doing distributed tracing a few times (different languages, rest+grpc, rest-only, grpc-only) - each resulting in a similar issue - all requests show up in the trace, but the inheritance isn't right.
Of course it works right for the bookinfo app, and I'm parroting the same headers to child requests that the sample app is, so I'm at a loss as to what I'm doing wrong.
What makes it weirder is that it tends to be "more correct" if you don't go through the ingress gateway to start the trace.
I'm using istio 1.0.5, no mtls enabled, but obviously tracing is enabled. Running k8s 1.13.3 At this point I've created some dummy services, with a deployment yaml so I can easily share them, if you have any time on slack (although I would need an invite seemingly)
Mike