Apexcharts.js: candlesticks : How to remove empty dates ?
I try to remove spaces (week-end dates...) but without success. Is that a bug or am I missing an option ? Thanks for support.
 khyoz
khyoz
All 12 comments
Any solution to this? I need to do this as well.
 munroe7
on 21 Sep 2019
munroe7
on 21 Sep 2019
Best if you attach a link to a codepen showing your issue.
Have you tried feeding apexcharts a series that does not include dates with no values?
 azivkovi
on 21 Sep 2019
azivkovi
on 21 Sep 2019
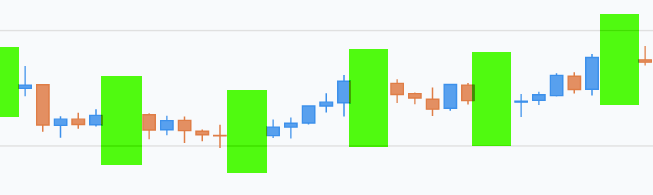
I don't have data with no values. If I pull monthly data for a stock, it's not going to have values for the weekends so my data will have blanks for weekend days like shown above in lime green because the x value represents time.
munroe7
on 21 Sep 2019
Can you post a codepen with your issue replicated? I use apexcharts for trade data as well and don't have this issue.
azivkovi
on 24 Sep 2019
So I just tried with codepen and the issue isn't happening. I am using the package react-apexcharts in my project and I am getting the gaps. The bug must be related to the react component.
munroe7
on 24 Sep 2019
Hopefully this works. Here is the react package with the gaps. Same data and options:
https://codesandbox.io/s/react-basic-example-nsu73
munroe7
on 24 Sep 2019
I figured it out. Instead of passing newDate(candlestick[i].date), I pass the date as a string and modified the xaxis to remove the labels
munroe7
on 24 Sep 2019
@munroe7
What did you modify in the x-axis? Are you still using xaxis.type: 'datetime' ?
 junedchhipa
on 31 Dec 2019
junedchhipa
on 31 Dec 2019
I have this issue and I'd be interested in solutions if anyone has any.
@munroe7 can you please detail your solution a bit more?
@junedchhipa is there a proper documented solution for this without manual modification to xticks?
I'm using xaxis.type as datetime and my data format is of the format [Timestamp, O, H, L, C]. Example: [1544204340000, 3.915, 3.932, 3.536, 3.932]
Edit: uploaded my own fiddle with a sample of the data I'm working with: https://jsfiddle.net/pavitrakumar/oy97h3vq/
Another issue is, when I try to pan the chart just blanks out - I don't know what happens, but I can't do anything until I click on the home button. Only zoom functionality works.
 pavitrakumar78
on 11 Jan 2020
pavitrakumar78
on 11 Jan 2020
@pavitrakumar78 and @junedchhipa I haven't worked on this project in a while but here's what I did:
Setup the options and data for chart.
I was using react so both of these were defined in my state. Notice how my data array contains objects with x and y. For x, you pass the date value as a string and for y, you pass open, high, low, close as numbers.
options: {
tooltip: {
x: {
show: true,
format: 'dd MMM',
formatter: function (value) {
return value;
}
}
},
xaxis: {
type: "category",
labels: {
formatter: function (value) {
return "";
}
}
},
yaxis: {
tooltip: {
enabled: true
}
}
},
series: [{
name: "test",
data: [{
x: "2019-10-11",
y: 10.25, 13.26, 9.50, 12.50
},
{
x: "2019-10-12",
y: 12.50, 13.51, 12.25, 12.98
}]
}]
Then I simply import my chart with React and assign state data:
<ApexChart
type="candlestick"
options={this.state.options}
series={this.state.series}
/>
And here is what it looks like:

munroe7
on 14 Jan 2020
@munroe7 Thanks for the explanation!
So, you've used category instead of datetime type and kept the x-axis values as string itself.
Was panning working for you? I've attached a link to a fiddle in my last comment and in that I was not able to get pan to work for a basic chart even with type as datetime.
pavitrakumar78
on 14 Jan 2020
One way is to convert the datetime xaxis to category and modify the series format. Also, use a custom datetime formatter to format the dates.
<script src="https://cdnjs.cloudflare.com/ajax/libs/dayjs/1.8.17/dayjs.min.js"></script>
series: [{
  data: [
    {
      x: new Date(1538778600000),
      y: [6629.81, 6650.5, 6623.04, 6633.33]
    },
    {
      x: new Date(1538780400000),
      y: [6632.01, 6643.59, 6620, 6630.11]
    },
    {
      x: new Date(1538782200000),
      y: [6630.71, 6648.95, 6623.34, 6635.65]
    },
  ]
}],
xaxis: {
  type: 'category',
  labels: {
    formatter: function(val) {
      return dayjs(val).format('MMM DD HH:mm')
    }
  }
}
This way, zooming will also work and there will be no empty dates.
Make sure to use the latest version 3.15.0
Here is a full example - https://apexcharts.com/javascript-chart-demos/candlestick-charts/category-x-axis/
junedchhipa
on 14 Jan 2020
Related issues
 tforssander
·
24Comments
tforssander
·
24Comments
 sdq-sts
·
15Comments
sdq-sts
·
15Comments
 dougnewnham
·
18Comments
dougnewnham
·
18Comments
 stalnikar
·
13Comments
stalnikar
·
13Comments
 astone2014
·
15Comments
astone2014
·
15Comments
Most helpful comment
One way is to convert the datetime xaxis to category and modify the series format. Also, use a custom datetime formatter to format the dates.
This way, zooming will also work and there will be no empty dates.
Make sure to use the latest version 3.15.0
Here is a full example - https://apexcharts.com/javascript-chart-demos/candlestick-charts/category-x-axis/