Hello
Is it possible to have "cumsum" operator that I can use together with bining to produce a cumulative histogram?
Thank you
 hugo-pires
All 19 comments
https://altair-viz.github.io/user_guide/transform.html#window-transform supports this.
There are a bit more examples in Vega-Lite docs -- you can adapt cumulative average to make cumulative sum.
 kanitw
on 28 May 2018
kanitw
on 28 May 2018
It would be good to add an Altair example of a cumulative histogram
 jakevdp
on 28 May 2018
jakevdp
on 28 May 2018
Thank you both. But I have the same question: is there any cumsum operator that I can use?
hugo-pires
on 28 May 2018
I'd be happy to work on adding one. Is there a simple example out there in Vega or elsewhere you'd recommend working off?
 palewire
on 28 May 2018
palewire
on 28 May 2018
You could take an example from this item on seaborn documentation:
https://seaborn.pydata.org/generated/seaborn.distplot.html
or this question on Stackoverflow:
https://stackoverflow.com/questions/39297523/plot-cdf-cumulative-histogram-using-seaborn-python
hugo-pires
on 28 May 2018
It seems to me that there is also a need for a very simple cumulative total example in our line charts.
At my day job at the Los Angeles Times, I edited a story a few weeks ago about the flood of "Super PAC" money rushing into California's looming primary for governor.
Here's a chart that ran with that story.
If there's not a good data set in vega_datasets currently for a "cumsum" line chart, this could make a good candidate. It's small, it's simple, it clearly fits the example.
palewire
on 28 May 2018
The other issue is that the window transform API is currently very low-level and pretty painful to use (for example, it requires an as attribute which has to be passed as a kwarg dict because as is a keyword in Python) so it might be better to wait on user-facing examples until we have a better story for that.
jakevdp
on 29 May 2018
850 is where we're tracking window transform syntax.
jakevdp
on 29 May 2018
Okay. Let's wait for the syntax to settle.
On Mon, May 28, 2018, 8:04 PM Jake Vanderplas notifications@github.com
wrote:
850 https://github.com/altair-viz/altair/issues/850 is where we're
tracking window transform syntax.
—
You are receiving this because you commented.
Reply to this email directly, view it on GitHub
https://github.com/altair-viz/altair/issues/902#issuecomment-392640070,
or mute the thread
https://github.com/notifications/unsubscribe-auth/AAAnCd4dqZdzCGohUIr6hgu_S_5Qlg3Cks5t3Lq5gaJpZM4UP6zM
.
palewire
on 29 May 2018
I think this article could be also very interesting for the discussion:
https://www.circonus.com/2018/05/effective-management-of-high-volume-numeric-data-with-histograms/
hugo-pires
on 29 May 2018
FYI, I'm adding cumulative frequency plot to Vega-Lite https://github.com/vega/vega-lite/pull/3833
kanitw
on 31 May 2018
Where can I find the vega-lite example? Can I use it on Altair?
hugo-pires
on 9 Jun 2018
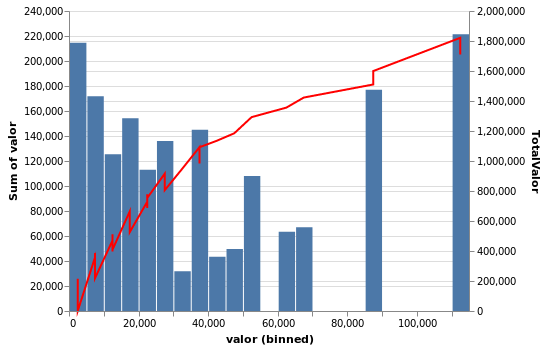
I guess I am almost there:
hist = alt.Chart(clientes).mark_bar().encode(
alt.X("valor:Q", bin=alt.Bin(maxbins=50)),
y='sum(valor)'
)
soma = alt.Chart(clientes).mark_line(color='red').transform_window(
window=[alt.WindowFieldDef(op='sum', field='valor', **{'as': 'TotalValor'})],
frame=[None, 0],
sort=[{"field": "valor", "order": "ascending"}]
).encode(
alt.X("valor:Q", bin=alt.Bin(maxbins=50)),
y='TotalValor:Q'
)
alt.layer(
hist,
soma
).resolve_scale(
y='independent'
)
Here is the result
hugo-pires
on 10 Jun 2018
@hugo-pires the example is in the posted PR: https://github.com/vega/vega-lite/pull/3833
kanitw
on 11 Jun 2018
I am sorry but I still need some help to "smooth" the red cumulative line. I also had some questions to "translate" @kanitw example to Altair. Could you help me?
Thank you
hugo-pires
on 17 Jun 2018
Some more ideas:
https://realpython.com/python-histograms/
hugo-pires
on 3 Jul 2018
@hugo-pires , better late than never. If you drop the bin on your soma chart, it should work. Here's one I did:
cumu = alt.Chart(df_totals).mark_line(color='black', interpolate='step-after').transform_joinaggregate(
    total='count(*)'
).transform_calculate(
    pct='1 / datum.total'
).transform_window(
    frame=[None, 0],
    sort=[{"field": "return"}],
    cumu='sum(pct)'
).encode(
    alt.X("return:Q")),
    alt.Y('cumu:Q', axis=alt.Axis(title='Cumulative Likelihood'))
).properties(
    title='Distribution of Inflation Adjusted S&P 500 Returns (CAGR)',
    width=700,
    height=450
)

(hist + cumu).resolve_scale(y='independent')

 kdunn926
on 15 Feb 2020
kdunn926
on 15 Feb 2020
Thank you @kdunn926
hugo-pires
on 16 Feb 2020
Related issues
 dzonimn
·
3Comments
dzonimn
·
3Comments
 jtbaker
·
3Comments
jtbaker
·
3Comments
 DentonGentry
·
3Comments
DentonGentry
·
3Comments
 tonylee3399
·
3Comments
tonylee3399
·
3Comments
 Juan-132
·
3Comments
Juan-132
·
3Comments
Most helpful comment
@hugo-pires , better late than never. If you drop the
binon yoursomachart, it should work. Here's one I did: