Dear all,
first I want to say that I love Altair's logic of creating charts!
Now the issue: I have concatenated several charts to a 2x2 plot and need the (single) legend to be placed below the entire 2x2 plot. Is there a way of doing so in Altair? I really don't want to have to redo plotting in matplotlib (using fig.legend or bbox_to_anchor as proposed for such cases) or other packages.
Best, Maximilian
 maxgerma
All 3 comments
You can see the available options for controlling the legend appearance in the documentation for alt.Legend, which should be passed as an argument to the color encoding, for example:
chart.encode(
#...
color=alt.Color('value', legend=alt.Legend(orient='right'))
#...
)
The available options for controlling the legend appearance are relatively limited in the current release of Altair; these will be greatly expanded in Altair v3, which is built on Vega-Lite 3 (you can read about the options in Vega-Lite 3 in the vega-lite docs).
Once vega-lite 3 is released, we will work on an Altair release that will also provide these options.
 jakevdp
on 9 Feb 2019
jakevdp
on 9 Feb 2019
Thanks for the prompt reply. I am looking forward to the next release then.
maxgerma
on 9 Feb 2019
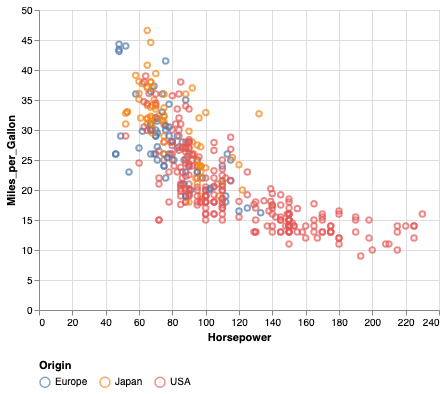
In Altair 3, the current release, you can use orient='bottom'. For example
import altair as alt
from vega_datasets import data
cars = data.cars()

alt.Chart(cars).mark_point().encode(
  x='Horsepower',
  y='Miles_per_Gallon',
  color='Origin'
).configure_legend(
  orient='bottom'
)
jakevdp
on 26 May 2019
Related issues
 firasm
·
3Comments
firasm
·
3Comments
 tonylee3399
·
3Comments
tonylee3399
·
3Comments
 morberg
·
3Comments
morberg
·
3Comments
 dzonimn
·
3Comments
dzonimn
·
3Comments
 zanarmstrong
·
4Comments
zanarmstrong
·
4Comments
Most helpful comment
In Altair 3, the current release, you can use
orient='bottom'. For example