Altair: Legend for layered series inconsistency and unexpected behaviour
Hi, I am not sure how the legend should work for layered series. If color is used I get the following behaviour:
# data
x = np.linspace(0, 12 * np.pi, 100)
scales = [0.33, 0.66, 1, 1.33, 1.66]
dfs = [
    pd.DataFrame({'x': x,
                  'sin(x)': np.sin(x / 5) * scale,
                  'cos(x)': np.cos(x / 5) * scale + 0.20,
                  'sin_scale': [scale] * len(x),
                  'cos_scale': [scale + 0.20] * len(x)
                 }) for scale in scales]

data = pd.concat(dfs, ignore_index=True, sort=False)
```python
charts
sin = alt.Chart(data).mark_line(strokeWidth=3).encode(
x='x',
y='sin(x)',
color=alt.Color('sin_scale:O',
scale=alt.Scale(scheme='blues'),
legend=alt.Legend(title='sin scale', format='.3f'))
)
cos = alt.Chart(data).mark_line(strokeWidth=3).encode(
x='x',
y='cos(x)',
color=alt.Color('cos_scale:O',
scale=alt.Scale(scheme='reds'),
legend=alt.Legend(title='cos scale', format='.3f'))
)
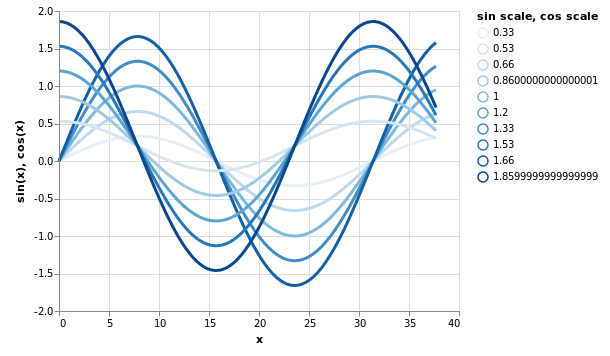
While `sin` and `cos` will have proper legends and colours, the resulting layered `sin+cos` will result in a single colour with an aggregated legend. However these are two different series, shouldn't the colours and the legend be preserved for each of them?
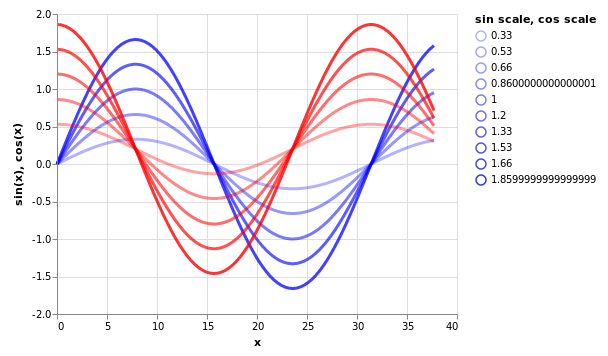
Using `opacity` at least preserves the colours (unfortunately not the legends):
```python
sin = alt.Chart(data).mark_line(strokeWidth=3, color="blue").encode(
x='x',
y='sin(x)',
opacity=alt.Opacity('sin_scale:O',
#scale=alt.Scale(scheme='blues'),
legend=alt.Legend(title='sin scale', format='.3f'))
)
cos = alt.Chart(data).mark_line(strokeWidth=3, color='red').encode(
x='x',
y='cos(x)',
opacity=alt.Opacity('cos_scale:O',
#scale=alt.Scale(scheme='reds'),
legend=alt.Legend(title='cos scale', format='.3f'))
)
Ideally shouldn't the resulting legend list the different scale values under each legend title with its respective colour?
 floringogianu
All 3 comments
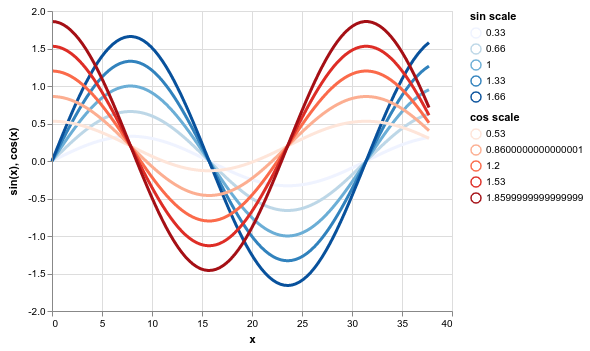
When you combine multiple charts by layering or concatenation, their scales will be shared by default. If you'd like the scales to be independent, you can specify that with resolve_scale.
From your top plot:
(sin + cos).resolve_scale(color='independent')
 jakevdp
on 15 Mar 2019
jakevdp
on 15 Mar 2019
I apologise for replying late to this.
Yes, that's exactly what I needed. I'll look how it is discussed in the documentation and if I can improve it because it seems to me it's an important use-case - see for example lineplot in seaborn which lets you have different series with different colours.
Your solution solves my issue so feel free to close it if you consider the default behaviour is unproblematic (I do not have enough experience with the library to judge this :) ).
floringogianu
on 19 Mar 2019
The default behavior is determined by Vega-Lite, so it's not really a discussion to be had here.
I do think shared scales are one place where the documentation is currently pretty lacking, so any contribution there would be very welcome.
jakevdp
on 19 Mar 2019
Related issues
 SuperShinyEyes
·
3Comments
SuperShinyEyes
·
3Comments
 Juan-132
·
3Comments
Juan-132
·
3Comments
 firasm
·
3Comments
firasm
·
3Comments
 galloramiro
·
3Comments
galloramiro
·
3Comments
 bmcfee
·
3Comments
bmcfee
·
3Comments
Most helpful comment
When you combine multiple charts by layering or concatenation, their scales will be shared by default. If you'd like the scales to be independent, you can specify that with
resolve_scale.From your top plot: