Altair: data transform in a repeated chart
Hello!
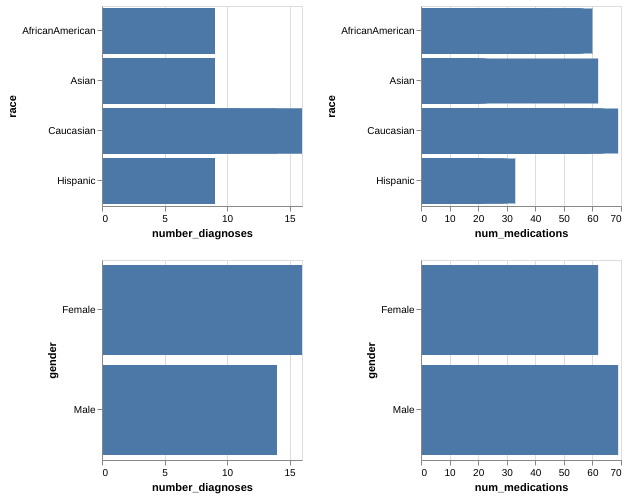
I'm trying to generate a repeated chart with data transformation.
This works just fine:
```Python
alt.Chart(data_sample).mark_bar().encode(
alt.X(alt.repeat("column"), type='quantitative'),
alt.Y(alt.repeat("row"), type='nominal')
).properties(
width=200,
height=200
).repeat(
row=['race', 'gender'],
column=['number_diagnoses','num_medications'],
)
````
But this doesn't work:
```Python
alt.Chart(data_sample).mark_bar().encode(
alt.X(alt.repeat("column"), type='quantitative'),
alt.Y(alt.repeat("row"), type='nominal')
).properties(
width=200,
height=200
).repeat(
row=['race', 'gender'],
column=['mean(number_diagnoses)','mean(num_medications)'],
)
````

I'm believe that Altair reads the 'mean(number_diagnoses)' as the literal name of the column, so I can't find any data. My question is how to incorporate the transform in the chart (looks like alt.repeat() doesn't take more arguments than column/row and type).
I'm using Altair 4.0, Python 3.6, in a Linux-Ubuntu 18.0 Machine, with Jupyter Lab.
 pabloinsente
All 3 comments
The repeat operator only accepts field names, not aggregates. If you want aggregations in the subcharts, you can specify them within the encodings:
alt.Chart(data_sample).mark_bar().encode(
    alt.X(alt.repeat("column"), type='quantitative', aggregate='mean'),
    alt.Y(alt.repeat("row"), type='nominal', aggregate='mean')
).properties(
    width=200,
    height=200
).repeat(
    row=['race', 'gender'],
    column=['number_diagnoses','num_medications'],
)
 jakevdp
on 6 Jan 2020
jakevdp
on 6 Jan 2020
(note that an encoding like x='mean(num_medications)' is just a shorthand for x=alt.X('num_medications', aggregate='mean'))
jakevdp
on 6 Jan 2020
Amazing, thanks!
pabloinsente
on 6 Jan 2020
Related issues
 LukeMathWalker
·
3Comments
LukeMathWalker
·
3Comments
 dzonimn
·
3Comments
dzonimn
·
3Comments
 galloramiro
·
3Comments
galloramiro
·
3Comments
 HalukaMB
·
3Comments
HalukaMB
·
3Comments
 DentonGentry
·
3Comments
DentonGentry
·
3Comments