Sorry, I have been playing around with this for quite a while and still cannot find a solution. Apologies for that. I have created a chart that I first layer and then facet into rows which works great thanks to your documentation. However, I would like to customize the facet-order in which the individual plots are shown row by row by passing an array. How can I do that? I have tried to define a sort in the facet()-bracket but that has not worked?
combined=alt.layer(ridgeline_mal,ridgeline_fem, data=reduced).facet(
    row='Departement:O'

)
combined.properties(
    bounds="flush"
).configure_facet(
    spacing=0
)

 HalukaMB
All 3 comments
You can specify a sort property of the row encoding; e.g.
row=alt.Row('Department:O', sort=['WBF', 'VBS'])
any values left out of the sort array will be appended at the end in alphabetical order.
 jakevdp
on 25 Sep 2019
jakevdp
on 25 Sep 2019
Unfortunately, I tried this as well (also redefined to "Department:N") and it leaves me with this as an output.
maxvalue=200
step = 60
overlap = 1
widthX=400


ridgeline_fem = alt.Chart(height=step, width=widthX).mark_area(
     fillOpacity=1, stroke="black", strokeWidth=0.5, fill="#6C43C0"

).encode(
    alt.X(
        "Lohnklasse | Geschlecht:Q",
    ),
    alt.Y(
        "more_female:Q",
        scale=alt.Scale(domain=[0,maxvalue],range=[step, -step * overlap]),

        axis=None
    ),

)

ridgeline_mal = alt.Chart(height=step, width=widthX).mark_area(
    interpolate="monotone", fillOpacity=1, stroke="black", strokeWidth=0.5, fill="#24B39C"

).encode(
    alt.X(
        "Lohnklasse | Geschlecht:Q",
    ),
    alt.Y(
        "more_male:Q",
        scale=alt.Scale(domain=[0,maxvalue],range=[step, -step * overlap]),

        axis=None
    ),

)

combined=alt.layer(ridgeline_mal,ridgeline_fem, data=reduced).facet(
row=alt.Row('Department:N', sort=['EDA', 'BK', 'EFD', 'EDI', 'EJPD', 'UVEK', 'VBS', 'WBF'])

)
combined.properties(
    bounds="flush"
).configure_facet(
    spacing=0
)

HalukaMB
on 26 Sep 2019
I can't run your script because it has undefined variables, but here is an example of facet sort working:
from vega_datasets import data
import altair as alt

stocks = data.stocks()

alt.Chart(stocks).mark_line().encode(
  x='date:T',
  y='price',
  color='symbol'
).properties(
  height=50
).facet(
  row=alt.Row('symbol', sort=['GOOG', 'IBM', 'AAPL', 'AMZN', 'MSFT'])
)
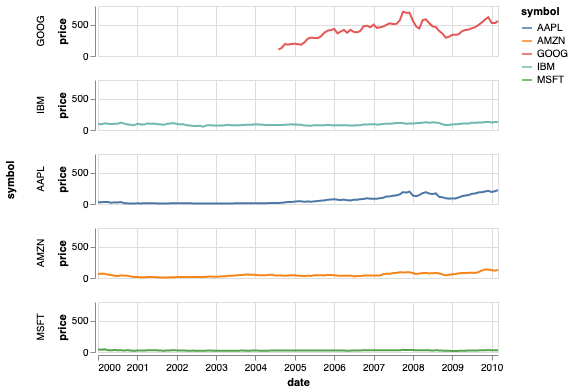
Can you check if this displays properly for you?
jakevdp
on 26 Sep 2019
Related issues
 DentonGentry
·
3Comments
DentonGentry
·
3Comments
 zanarmstrong
·
4Comments
zanarmstrong
·
4Comments
 nielsmde
·
4Comments
nielsmde
·
4Comments
 galloramiro
·
3Comments
galloramiro
·
3Comments
 tonylee3399
·
3Comments
tonylee3399
·
3Comments
Most helpful comment
You can specify a
sortproperty of the row encoding; e.g.any values left out of the sort array will be appended at the end in alphabetical order.