Vscode-jupyter: First line of output doesn't follow formatting rules
Bug: Notebook Editor, Interactive Window, Editor cells
Steps to cause the bug to occur
- Write a
printstatement in the cell with formatting rule{1:3}(or similar). It can be f string or .format(). - Execute the cell.
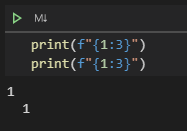
- Final testing code: (two statements for comparison)
print(f"{1:3}")
print(f"{1:3}")
Actual behavior
1
  1
Expected behavior
  1
  1
Your Jupyter and/or Python environment
_Please provide as much info as you readily know_
- Jupyter server running: Local
- Extension version: 2020.7.96456
- VS Code version: 1.47.3 (user setup)
- Setting python.jediEnabled: No setting found
- Setting python.languageServer: Jedi (user), Microsoft (workspace)
- Python and Anaconda version: Anaconda3 Python 3.7.4
- OS: Windows 10 (64 bit)
- Virtual environment: conda
Developer Tools Console Output
Microsoft Data Science for VS Code Engineering Team: @rchiodo, @IanMatthewHuff, @DavidKutu, @DonJayamanne, @greazer, @joyceerhl
 MoosaSaadat
All 13 comments
I would also like to work on this issue and provide a PR.
MoosaSaadat
on 4 Aug 2020
@MoosaSaadat Thanks for filing this issue. If you'd like to take a look at implementing a PR for this that would be great. The Contributing guide as a pretty solid set of steps for getting the extension up and building. Might want to start looking at the cellOutput.tsx file to see what's happening with the output in this specific case. If you have any questions about building / debugging the extension you can ping back here and I can hopefully help.
 IanMatthewHuff
on 4 Aug 2020
IanMatthewHuff
on 4 Aug 2020
I believe this issue is a dupe of microsoft/vscode-python#12098
 rchiodo
on 4 Aug 2020
rchiodo
on 4 Aug 2020
@rchiodo I'm not sure on that. That issue was explicitly leading tabs in output. Could be related, but doesn't look the same to me here.
IanMatthewHuff
on 4 Aug 2020
Your comment here:
https://github.com/microsoft/vscode-python/issues/12098#issuecomment-637678040
makes me think it is the same. The first tab is removed but not the second.
rchiodo
on 4 Aug 2020
@IanMatthewHuff on it. Will start from looking at cellOutput.tsx. Thanks.
MoosaSaadat
on 4 Aug 2020
There was already an even older bug about this:
https://github.com/microsoft/vscode-python/issues/10270. I'm going to consolidate all the bugs into one.
rchiodo
on 5 Aug 2020
@IanMatthewHuff I am unable to debug the extension. I've followed the instructions in the contribution guidelines and setup the project. Now, facing a problem that I can't debug (Run and Debug) the extension. Here are a few things I could use help with.
1) Do we need to explicitly run the build tasks before running the extension (because run calls the task automatically)? If yes, do we have to run both tasks?
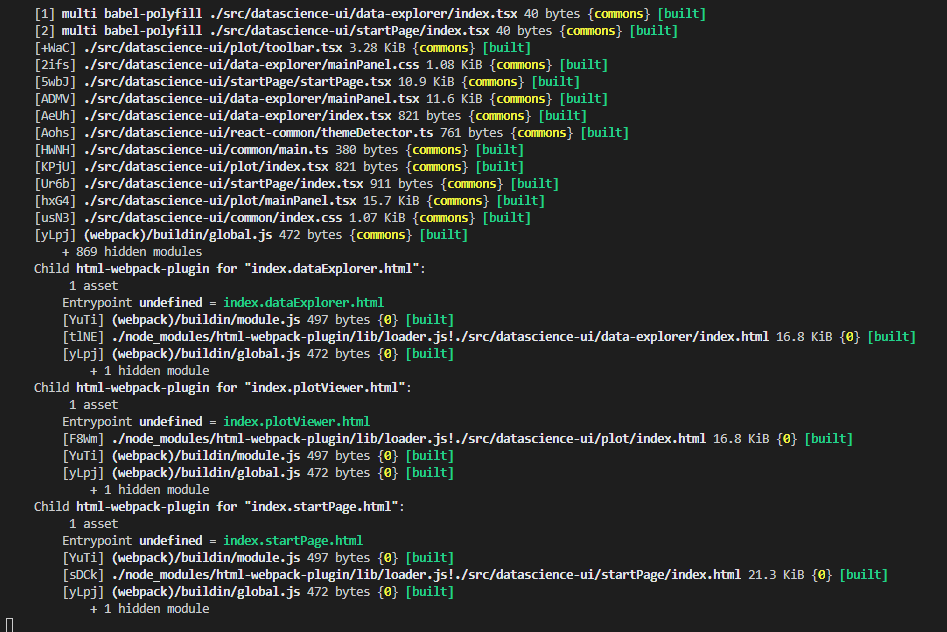
2) I have tried running both tasks. The first one completes with the following output. But, the second one never finishes. It gets stuck in the middle.
[11:06:45 PM] Starting compilation in watch mode...

[11:10:56 PM] Found 0 errors. Watching for file changes.
3) When I run Extension (vscode-python) or Extension (DS UI in Browser) (vscode-python), it opens a new window. But, when I try to open or create a new notebook (which needs debugging) in this window, it displays Activating Extension loader in the taskbar but nothing happens after that. So, basically, I can't work with notebooks. Somehow, opened a .ipynb file but it showed raw content. Even for .py files, I don't see a run button.
4) I have tried it with the installed Python Extension enabled and disabled but no results. Not sure, if it might be a problem.
So, do you have any idea what might be the problem?
MoosaSaadat
on 5 Aug 2020
@MoosaSaadat Running both tasks is the right thing to do. And that message doesn't mean that it's stuck. It's just compiled and watching for more changes. And the "Extension" launch task should be the one to use.
Do you have some output in the output window of the launching vscode? If the extension failed to activate there should be some logging there. Could also look in Help->Toggle Developer Tools of the VSCode being debugged.
IanMatthewHuff
on 5 Aug 2020
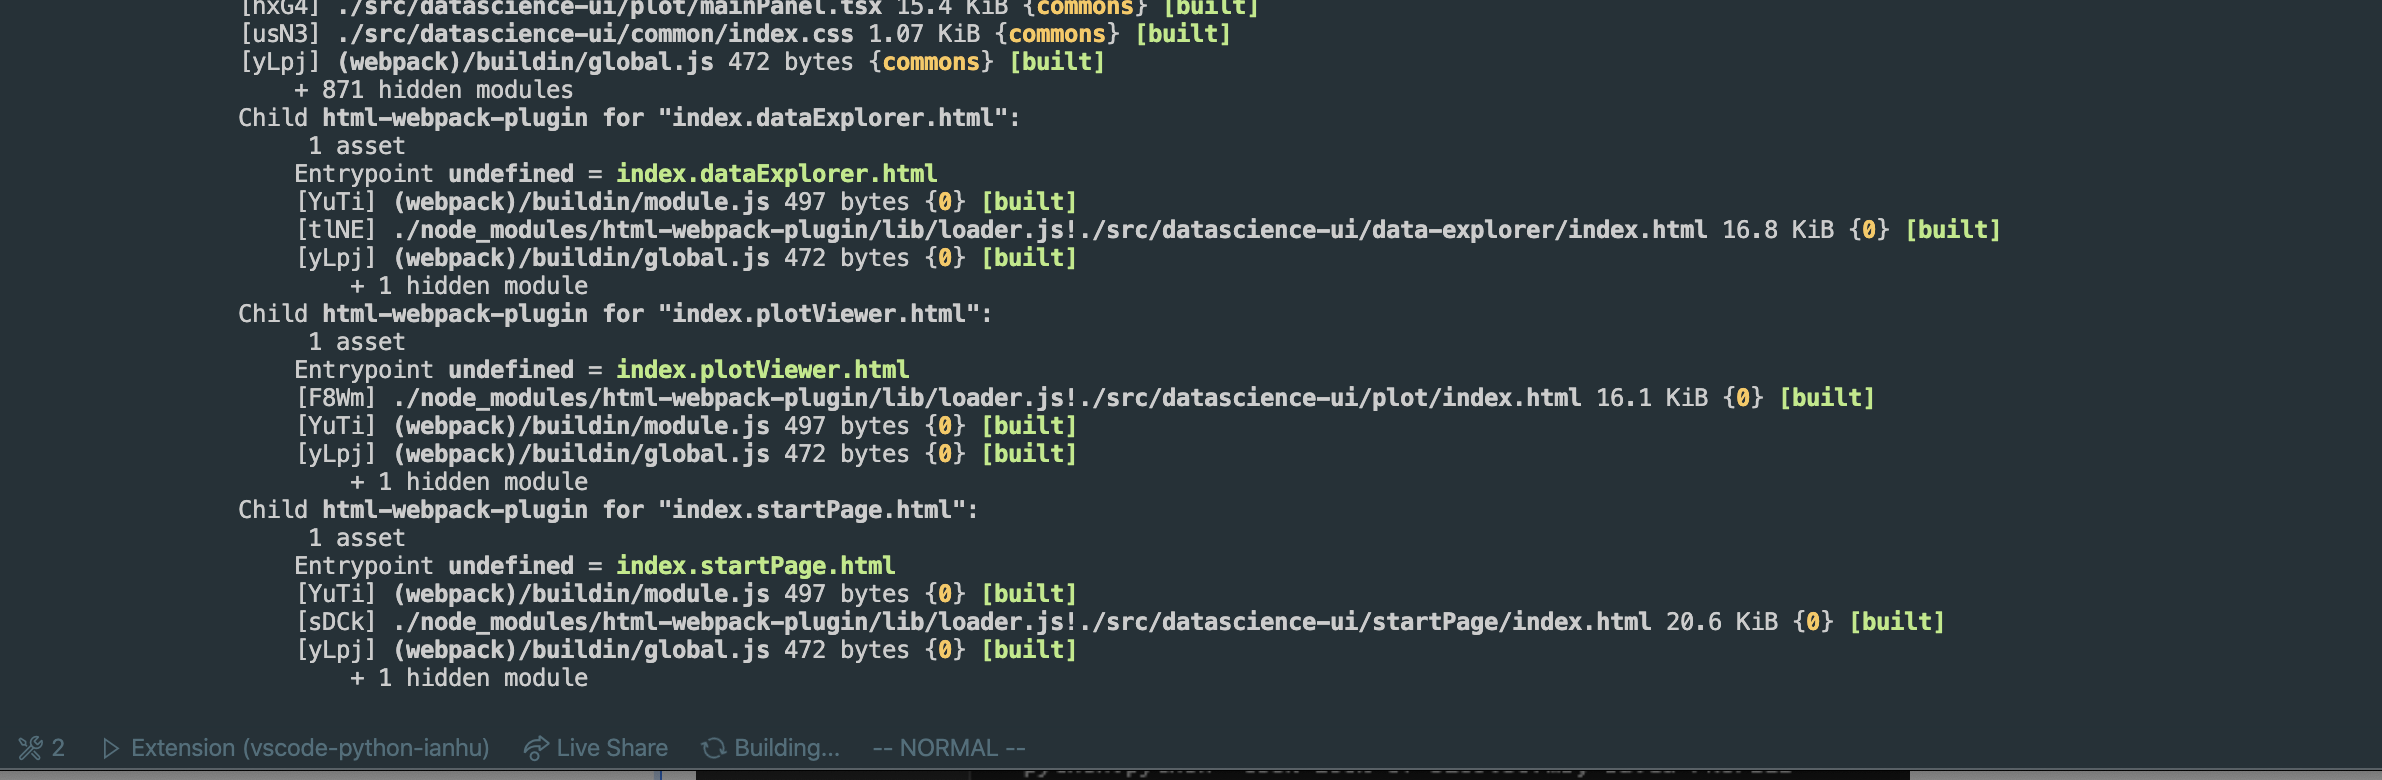
@IanMatthewHuff The problem is actually with the second build task (Compile Web Views). Although it doesn't show any errors, It gets stuck and never ends. I've kept it going for hours but no results. Gets stuck at this point:
I do get the following warning in the launching vscode:
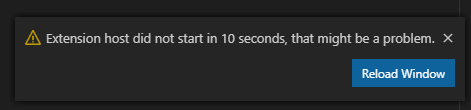
But, reloading the window breaks the debug session in original window
Developer Tools Console in the launching vscode:
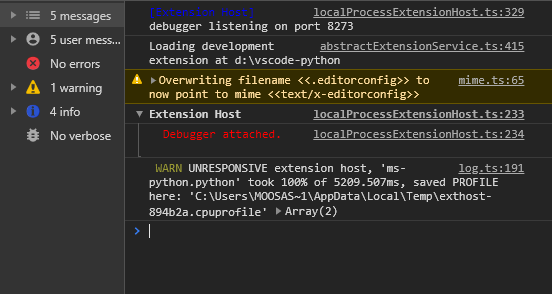
Log (Extension) in the output window of launching vscode:
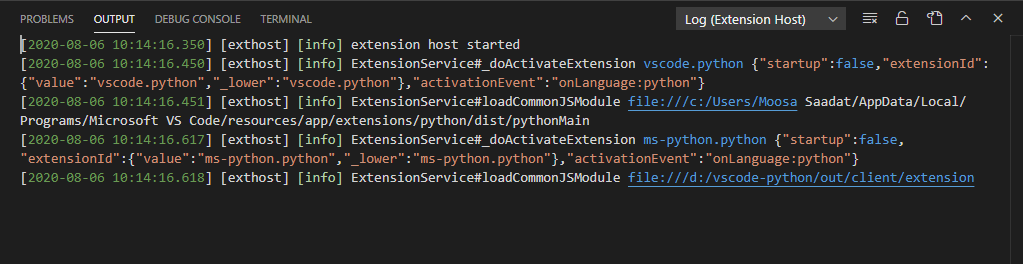
Note: Task and Extension outputs are empty
Update
Extension loads up after a minute or two and I can perform all the extension operations in the launched window. But, still the breakpoints don't work in the debugger of original window. Also, it has been 10 hours and the second compile task hasn't completed.
MoosaSaadat
on 6 Aug 2020
So compile web views isn't an issue. That's just how the task looks. Here is is on my machine that I'm debugging with now.
If you set Python -> Logging -> Level to debug, do you see anything in the Output | Python tab? Not actually sure if it's getting that far if the extension is not loading.
IanMatthewHuff
on 7 Aug 2020
First of all, thank you so much for keeping up with me. I really appreciate your help. Thank you for your time and effort.
Yes, I am getting output in Output | Python tab. I am attaching both images below:
1) Extension Development Host:
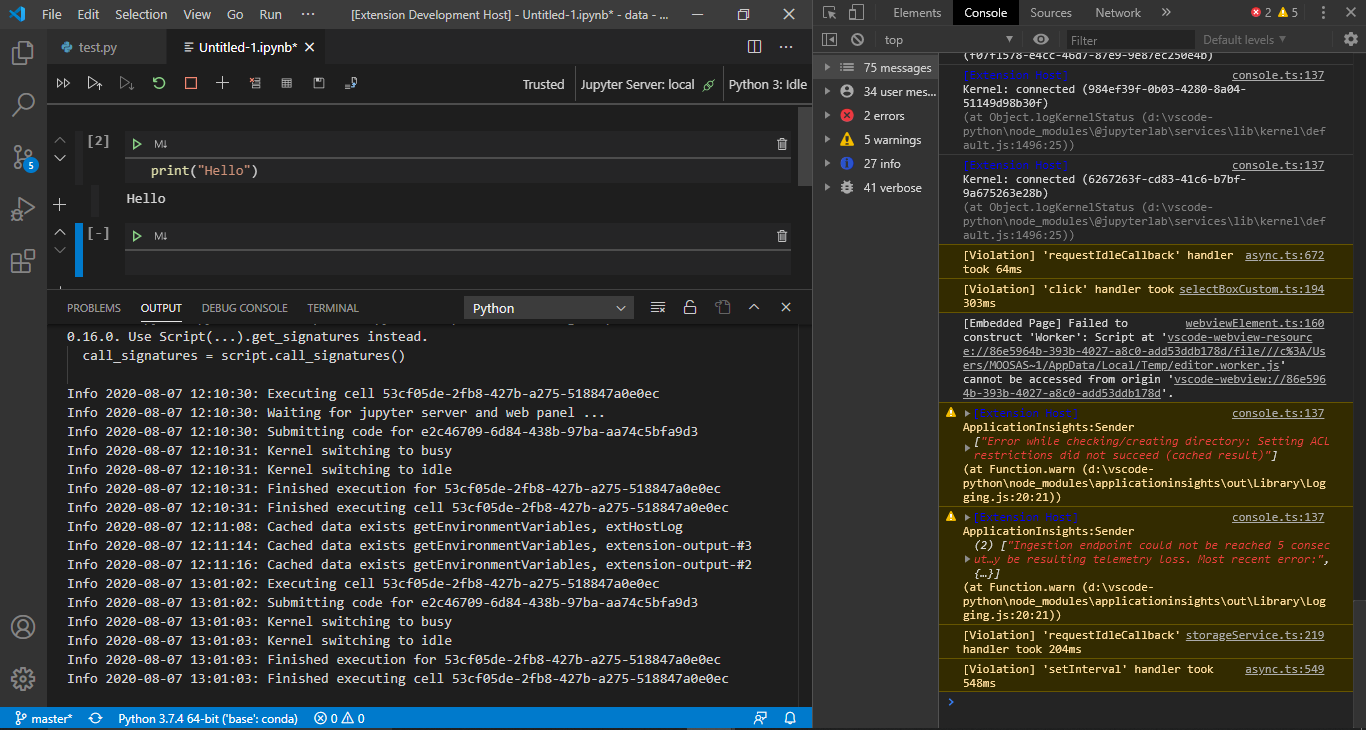
2) Main window with debugger:

What I have done so far
I started from cellOutput.tsx and debugged as much as I could from the Webview Developer Tools. There is nothing wrong in cellOutput.tsx. It is just displaying the props it is receiving (doesn't change anything). So, I tried to trace the root and I believe the problem is in function updateCellOutput() in the following file:
src/client/datascience/notebook/helpers/executionHelpers.ts
So, basically the problem is in generating the output. Do you think it is the right lead? Or I should be looking at some other file?
MoosaSaadat
on 7 Aug 2020
@MoosaSaadat My apologies. I know that you were working on this, but we had a duplicate bug entered for a similar issue which was just fixed (see the PR above). I think this might actually resolve your issue as well. Didn't want you to spend more time on it if it was already fixed. Sorry about that.
IanMatthewHuff
on 10 Aug 2020
Related issues
 rannirabadi
·
37Comments
rannirabadi
·
37Comments
 y2kbugger
·
38Comments
y2kbugger
·
38Comments
 craph
·
39Comments
craph
·
39Comments
 Louis-DR
·
61Comments
Louis-DR
·
61Comments
 HenriqueAJNB
·
48Comments
HenriqueAJNB
·
48Comments