Vega: Detail + overview zooming issue on banded scale
I'm trying to adapt the overview/detail example to a bar chart.
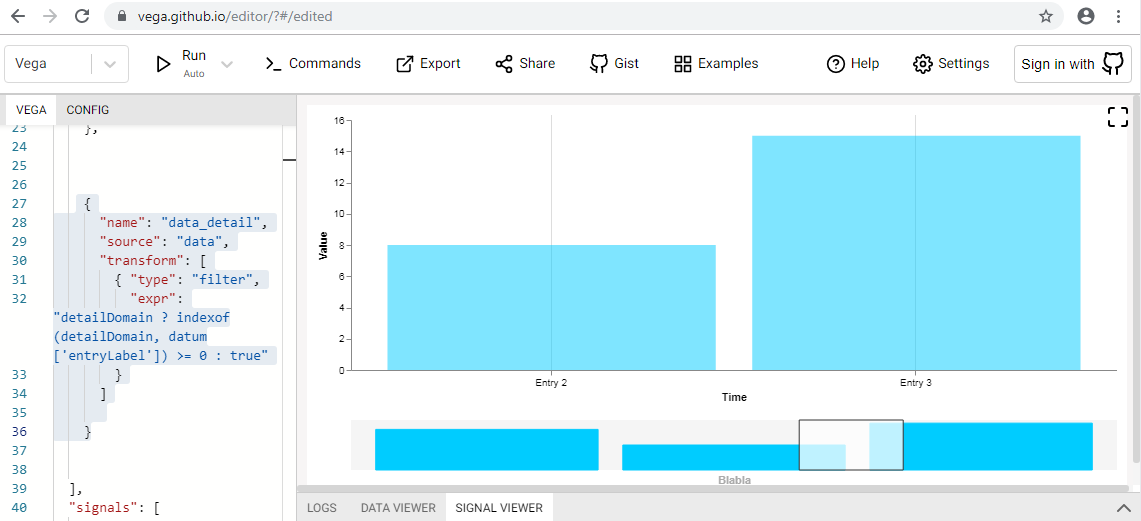
I'm not sure this is a bug: I'm trying to understand why all the bars are still visible (from X=0) in the detail/main view when the zooming controls are enabled. The detailDomain seems to contain the correct values.
Any help or quick pointers greatly appreciated.
https://vega.github.io/editor/?#/url/vega/N4KABGBEAkDODGALApgWwIaQFxUQFzwAdYsB6UgN2QHN0A6agSz0QFcAjOxge1IRQyUa6SgGY6ABjoArWNwB2kADThcyRtXzYwogOwSVESAHdGAExbaAHBIOrI6Vnm6xGAL2TbIAM2bL7Zuh4mDgA2qoQoBDRUPLoqJ44kIHB-jFGFOgANqzIsNrh6dFRRdGQyPJ4AE4AngAy6OzIWV4AopW1YACMaaUZ2bnaXaIR6QC+hqUlfeUd9Y3NbXNgAEy9M5k5iWBWozETe8WHMbPV800tSe1nOuulkJuDOF0ArMdgY4cAuqOfEF+TSCuahxLL5MKjaZlOIJLxmZDBRhZAAi3AwjEUv0mkUOkBh20g8FYVTkVTu-S2cOQ3kcWTw5KgCgK7yhRXKVEq4KgAAFuFQqhRGMhjFhUNxWLA0HzkEowKFefzBcLReLJWZuMZ5LLTPJ1SKxRLkKxCF8wAA+MA6vUqw1iqgAQgZJ2NKQJAHJhQBaKp5dzIN2Qd4HPqs9Lsip4LmQbnsKoSxA2yV2mVymNx2AJg1qjVay0Y61Zo0m8153UaxNSh1OsouoLu6hVRoBoPY9Khk7IDmRrxp+MVvW5+WxvuFgfa-PlwvG00Wq2T1WV5CO1ts2t4euN9jsDHUZt9YNTd5GTsRqO9jMV8V4cdl-UL43Voxr93wmmsOl70p-dI-faqAH2BgVQANZcoURxsngNSEASDbioQDJ4vEBLwoiLQrlAFTwNw8LaO2mGVMgZI4PhRgoBoWgkUeZSPNsKwvBI1EHjMpgWIgeHURSTw7LYTFBoczFlAg2R5MyIbUUhsJJAAHsiCLoEij5QFBMFeOw6C6kpkCEOgZhmDu2hSF0GEnI28jUASrGWCZZTquiihUX0JwpCEUAuUpRi+M0ZheBGtQNBcgZOR8NlGHZCnyAASugxgccFRjAqCVJoai9lBU535FIJMSkbEyFeDUcloVpKkElkGLIOgZKhVAZkWWJ8X0XY8VgIxwUAcFyRohFcXxckQSuf1qQ1Z5QpZD5SS0el+41XijDwNs1S5PxRQdWG6DSaJELiZ13BVEKlRqdwBBolpwlZASsnyYps0NuY2hLTKEl4MwF1eAAKowsKzVkCxZAA8vyv0ITgj0tiyEl7Qd9JJBd3j0rN50EoV13oc9r0EgAagMng-X9gNEcDD1xsgK0-hhkBAaBDVFLlkClV4cEPrNWE4dsuXHoRxFgBzZTkZoMM85xYZeeNvUtScTMg2oFH0sLf4SyF8tQFZ7GOYrUCixNQsa2UUteKr00S5l8XZU5hLldLvMnFNoMk8rJv7kxs1U2BwvW8p0EEj68AI8rPhVKd6uK0Ng3uQ7I1lBi66Nr7jBUNoNJgk9Ies7hwcS5Az7ixrPhIpcOu6zRONeAAxBI8DeEbitmy1edZADOnwMwNQ57rDwlzgUhvEXSu95A0lt7nSNeFdxWRzMWu+XMAWLMr+wT2GhsZ+3I8yUVClo73RjqZpzzz9Etd9a3K-D-AIkFRvN0HycU+TSXN990XkA1Gsp8h2vUAo+Pj9cdsbVF0dqbB2wsgExF-F+b4WJIS4gZkkfWFN8ReGlAKIUsUKZp3Zu8U4REh4nEHu-MMttWrOwkifQunViGiF4sFI+ZF1ACzwUQzuYAGKkM6svCh5tiE2AATNCSvgG5MJtiwyApdvAvAkRI6u4wyYL1xIlbIbsdrmyQUkYcGYtLEOaubJk214oe3DJyHsKClR3kNAODyNZCCui8KEaSAAKAAlLKRxTivgyKypHQxJ5jFJHlKYtB-Ycw3gLPeYss4JzmKTNKZc-ts7+I0YgUIEgARgHgL9VAhAHFuNlAYPMbF3GePGN4-2vjuyEJmIoguyRmipAjvEmxdYvAZPiIQaK5lkAONCBpJAe0UmmgANRgHhHSdAspemIH6V0IZIy6noDSfk1WTjikKychArxENOpqKgJMvaWiWHyHfFkWaei5TuzKV2M8STgmaisU+Jp64vCwHKgtBxSSVmgOohskpWzVH5RkpY2a2jTkOXOS1HxVyew3NHDme5UAElQDcasw+3zwYqJmDs2pYyDmUi7qCmmTlIWnjseeTMC4xyljCYaacJY5zRMXHEkOiKB7OLAJ6MA0lLFfPauiw82yAVuVRqlHqs1CDxmQU4XBBL9HBWJX4rhddqlqXTOxBpzLHkElgDpeQ7zVVOLAAAfjABifkeAHFumkgTVBwo3Syg+WAHARyhE8vWXI6Ia0ThI2Ufy-5UkkXWrMSVL2akNI+TFbpfS5lDJ0GMhJOqllzDWQkuFDEwjbIDThJmyOedvLTzOLPFofF+EYvuFimoga0HBtUrDCqVUtIJsJX0Bikc+GlE9fcVNYLeahyzcNYWuaxb30pOw1R81Fok1mh4QOxNlpO1WhTDaW1wW+pmFDCMR0TqoDOufN6MlK3Ci0l2xOSiU7m1+hcLkSdJSzRevAamOBr1npmC9PAe6oAACEL2-S0pg9NRhX3vp8Vzf9IsFB4AAMp+lA2yYhXQugHzofcQRBcPYiLxVAUu6BsMoqyiAlqYDUXzvJriV2TaILmzgbVZAvstLeEDtuypGbUhJHDrQlm8hsLp0VfcCMuCmO33zjB4uGGxEVyruqzOsBqjcGAlg9uxCxOV1w4fReA9hMJV3ZdA96CD6Du1qcfyf0VMQCQycThaGoCfwHjp+FO8w1DEk3XchlmgRaYKrZxeo083DsGE54+b8eOdWsxWxUVavNQG0fh02ObEWGIIUF821mrVhcPRF-T+ajOBX851FzemQueb03fSLD8a6uuI5s0tkEQ1JB9n7AV-rIBJN-ZxtmoGcHc0MXlhTLC23sf9vzSiiWNgsLYTXNTKGNMldE+I7wEnxv+2k4HOTU2O4zdEBtkzT864of+k3Fuq3tF0F0D3Y2oDYuauE+pgTYZlXqNVQMrbZmyjSUC65u7UAkmhBmU98rkCKset+P+EAYwgA
 rubjo
rubjo
All 4 comments
The issue arises due to differences between continuous and discrete scales. In the continuous case, if you change the scale domain all values (even those outside the domain) are drawn in the right place. If clipping is enabled, then the chart only shows the values within the visible domain.
For discrete scales, if you change the domain the scale does not know where to position values that are not defined in the domain. This can cause them to default to undefined, which ultimately gets mapped to zero. That's why you see the out-of-domain bars collecting on the left hand side.
One solution is to filter the data source based on the selection using a filter transform. Then both the scale domain and the visualized items will be limited to only those that pass the filter.
If you want the selection to instead feel like geometric zooming (similar to continuous scales), an alternative solution might be to use your selection to adjust the scale range only (not the domain), and clip the display to hide "off screen" parts of the chart.
 jheer
on 24 Aug 2019
jheer
on 24 Aug 2019
This is closed and all, but: what a nice thing to do, giving such a detailed explanation for an issue which really belongs more on Stackoverflow. Thanks!
rubjo
on 24 Aug 2019
Here is as working example of adding a dataset with transform filter:
    {
        "name": "data_detail",
        "source": "data",
        "transform": [
            {   "type": "filter",
                "expr": "detailDomain ? indexof(detailDomain, datum['entryLabel']) >= 0  :  true"
            }
        ]
    }
...
     "marks": [
            {
              "type": "rect",
              "from": {
              "data": "data_detail"
              },
 roying
on 24 Aug 2019
roying
on 24 Aug 2019
The issue arises due to differences between continuous and discrete scales. In the continuous case, if you change the scale domain all values (even those outside the domain) are drawn in the right place. If clipping is enabled, then the chart only shows the values within the visible domain.
For discrete scales, if you change the domain the scale does not know where to position values that are not defined in the domain. This can cause them to default to
undefined, which ultimately gets mapped to zero. That's why you see the out-of-domain bars collecting on the left hand side.One solution is to filter the data source based on the selection using a
filtertransform. Then both the scale domain and the visualized items will be limited to only those that pass the filter.If you want the selection to instead feel like geometric zooming (similar to continuous scales), an alternative solution might be to use your selection to adjust the scale _range_ only (not the domain), and clip the display to hide "off screen" parts of the chart.
@jheer Hi.Could you please provide an example of how to achieve this zooming effect with "adjust the scale range only". Thank you
 xjmer
on 25 Oct 2019
xjmer
on 25 Oct 2019
Related issues
 malhotrachetan
·
5Comments
malhotrachetan
·
5Comments
 arvind
·
5Comments
arvind
·
5Comments
 donghaoren
·
5Comments
donghaoren
·
5Comments
 nyurik
·
5Comments
nyurik
·
5Comments
 keizer619
·
3Comments
keizer619
·
3Comments
Most helpful comment
This is closed and all, but: what a nice thing to do, giving such a detailed explanation for an issue which really belongs more on Stackoverflow. Thanks!