Vedo: problem in plotting a network using `show`
Hello @marcomusy
I've the following to plot a dataset using show
    data1 = dict(zip(time, df1.values.tolist()))

    data2 = dict(zip(time, df1.values.tolist()))


    ts = [0, 1, 2, 3]

    for t in ts:

        pts.cmap('Blues', data1[t], vmin=0, vmax=234)

        if t == 0.0:

            pts.addScalarBar()

            show(pts, edg, axes=True, bg='black', at=ts.index(t), shape=(2, len(ts)))

        else:

            show(pts, edg, axes=True, bg='black', at=ts.index(t))

        pts.cmap('Blues', data2[t], vmin=0, vmax=234)

        if t != ts[-1]:

            show(pts, edg, axes=True, bg='black', at=ts.index(t)+4)

        else:

            show(pts, edg, axes=True, bg='black', at=ts.index(t)+4, interactive=True)
The problem is, in the 2 x 4 grid that is created, the pts data is not appended to the frame while looping through t instead it is overwritten. i.e in the first row: the plot added at =0 in the first iteration is overwritten by the plot generated for displaying at=2 in the second iteration. The same problem occurs in the second row. The plot added at =1 in the first iteration is overwritten by the plot generated for displaying at=3 in the second iteration.
Suggestions on how to avoid overwriting will be helpful.
 DeepaMahm
All 9 comments
Hi, the show() command visualizes what its passed as argument, it does _not_ append.
E.g.
from vedo import *
plt = Plotter(N=8, interactive=1, sharecam=0)
show(Sphere(c='r').wireframe(),'ren2', at=2)
show(Sphere(c='g').wireframe(),'ren5', at=5)
show(Cube(c='b').wireframe(),'ren2', at=2)
gives me the expected behavior (the cube replacing the sphere).
If you want to append stuff you have to manage the individual objects in lists to be passed to show().
 marcomusy
on 2 Aug 2020
marcomusy
on 2 Aug 2020
Thanks for the response. I ran the code snippet posted above and I get the following
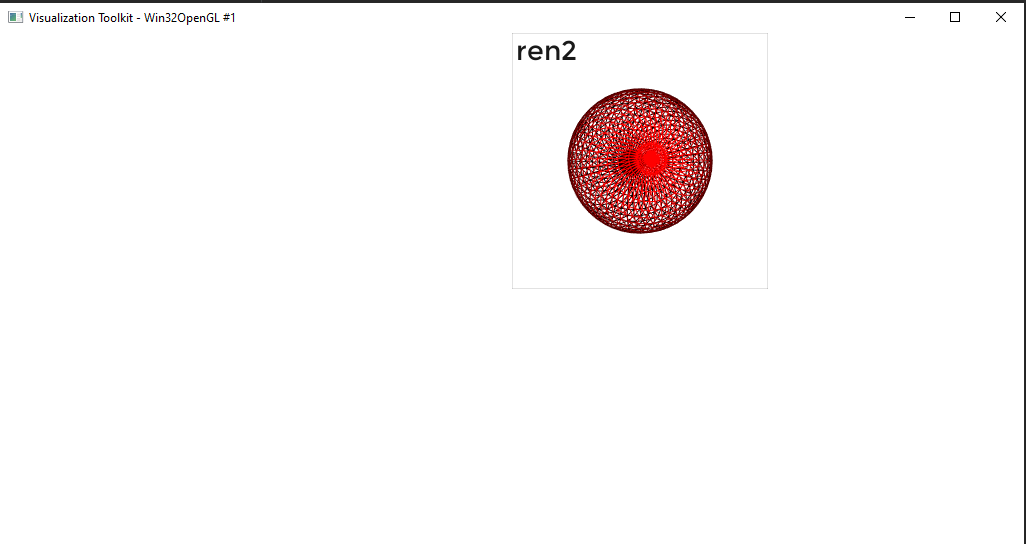
The sphere at 5 is missing, I notice only sphere at position 2.
DeepaMahm
on 2 Aug 2020
Instead,
from vedo import *
plt = Plotter(N=3)
s = Sphere().wireframe()
c = Cube().wireframe()
p = Paraboloid().wireframe()
plt.show(s, at=0)
plt.show(p, at=1)
plt.show(c, at=2)
plt.show(c, at=0, interactive=True)
works.
DeepaMahm
on 2 Aug 2020
they both work! the first one has interactive=1 so must press q to make the script progress to the next show
marcomusy
on 2 Aug 2020
Ahh, my mistake. Thank you!
DeepaMahm
on 2 Aug 2020
I'm not sure what's seriously going wrong in the way I try to plot the below
import networkx as nx
from vedo import *

G = nx.gnm_random_graph(n=10, m=15, seed=1)
nxpos = nx.spring_layout(G)

nxpts = [nxpos[pt] for pt in sorted(nxpos)]
nx_lines = [(nxpts[i], nxpts[j]) for i, j in G.edges()]

pts = Points(nxpts, r=12)
edg = Lines(nx_lines).lw(2)

# node values
values = [[1, 0, 0, 0, 0, 0, 0, 0, 0, 0],
          [30, 80, 10, 79, 70, 60, 75, 78, 65, 10],
          [1, .30, .10, .79, .70, .60, .75, .78, .65, .90]]
time = [0.0, 0.1, 0.2]  # in seconds

plt = Plotter(N=2, interactive=1, sharecam=0)
pts1 = pts.cmap('Blues', values[0])
plt.show(pts1, edg, axes=True, bg='black', at=0)
pts2 = pts.cmap('Blues', values[1])
plt.show(pts2, edg, axes=True, bg='black', at=1)
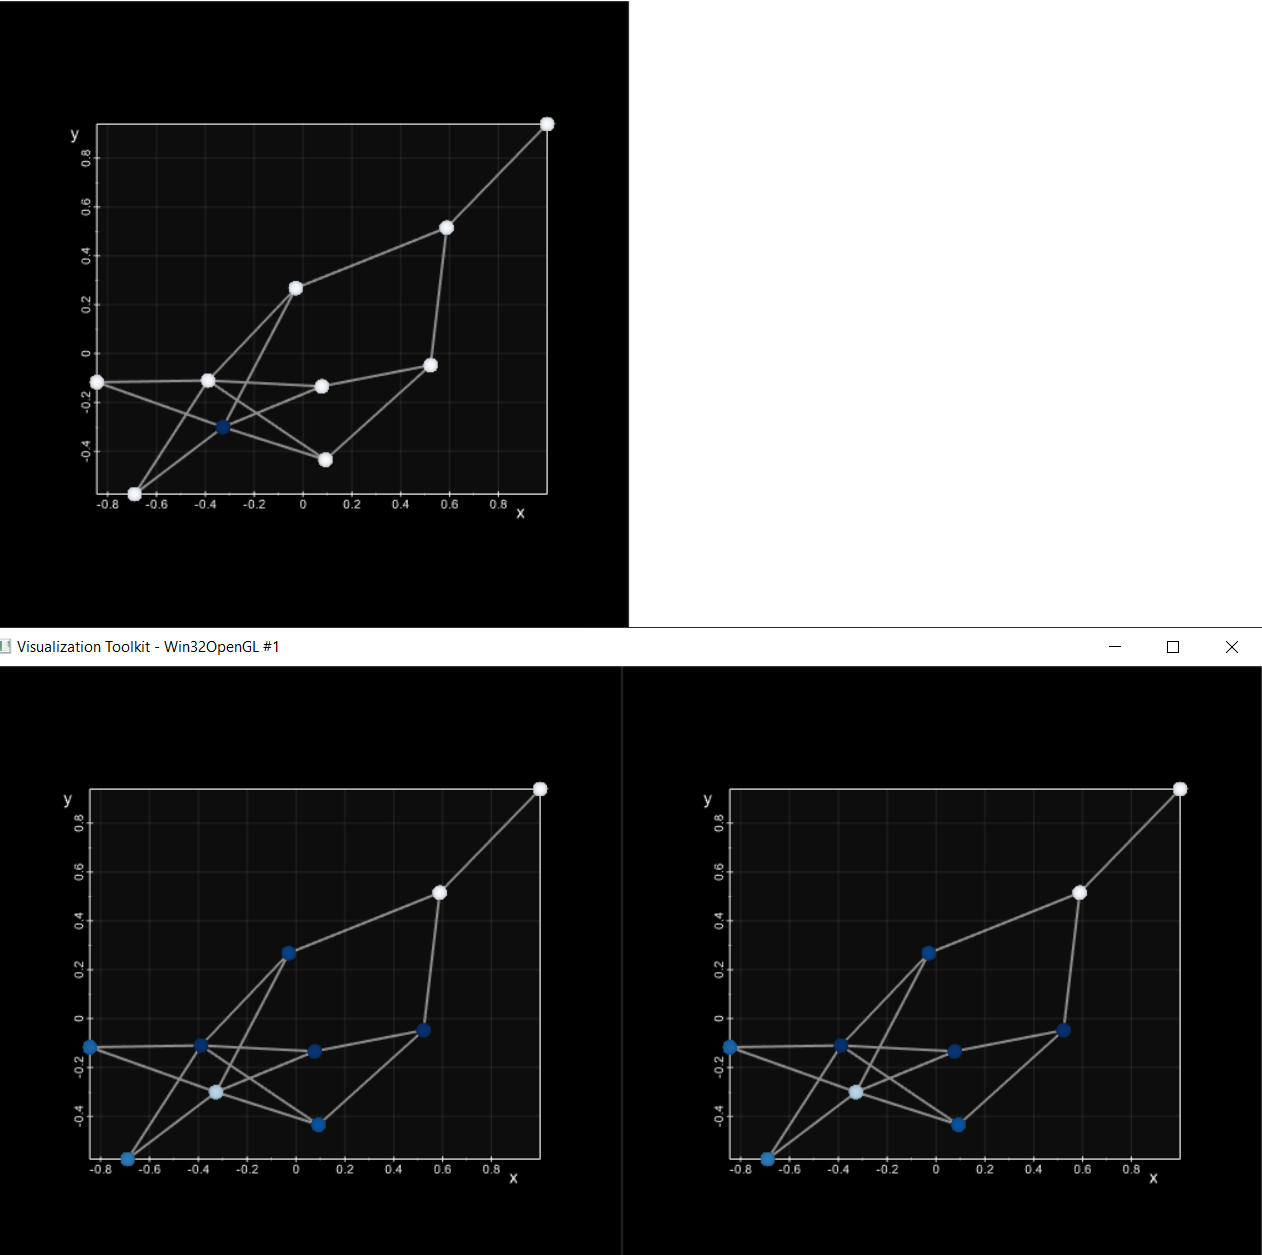
click 1 : top panel
click 2: bottom panel
DeepaMahm
on 3 Aug 2020
that's correct.. because you are plotting the same object onto different renderers but then you change its colors..
Make a clone copy instead, and change the copy:
pts2 = pts.clone().cmap('Blues', values[1])
marcomusy
on 3 Aug 2020
Hi @marcomusy
I'd like to know if there is a way to specify the title for each panel and specify a common legend like the following example
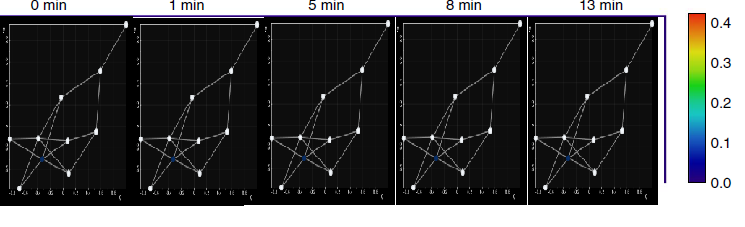
I could add the legend only to the panel in the rightmost position. But I was wondering whether there exists an option to display the legend outside the rendering window.
For the title, I could use
t = Text('title', font='BPmonoItalics', justify='center', s=.07, c='lb')
t.pos(x y)
show(nx_pts, nx_edg, labs, t, bg='black')
But this also displays the text within the rendering window and requires one to specify the position to avoid overlapping on the image in the rendering window. We could avoid this problem by displaying the text as titles for each panel in the grid.
Could you please let me know if that's possible?
DeepaMahm
on 4 Aug 2020
This is one possibility, removing the separator frames:
import networkx as nx
from vedo import *

settings.showRendererFrame = False # disable grey frame

G = nx.gnm_random_graph(n=10, m=15, seed=1)
nxpos = nx.spring_layout(G)

nxpts = [nxpos[pt] for pt in sorted(nxpos)]
nx_lines = [(nxpts[i], nxpts[j]) for i, j in G.edges()]

pts = Points(nxpts, r=12)
edg = Lines(nx_lines).lw(2)

# node values
values = [[1, 0, 0, 0, 0, 0, 0, 0, 0, 0],
          [30, 80, 10, 79, 70, 60, 75, 78, 65, 10],
          [1, .30, .10, .79, .70, .60, .75, .78, .65, .90],
          ]
times = [0.0, 0.1, 0.2]  # in seconds

vmin, vmax = min(utils.flatten(values)), max(utils.flatten(values))
x0,x1, y0,y1, z0,z1 = pts.bounds()

plt = Plotter(shape=(1,3), axes=True, bg='black')

for i,t in enumerate(times):
    pts1 = pts.clone().cmap('Blues', values[i], vmin=vmin, vmax=vmax)
    txt = Text('time = '+str(t)+'s', font='BPmonoItalics',
               justify='bottom-center', s=.07, c='lb')
    txt.pos((x0+x1)/2, y1+0.2)
    box = txt.box(pad=0.1).scale([1,1,0])
    if i==2:
        pts1.addScalarBar3D(c='w')
        pts1.scalarbar.scale(1.2)
    plt.show(pts1, edg, txt, box, at=i)

interactive()

I updated the code with a better solution probably!
marcomusy
on 5 Aug 2020
Related issues
 MarkusRosen
·
5Comments
MarkusRosen
·
5Comments
 jby1993
·
6Comments
jby1993
·
6Comments
 mahendra-ramajayam
·
3Comments
DeepaMahm
·
5Comments
mahendra-ramajayam
·
3Comments
DeepaMahm
·
5Comments
 kemo993
·
6Comments
kemo993
·
6Comments