Vedo: Unexpected behaviour of Volume.legosurface()?
Hello,
I've noticed a strange behaviour of Volume.legosurface() method trying to visualize 3D binary matrix (boolean values representing object/background) and/or 3D label matrix (integer values representing different regions).
To illustrate this, consider the following example:
import numpy as np

data_matrix = np.zeros([10, 10, 10], dtype=np.uint8)
# all voxels have value zero except:
data_matrix[0:2, 0:2,  0:2] = 1
data_matrix[4:5, 4:5, 4:5] = 2
data_matrix[7:10, 7:10, 7:10] = 3

from vtkplotter import Volume, Plotter

vol = Volume(data_matrix)

EPS = 1e-6
msh = vol.legosurface(vmin=1-EPS, vmax=3+EPS, cmap=['red', 'green', 'blue'])

vp = Plotter(bg="black")
vp.add(msh)

vp.show(axes=1)
Issue no. 1:
I think that parameters vmin and vmax are not properly described in the documentation, i.e. the documentation states that
- vmin (float) – the lower threshold, voxels below this value are not shown.
- vmax (float) – the upper threshold, voxels above this value are not shown.
but it seems that parametersvminandvmaxdefine a range (i.e. (vmin, vmax)) not the interval (i.e. [vmin, vmax]) -- not a big deal (can be handled withEPSor something similar) but can cause unexpected behaviour.
Issue no. 2:
My expectations of legosurface() behaviour was that the code listed above will plot three cubes: 1x1x1 (red), 2x2x2 (green) and 3x3x3 (blue). In other words, I expected to see "voxelized" plot of these three regions. However, vtkplotter produced 0x0x0 (red), 1x1x1 (green) and 2x2x2 (blue) regions: https://prnt.sc/rmk0yo
Whether this is a bug or I didn't understand the usage of this method well?
It is not a big problem for many use-cases, but I am trying to use vtkplotter to visualize image segmentation output in 3D, where each voxel counts. :-)
Thank you!
 kemo993
All 6 comments
Hi @kemo993
thanks for drawing my attention to these issues, give me one day to look more carefully at them!
and get back to you asap, M
 marcomusy
on 25 Mar 2020
marcomusy
on 25 Mar 2020
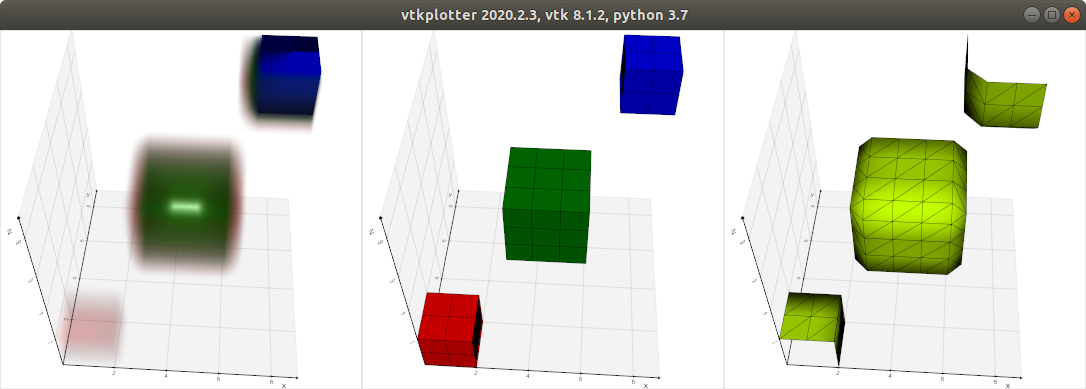
issue 2 seems quite tricky because vtk seems to associate the scalar not to the center of the voxel but to the edge so effectively reducing the nr of voxels by 1... i'll see if i can think of a way around this.. one possibility would be to use a Glyph object.
also, I suspect you are using an old version.. try
pip install vtkplotter -U
you should be then able to reproduce this
import numpy as np
data_matrix = np.zeros([10, 10, 10], dtype=np.uint8)
data_matrix[0:3, 0:3,  0:3] = 1
data_matrix[3:7, 3:7,  3:7] = 2
data_matrix[7:10,7:10,7:10] = 3
#data_matrix = np.insert(data_matrix, 0, data_matrix[0,:,:], axis=0)
#data_matrix = np.insert(data_matrix, 0, data_matrix[:,0,:], axis=1)
#data_matrix = np.insert(data_matrix, 0, data_matrix[:,:,0], axis=2)
#print(data_matrix)

from vtkplotter import Volume, show

vol = Volume(data_matrix).c(['white','r','g','b'])

msh = vol.legosurface(vmin=1, vmax=3, cmap=['red', 'green', 'blue'])

iso = vol.isosurface(threshold=0.99).lw(0.1)

show(vol, msh, iso, N=3, axes=1)
note that the nr of cubes in each axis is 9, not 10.
marcomusy
on 27 Mar 2020
Hi @marcomusy
I understand, this is how vtk works with legosurface.
Thank you, your suggestion to look into Glyph object really helped me a lot and I think I figured out how to get the visualization similar to legosurface without reducing the number of voxels. If anyone needs it, here is a code snippet and corresponding output:
import numpy as np

data_matrix = np.zeros([10, 10, 10], dtype=np.uint8)
# all voxels have value zero except:
data_matrix[0:2, 0:2,  0:2] = 1
data_matrix[4:5, 4:5, 4:5] = 2
data_matrix[7:10, 7:10, 7:10] = 3

from vtkplotter import Volume, Plotter, shapes

vol = Volume(data_matrix)

EPS = 1e-6
msh = vol.legosurface(vmin=1-EPS, vmax=data_matrix.max()+EPS)

gly_cube = shapes.Cube(pos=(0, 0, 0), side=0.90)
orvs = np.array([data_matrix[tuple(v.astype(int))] * np.array([1., 0., 0.]) for v in msh.points()])
gly_msh = shapes.Glyph(msh, gly_cube, c='jet', orientationArray=orvs)

vp = Plotter(bg="black")
vp.add(gly_msh)

vp.show(axes=1)

vp.close()
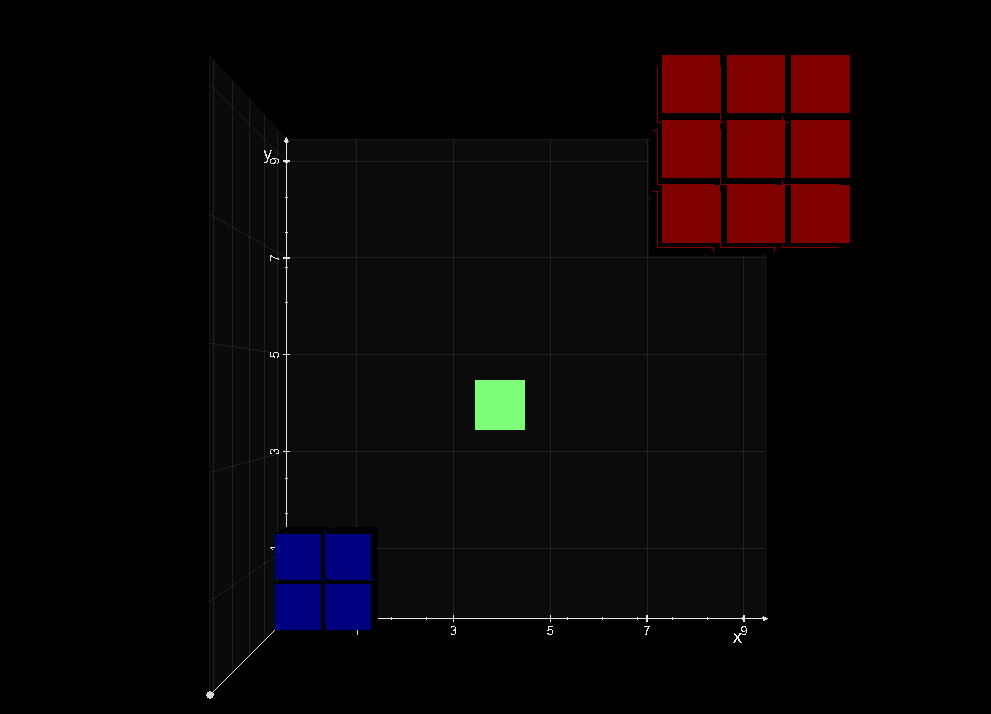
Probably not the most elegant way, but I exploited orientationArray to pass corresponding values to colormap (slightly different from the problem I explained above, but 'jet' colormap is exactly what I need).
kemo993
on 28 Mar 2020
Nice! I had a look at it yesterday and came up with a similar solution.. I'll see if can improve on the Glyph class to make it a bit more versatile..
marcomusy
on 28 Mar 2020
In the lastest version
pip install -U vtkplotter
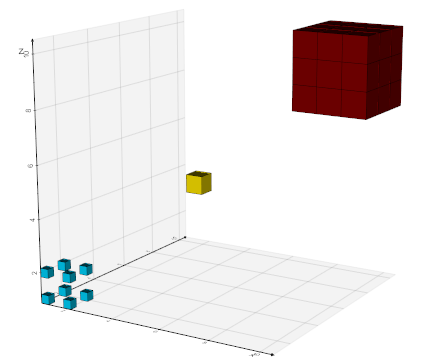
you can also do something like:
from vtkplotter import *
import numpy as np

data_matrix = np.zeros([10, 10, 10], dtype=np.uint8)
# all voxels have value zero except:
data_matrix[0:2, 0:2, 0:2 ] = 1
data_matrix[4:5, 4:5, 4:5 ] = 2
data_matrix[7:10,7:10,7:10] = 3

scals = data_matrix.ravel(order='F').astype(np.float)
zeromat = np.zeros(data_matrix.shape+np.array([1,1,1]), dtype=np.uint8)
zvol = Volume(zeromat)

pts = Points(zvol.cellCenters()+.5).addPointScalars(scals,'glyphs')
obj = Cube(side=1/np.max(data_matrix))
gl = Glyph(pts, obj, c='jet', scaleByScalar=True).lw(0.1)

show(gl, axes=1)
marcomusy
on 16 Apr 2020
Thank you, this looks much more elegant compared to the trick with dummy orientation vectors scaled by scalar values.
kemo993
on 16 Apr 2020
Related issues
 CMengich
·
5Comments
CMengich
·
5Comments
 Jesse0818
·
4Comments
Jesse0818
·
4Comments
 vianamp
·
3Comments
vianamp
·
3Comments
 vigji
·
3Comments
vigji
·
3Comments
 mahendra-ramajayam
·
3Comments
mahendra-ramajayam
·
3Comments