Signal-desktop: Startup is extremely slow (or hangs)
- [x] I have searched open and closed issues for duplicates
I see there are several near-duplicates, but I'm unsure if there's anything exactly like this, so I'm reporting with the risk of a duplicate :-)
After upgrading from the Chrome extension to the “standalone” client (which is still based on Chrome), startup has become unbearably slow. Signal shows “Loading…” and uses 100% CPU for ages. After maybe 5 minutes, it says “10 so far…”, then after a few more minutes “20 so far” and so on. Recently, it seems to simply never load.
Startup in the Chrome extension was slow, but it was more like 30 seconds, and I haven't had a whole lot of new messages.
Platform info
Operating System: Debian GNU/Linux sid/unstable
Signal Version: 1.0.39
Link to debug log
Here's what happens on the console after I start Signal and allow it to run for a while:
klump:~> signal-desktop
Gtk-Message: Failed to load module "atk-bridge"
reading package.json
configuring
NODE_ENV production
NODE_CONFIG_DIR /opt/Signal/resources/app.asar/config
NODE_CONFIG {}
ALLOW_CONFIG_MUTATIONS undefined
HOSTNAME undefined
NODE_APP_INSTANCE undefined
SUPPRESS_NO_CONFIG_WARNING undefined
setting AUMID
making app single instance
userData: /home/sesse/.config/Signal
{"name":"log","hostname":"klump","pid":9258,"level":30,"msg":"app ready","time":"2017-11-30T22:35:31.817Z","v":0}
{"name":"log","hostname":"klump","pid":9258,"level":50,"msg":"Problem loading messages for locale nb Error: ENOENT, _locales/nb/messages.json not found in /opt/Signal/resources/app.asar\n    at notFoundError (ELECTRON_ASAR.js:115:19)\n    at Object.fs.readFileSync (ELECTRON_ASAR.js:514:9)\n    at getLocaleMessages (/opt/Signal/resources/app.asar/app/locale.js:27:24)\n    at load (/opt/Signal/resources/app.asar/app/locale.js:47:16)\n    at App.<anonymous> (/opt/Signal/resources/app.asar/main.js:274:14)\n    at emitTwo (events.js:111:20)\n    at App.emit (events.js:191:7)","time":"2017-11-30T22:35:31.819Z","v":0}
{"name":"log","hostname":"klump","pid":9258,"level":50,"msg":"Falling back to en locale","time":"2017-11-30T22:35:31.819Z","v":0}
{"name":"log","hostname":"klump","pid":9258,"level":30,"msg":"Initializing BrowserWindow config: {\"width\":1918,\"height\":990,\"minWidth\":700,\"minHeight\":360,\"autoHideMenuBar\":false,\"webPreferences\":{\"nodeIntegration\":false,\"preload\":\"/opt/Signal/resources/app.asar/preload.js\"},\"maximized\":false,\"x\":1,\"y\":63}","time":"2017-11-30T22:35:31.819Z","v":0}
{"name":"log","hostname":"klump","pid":9258,"level":30,"msg":"Detected Linux. Setting up spell check with locale nb_NO and dictionary location /usr/share/hunspell","time":"2017-11-30T22:35:32.243Z","v":0}
{"name":"log","hostname":"klump","pid":9258,"level":30,"msg":"pre-main prep time: 3 ms","time":"2017-11-30T22:35:32.647Z","v":0}
{"name":"log","hostname":"klump","pid":9258,"level":30,"msg":"Build expires:  2018-02-20T01:28:40.000Z","time":"2017-11-30T22:35:32.675Z","v":0}
{"name":"log","hostname":"klump","pid":9258,"level":30,"msg":"background page reloaded","time":"2017-11-30T22:35:32.700Z","v":0}
{"name":"log","hostname":"klump","pid":9258,"level":30,"msg":"environment: production","time":"2017-11-30T22:35:32.700Z","v":0}
{"name":"log","hostname":"klump","pid":9258,"level":30,"msg":"ConversationController: starting initial fetch","time":"2017-11-30T22:35:32.921Z","v":0}
{"name":"log","hostname":"klump","pid":9258,"level":30,"msg":"ConversationController: done with initial fetch","time":"2017-11-30T22:35:32.985Z","v":0}
{"name":"log","hostname":"klump","pid":9258,"level":30,"msg":"listening for registration events","time":"2017-11-30T22:35:32.988Z","v":0}
{"name":"log","hostname":"klump","pid":9258,"level":30,"msg":"Next signed key rotation scheduled for \"2017-12-01T15:11:42.107Z\"","time":"2017-11-30T22:35:32.990Z","v":0}
{"name":"log","hostname":"klump","pid":9258,"level":30,"msg":"connect","time":"2017-11-30T22:35:32.992Z","v":0}
{"name":"log","hostname":"klump","pid":9258,"level":30,"msg":"getAllFromCache","time":"2017-11-30T22:35:32.992Z","v":0}
{"name":"log","hostname":"klump","pid":9258,"level":30,"msg":"opening message socket https://textsecure-service.whispersystems.org","time":"2017-11-30T22:35:32.993Z","v":0}
{"name":"log","hostname":"klump","pid":9258,"level":30,"msg":"open inbox","time":"2017-11-30T22:35:33.015Z","v":0}
{"name":"log","hostname":"klump","pid":9258,"level":30,"msg":"websocket open","time":"2017-11-30T22:35:34.496Z","v":0}
{"name":"log","hostname":"klump","pid":9258,"level":30,"msg":"got request PUT /api/v1/queue/empty","time":"2017-11-30T22:35:34.518Z","v":0}
{"name":"log","hostname":"klump","pid":9258,"level":30,"msg":"getAllFromCache loaded 1 saved envelopes","time":"2017-11-30T22:35:35.748Z","v":0}
{"name":"log","hostname":"klump","pid":9258,"level":30,"msg":"Sending a keepalive message","time":"2017-11-30T22:36:29.532Z","v":0}
{"name":"log","hostname":"klump","pid":9258,"level":30,"msg":"queueing decrypted envelope +[REDACTED]189.1 1511217578791","time":"2017-11-30T22:36:54.029Z","v":0}
{"name":"log","hostname":"klump","pid":9258,"level":30,"msg":"read messages from +[REDACTED]189.1","time":"2017-11-30T22:36:54.045Z","v":0}
{"name":"log","hostname":"klump","pid":9258,"level":30,"msg":"read sync +[REDACTED]887 1511215701301","time":"2017-11-30T22:36:54.046Z","v":0}
{"name":"log","hostname":"klump","pid":9258,"level":30,"msg":"No message for read sync +[REDACTED]887 1511215701301","time":"2017-11-30T22:36:54.050Z","v":0}
{"name":"log","hostname":"klump","pid":9258,"level":30,"msg":"Sending a keepalive message","time":"2017-11-30T22:37:25.212Z","v":0}
{"name":"log","hostname":"klump","pid":9258,"level":30,"msg":"Sending a keepalive message","time":"2017-11-30T22:38:20.420Z","v":0}
{"name":"log","hostname":"klump","pid":9258,"level":30,"msg":"Sending a keepalive message","time":"2017-11-30T22:39:15.650Z","v":0}
{"name":"log","hostname":"klump","pid":9258,"level":30,"msg":"Sending a keepalive message","time":"2017-11-30T22:40:10.798Z","v":0}
{"name":"log","hostname":"klump","pid":9258,"level":30,"msg":"Sending a keepalive message","time":"2017-11-30T22:41:05.945Z","v":0}
{"name":"log","hostname":"klump","pid":9258,"level":30,"msg":"Sending a keepalive message","time":"2017-11-30T22:42:01.117Z","v":0}
{"name":"log","hostname":"klump","pid":9258,"level":30,"msg":"Sending a keepalive message","time":"2017-11-30T22:42:56.366Z","v":0}
{"name":"log","hostname":"klump","pid":9258,"level":30,"msg":"Sending a keepalive message","time":"2017-11-30T22:43:51.513Z","v":0}
{"name":"log","hostname":"klump","pid":9258,"level":30,"msg":"Sending a keepalive message","time":"2017-11-30T22:44:46.765Z","v":0}
At this point, it's used 100% CPU for more than ten minutes, and is still in “Loading…”.
 sesse
sesse
All 92 comments
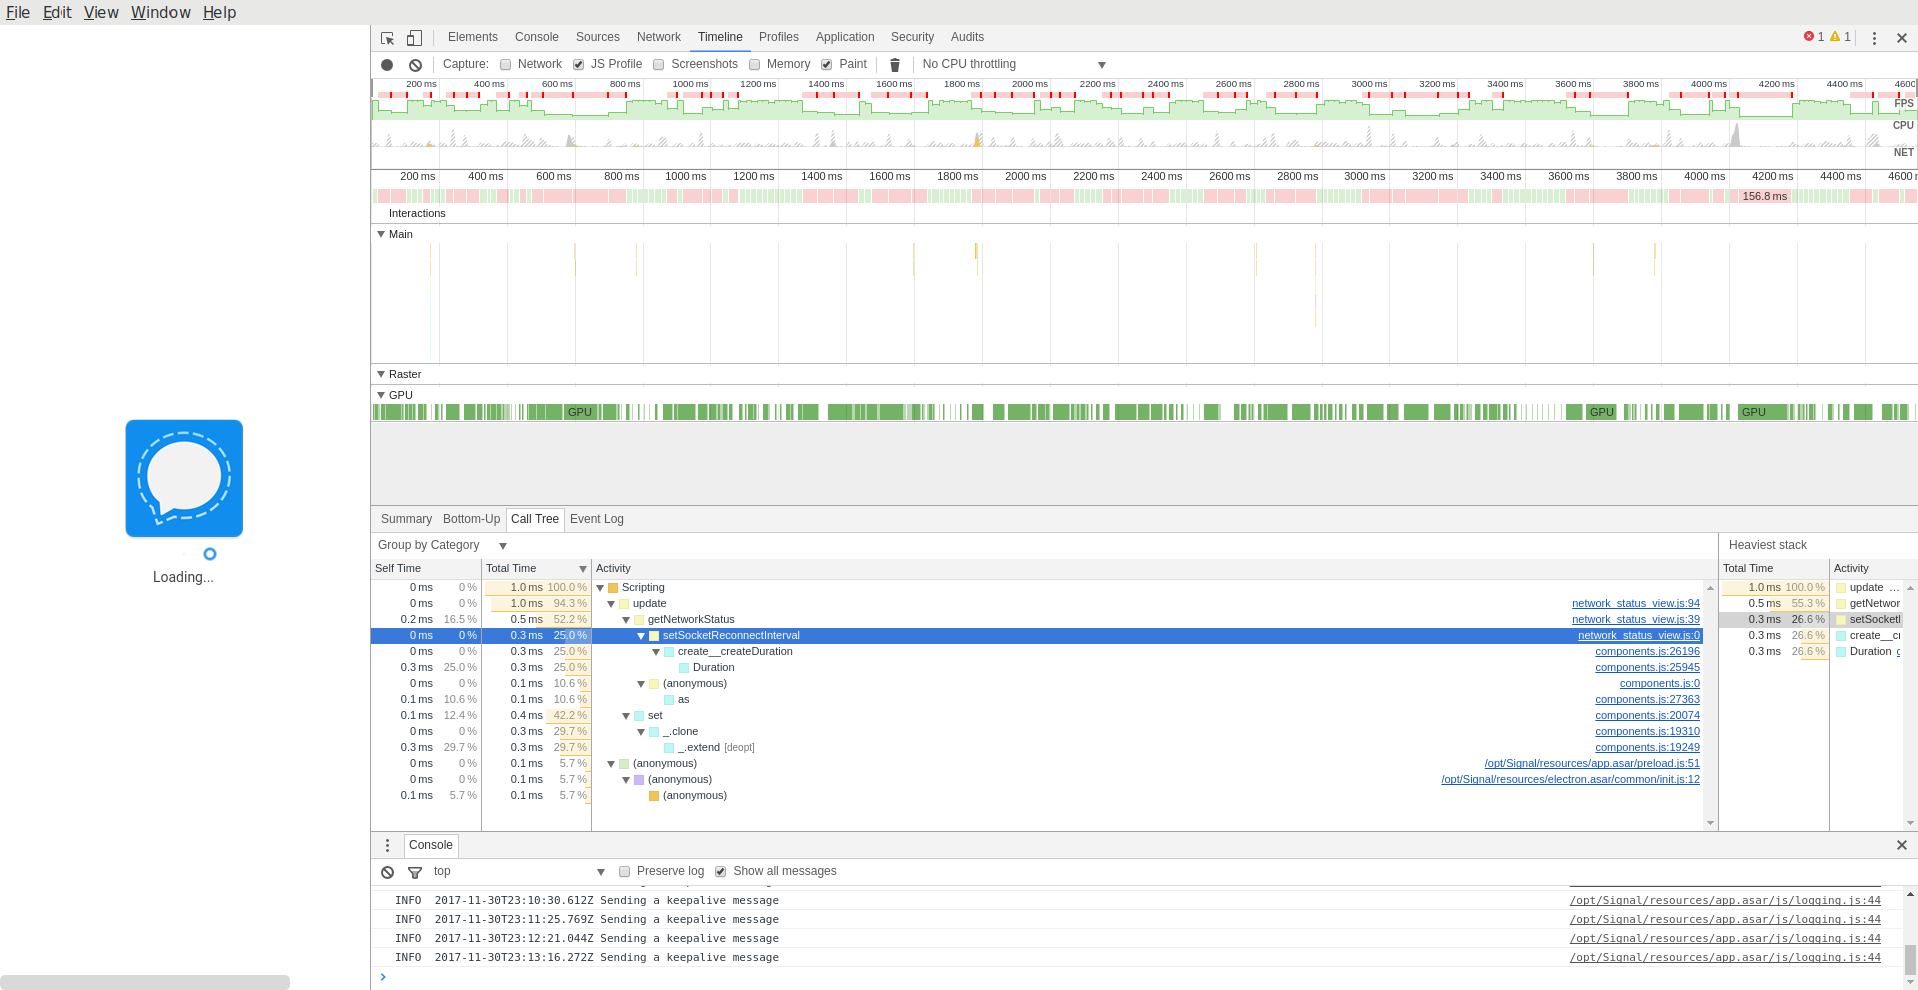
I let it run for half an hour or so. From looking at the developer tools, it appears that it's not actually doing anything; all the CPU is going into repainting the loading bar… which also explains why the entire system is sluggish even if I nice Signal to idle priority. (It's driving the compositor.)
Screenshot:
sesse
on 1 Dec 2017
It sounds like you did an export from the Chrome extension to Standalone. How big is your ~/.config/Signal directory? Also, can you provide your full log so far by going to View -> Debug Log in the main menu?
 scottnonnenberg
on 1 Dec 2017
scottnonnenberg
on 1 Dec 2017
I see a similar behavior and I did an export from the Chrome extension which has 1 GB.
The ~/.config/Signal directory has 1.1 GB.
After I renamed the Chrome extension export and restarted Signal Desktop the startup went smoothly and I can actually use Signal Desktop now :)
 mohonk
on 1 Dec 2017
mohonk
on 1 Dec 2017
Yes, I did an export from Chrome. ~/.config/Signal is 2.2 GB, although I'm not sure why it would be so big. :-)
The debug log contained basically what I already pasted, but I started Signal anew and made it post it (URL below). As you will see, I ran from 22:35 to 23:15 before I gave up (and all the time, it was stuck in “Loading”), so my assumption is that it's really gotten stuck somewhere, not just slow.
However, interestingly, today it got further. After I posted a debug log, I let it stay for a few more minutes, and after four minutes, it got to “Loading messages. 50 so far…” and then appeared to hang again. I gave it a few more minutes to make sure it didn't progress further. then posted another debug log. Here it is: https://gist.github.com/anonymous/199256d56064f6fc392797f694889883
sesse
on 1 Dec 2017
I started with LC_ALL=C signal-desktop. It booted up in maybe five seconds. Closed, booted again, still works. Restarted with my normal locale (nb_NO.UTF-8) and now it boots really fast again. So something got unstuck; I don't know if it had anything to do with the locale or not.
New debug log: https://gist.github.com/anonymous/c1c07b134d59dd802192682470ce36a2
sesse
on 1 Dec 2017
@sesse Is it true that whenever it hangs like that it uses 100% CPU? Was it also using a lot of memory?
scottnonnenberg
on 1 Dec 2017
Yes, it uses 100% CPU, although I wonder if maybe it's using all of it (and the GPU) to show the loading animation, not for useful work.
I don't think it was using a lot of memory—I would have noticed.
sesse
on 1 Dec 2017
My suspicion is that it's some sort of database cleanup thing going on. Did you happen to attempt to import more than once?
scottnonnenberg
on 1 Dec 2017
I don't honestly remember (it's a month ago now). It may have failed the first time?
sesse
on 1 Dec 2017
It sounds like it has happened a couple times now. Is there any pattern to it?
Can you also describe your general usage of the app? How many sent/received messages per day? How many images or other attachments?
scottnonnenberg
on 1 Dec 2017
I don't know of any pattern, no. Usage is fairly light. Think 10–20 messages a day, maybe one or two images per day. There's the odd video or audio file, but those are rare. There are two groups that seem to be fairly large by Signal standards (~20 people).
Occasionally I get “Error handling incoming message” on incoming group messages. I doubt it's related.
sesse
on 1 Dec 2017
Okay, so to describe my thinking on this a little bit more. The database we use doesn't delete immediately. It comes back later to clean up. With a large amount of data stored, this process could take some time.
I think that's what is happening in your case, because the actual javascript code being run was minimal - you can see it in your trace. I expect that our requests to the database just didn't return. We do have some 2-minute timeouts in place in the app for just this kind of thing, so I'm disappointed that you were on the loading screen forever.
Anyway, you have two choices.
1) Tough it out and continue to use that installation as-is. You can perhaps help us track this behavior down by poking and prodding the app over time.
2) Start over from scratch. Close the app and erase ~/.config/Signal. Start up and re-link.
I suppose there might be another option too, deleting some of the conversations you don't really care about, to see if they eventually reduce the size of your database. Up to you!
scottnonnenberg
on 2 Dec 2017
This is LevelDB, right? :-) I know fairly well how it works (as in, the basic ideas); I was involved in open-sourcing parts of it.
If you think it's spending its time in native code, I can run perf on it next time it's slow to start up? I guess the theory is that LevelDB needs more than two minutes to return, Signal times out the database call and doesn't manage to recover?
sesse
on 2 Dec 2017
Yup, IndexedDB is built on top of LevelDB in Chrome. Any analysis you can do there would be really, really helpful! :0)
It's interesting, looking at your log, from 22:35 to 23:15. Everything appears to be happening normally, except there's no 'empty' event fired which would get rid of that loading screen. And we should see one, since there were no messages from the websocket, and only one message that we retry.
If you could continue providing logs, telling us which sessions started up properly and which didn't, that would help us ensure that it isn't something in our application startup. My best guess at this point is that we're doing something on startup which is really sensitive to high CPU usage, maybe a number of defers to the event loop due to all of our Promise-related operations, and the event loop is running very slowly against all that CPU usage spent on LevelDB cleanup.
scottnonnenberg
on 2 Dec 2017
I had another relatively slow start; only 30 seconds or so, but enough that I got a few seconds of profile. It's indeed IndexedDB that's taking time:
  17,29%  IndexedDB        [kernel.kallsyms]            [k] copy_user_enhanced_fast_string                       ▒
  14,50%  IndexedDB        signal-desktop               [.] 0x0000000001c6b163                                   ▒
   7,02%  IndexedDB        [kernel.kallsyms]            [k] clear_page_erms                                      ▒
   2,91%  IndexedDB        signal-desktop               [.] 0x0000000001c6b177                                   ▒
   2,15%  IndexedDB        [kernel.kallsyms]            [k] native_irq_return_iret                               ▒
   2,07%  IndexedDB        [unknown]                    [k] 0x00007f35e74a96bf                                   ▒
   2,00%  IndexedDB        [kernel.kallsyms]            [k] __handle_mm_fault                                    ▒
   1,61%  IndexedDB        libc-2.26.so                 [.] __memmove_avx_unaligned_erms                         ▒
   1,47%  IndexedDB        [kernel.kallsyms]            [k] _raw_spin_lock                                       ▒
   1,29%  IndexedDB        [kernel.kallsyms]            [k] unmap_page_range                                     ▒
   1,16%  IndexedDB        [kernel.kallsyms]            [k] find_get_entry                                       ▒
   1,14%  IndexedDB        [kernel.kallsyms]            [k] get_page_from_freelist                               ▒
   1,05%  IndexedDB        [kernel.kallsyms]            [k] __rmqueue                                            ▒
   0,99%  IndexedDB        [kernel.kallsyms]            [k] release_pages                                        ▒
   0,94%  IndexedDB        [kernel.kallsyms]            [k] free_pcppages_bulk                                   ▒
   0,66%  IndexedDB        [kernel.kallsyms]            [k] __pagevec_lru_add_fn                                 ▒
   0,57%  IndexedDB        [kernel.kallsyms]            [k] __do_page_fault                                      ▒
   0,56%  IndexedDB        [kernel.kallsyms]            [k] error_entry                                          ▒
   0,54%  IndexedDB        [kernel.kallsyms]            [k] free_hot_cold_page                                   ▒
   0,49%  IndexedDB        [kernel.kallsyms]            [k] generic_file_read_iter                               ▒
   0,48%  IndexedDB        [kernel.kallsyms]            [k] __radix_tree_lookup                                  ▒
   0,47%  IndexedDB        [kernel.kallsyms]            [k] mem_cgroup_try_charge                                ▒
   0,38%  IndexedDB        [kernel.kallsyms]            [k] handle_mm_fault                                      ▒
   0,35%  IndexedDB        [kernel.kallsyms]            [k] __alloc_pages_nodemask                               ▒
   0,34%  IndexedDB        [kernel.kallsyms]            [k] swapgs_restore_regs_and_return_to_usermode           ▒
   0,32%  IndexedDB        [kernel.kallsyms]            [k] __mod_zone_page_state                                ▒
   0,30%  IndexedDB        [kernel.kallsyms]            [k] __mod_node_page_state                                ▒
   0,29%  IndexedDB        [kernel.kallsyms]            [k] pagevec_lru_move_fn                                  ▒
   0,28%  IndexedDB        [kernel.kallsyms]            [k] alloc_pages_vma                                      ▒
   0,27%  IndexedDB        [kernel.kallsyms]            [k] free_pages_and_swap_cache                            ▒
   0,26%  IndexedDB        libc-2.26.so                 [.] __GI_wcrtomb
It's interesting that a significant fraction of the time is being spent in the kernel, not in userspace. (This is a KPTI-enabled kernel, so syscalls are a bit slower than they'd be a few weeks ago, but still, it shouldn't be that bad.)
sesse
on 6 Jan 2018
10 seconds at my side with KPTI-disabled kernel
But I only have 4 conversations with a limit of 500 messages each and I didn't used the chrom plugin before.
I started fresh with the standalone app and a not working first sync.
Signal 1.1.0
Linux Ubuntu Mate 17.10 x64
Kernel 4.13.0-21-generic
 MartinX3
on 6 Jan 2018
MartinX3
on 6 Jan 2018
@MartinX3 We really need logs, especially in situations where it "doesn't work." And we need a lot more information about what "not working" really means. What exactly do you see?
scottnonnenberg
on 8 Jan 2018
@scottnonnenberg
I would like to provide a log, like @sesse
But I don't know how to profile the IndexedDB process on linux.
MartinX3
on 8 Jan 2018
After some stracing, I wonder if maybe the IndexedDB thread spends most of its CPU time talking to some other Signal process… Ie., that the problem isn't the database itself, but that the multi-process model causes huge overhead per query.
This is just a theory at this stage, though.
sesse
on 8 Jan 2018
So the SignalDB isn't loaded by a single thread?
That's sad in this use case.
MartinX3
on 8 Jan 2018
@sesse We do encryption via service worker so we don't block the main thread. And it does goes to the database for some things. You're saying that we might see some benefits by ensuring that our DB access is from one thread only? You've seen this in other LevelDB implementations?
scottnonnenberg
on 8 Jan 2018
When I say process, I really mean process—not thread. There are certainly two processes here (well, actually three), communicating by a UNIX domain socket. I don't know what they are talking about :-)
I don't know how service workers map to threads or processes. This is one of the problems of using JS for desktop applications; you're very far abstracted from the metal, so performance debugging can become very difficult.
sesse
on 8 Jan 2018
@sesse The way Electron works, built on top of Chromium, is that there are usually three processes. The overall management process, then a renderer process, then usually what appears to be a Chromium helper process - I'm not sure what goes on in that one; maybe visual compositing or something?
Anyway, you're saying that IndexedDB performance is slowing down because the process interacting with IndexedDB is frequently being interrupted for inter-process communication?
scottnonnenberg
on 8 Jan 2018
I'm not saying I have the answer by any means (I am definitely not an expert on Chrome internals!), but my theory is that IndexedDB lives in the helper process, so it sits behind (slow) inter-process communication.
sesse
on 8 Jan 2018
I have the same problem on all my computers. The ones with an SSD are a bit slower but it blocks generally between 2 and 10 minutes on startup.
 janLo
on 17 Jan 2018
janLo
on 17 Jan 2018
@janLo Please provide a bit more detail - do you see a 'messages so far' number counting up? How fast? How many messages with attachments do you generally receive? (we're downloading them on startup)
This issue is generally about situations where the number doesn't count up at all, or does it extremely slowly. Either way, a log from your large download would be useful. View -> Debug Log.
scottnonnenberg
on 17 Jan 2018
I see the "counting up" - depending on how many messages the machine had recieved in the past I've waited for numbers between 300 and 1500. I recieve messages with attachments occationally but not that often. maybe 1-5 per day. It also seems that these are all teh "old" messages, as the new ones that I received until the app was closed arrive when the UI is started.
The log is filled with
INFO 2018-01-16T22:58:15.334Z queueing envelope +[REDACTED]084.12 1515975123664
Same here. Takes forever to load conversation. 3 different devices. 3 different internet qualities. Makes no difference.
 entonjackson
on 18 Jan 2018
entonjackson
on 18 Jan 2018
@entonjackson Thanks for weighing in. Please provide logs including times you experience slow startup and slow conversation load, as well as details about your computer. It will really help us figure out what we can do to improve things.
scottnonnenberg
on 18 Jan 2018
I'd like to mention, that this happens only since I use the "standalone" version. It never happened with the chrome app.
janLo
on 18 Jan 2018
@janLo The Chrome app had the same 'counting up' screen. Are you saying that you never saw it, or are you saying that it never took this long? What OS are you on, by the way? Logs would be useful as well.
scottnonnenberg
on 18 Jan 2018
It was never long enough for me to notice.
janLo
on 18 Jan 2018
i just wanted to chime in a bit to see if i can get confirmation on this being a confirmed issue or not.
i send easily 100+ messages a day using the desktop app, as others have noted after a couple hundred to a thousand or two messages the app gets slow to start specifically to load a contact window that has a lot of history. Worse when i get to the point where i have many thousand of messages with a specific contact, the client will actually take a few seconds to send. i will type a message, press enter and it will sit a bit. during which time i could still change the message which was nice sometimes, but i saw that might have been fixed.
If this is a confirmed issue and my info can be of any assistance please let me know.
 DracoLlasa
on 19 Jan 2018
DracoLlasa
on 19 Jan 2018
@DracoLlasa Your logs would be useful, since they will show initial startup time as well as conversation load time. Please don't hesitate to include them in the future. :0)
scottnonnenberg
on 19 Jan 2018
@scottnonnenberg ok no problem, this is the first time i have contributed here, would the log you want be from the "view | Debug log" menus option? if not let me know from where.
If it is that debug log, should i use the 'submit' button there or just pull the relevant logs from a startup and such and post it here or in an attached txt file
DracoLlasa
on 19 Jan 2018
@DracoLlasa View -> Debug Log, then upload that log, then take the URL of that upload and paste it here.
scottnonnenberg
on 19 Jan 2018
I had another fairly slow startup today. This time, I captured a perf with -g, which told me this:
-   13,70%     0,00%  IndexedDB        libpthread-2.26.so                       [.] __GI___libc_pread64                      ▒
   - __GI___libc_pread64                                                                                                     ▒
      - 6,92% entry_SYSCALL_64_fastpath                                                                                      ▒
         - sys_pread64                                                                                                       ▒
            - 6,90% vfs_read                                                                                                 ▒
               - 6,90% __vfs_read                                                                                            ▒
                  - 6,89% generic_file_read_iter                                                                             ▒
                     - 6,31% copy_page_to_iter                                                                               ▒
                        - copyout                                                                                            ▒
                           - 6,26% copy_user_enhanced_fast_string                                                            ▒
                              - 4,50% page_fault                                                                             ▒
                                 - 4,44% __do_page_fault                                                                     ▒
                                    - 4,27% handle_mm_fault                                                                  ▒
                                       - 4,21% __handle_mm_fault                                                             ▒
                                          + 2,68% alloc_pages_vma                                                            ▒
                                            0,65% _raw_spin_lock                                                             ▒
        5,15% copy_user_enhanced_fast_string                                                                                 ▒
      + 0,75% return_from_SYSCALL_64
It seems that IndexedDB opens every single shard I have and wants to read a bit from it (probably the bloom filter or something similar). Since I have 647 shards, this takes a fair amount of time…
I think a relevant question to the other reporters in the threads is what this returns:
ls -l ~/.config/Signal/IndexedDB/file__0.indexeddb.leveldb/ | wc -l
It would be interesting to see if there's a correlation between number of shards and startup slowness.
There's also seemingly somehow VM pressure just moving data around (I don't know for what, the stack unwinding somehow don't extend far enough):
-   13,58%     4,10%  IndexedDB        libc-2.26.so                             [.] __memmove_avx_unaligned_erms             ▒
   - 11,41% __memmove_avx_unaligned_erms                                                                                     ▒
      - 4,95% page_fault                                                                                                     ▒
         - 4,90% __do_page_fault                                                                                             ▒
            - 4,64% handle_mm_fault                                                                                          ▒
               - 4,52% __handle_mm_fault                                                                                     ▒
                  - 2,94% alloc_pages_vma                                                                                    ▒
                     - 2,91% __alloc_pages_nodemask                                                                          ▒
                        - get_page_from_freelist                                                                             ▒
                             2,27% clear_page_erms                                                                           ▒
                    0,57% _raw_spin_lock                                                                                     ▒
        2,93% __memmove_avx_unaligned_erms                                                                                   ▒
        0,70% error_entry
Would a solution for this problem speed up the sync process with the app?
MartinX3
on 22 Jan 2018
@scottnonnenberg thanks, i was checking it out yesterday and think i sorted out what to select to send.. was going to do it tonight after work but got the new version and i can tell its much quicker to load.. i will keep an eye on it and not do anything to intentionally clean up old messaged and stuff like i did last time it got real bad.
DracoLlasa
on 24 Jan 2018
Not as slow as it used to be but still slower than any version of the chrome app: https://gist.github.com/e5b771b160d813dfb91a7bcbcdce17e7
janLo
on 24 Jan 2018
@janLo Apologies if I've mentioned this before, but one reason the Chrome App was 'faster' is because it was always running - it was running anytime you had your Chrome browser running. This meant that it had to download large amounts of messages less often, and when it did, it started downloading before you even opened the window.
scottnonnenberg
on 24 Jan 2018
I did an iostat during a slow load:
Device            r/s     w/s     rkB/s     wkB/s   rrqm/s   wrqm/s  %rrqm  %wrqm r_await w_await aqu-sz rareq-sz wareq-sz  svctm  %util
sda              6,78    4,32    250,61    144,32     0,36     5,80   5,02  57,34    1,24   61,79   0,28    36,96    33,45   4,18   4,63
sda             99,00    0,00   7044,00      0,00     0,00     0,00   0,00   0,00    0,36    0,00   0,04    71,15     0,00   0,28   2,80
sda             89,00   93,00  10444,00    620,00     0,00    11,00   0,00  10,58    0,40    0,00   0,04   117,35     6,67   0,20   3,60
sda            286,00    0,00  35160,00      0,00     0,00     0,00   0,00   0,00    0,43    0,00   0,12   122,94     0,00   0,39  11,20
sda             98,00    0,00  11864,00      0,00     0,00     0,00   0,00   0,00    0,45    0,00   0,04   121,06     0,00   0,33   3,20
sda            104,00    0,00  13092,00      0,00     0,00     0,00   0,00   0,00    0,35    0,00   0,04   125,88     0,00   0,31   3,20
sda            511,00    3,00  64692,00     76,00     0,00    17,00   0,00  85,00    0,47    8,00   0,26   126,60    25,33   0,45  23,20
sda            134,65    0,00  16760,40      0,00     0,00     0,00   0,00   0,00    0,50    0,00   0,06   124,47     0,00   0,41   5,54
sda             90,00    0,00  10832,00      0,00     0,00     0,00   0,00   0,00    0,40    0,00   0,04   120,36     0,00   0,36   3,20
sda             87,00    1,00  10348,00   1076,00     0,00     0,00   0,00   0,00    0,83    4,00   0,08   118,94  1076,00   0,68   6,00
How much stuff are you loading from the DB on startup, anyway? Either IndexedDB has a huge startup overhead, or your schema is designed so that you need to do too many queries.
sesse
on 27 Jan 2018
@sesse I think the large amount of data saved and loaded has to do with our caching mechanism for not-yet-processed messages. Before we attempt to decrypt a message, we put it in the database. Then when we've successfully decrypted it, we update it in the database. And then finally when we've processed it fully, we create the real message in the database and delete the cached data.
This is a lot of creates, updates and deletes, especially when we're processing hundreds of messages because the queue has filled up since we were last running.
But it does ensure that we're resilient in the face of crashes, or even the user closing the app while we're loading messages.
scottnonnenberg
on 29 Jan 2018
FWIW, I doubt I ever start up Signal and there's hundreds of messages in the queue, but I could be mistaken.
sesse
on 29 Jan 2018
Also, hundreds of messages or not; you are reading _hundreds of megabytes_ of data on startup, as far as I can tell. It can't all be about a few hundred kilobyte-large messages being stored two or three times :-)
sesse
on 29 Jan 2018
@sesse Maybe there are Metadata for every single Message + serialized Photos and Videos in your Chats?
MartinX3
on 29 Jan 2018
There are, but still, why should they need to be loaded on startup? I don't suppose Signal needs to open every single old message I have just to boot?
sesse
on 29 Jan 2018
@sesse We do a few index-based queries on startup, like checking for expired disappearing messages, or looking for any cached messages which didn't finish processing. When we do database schema updates, we sometimes do loop through every single object from a certain store, but that's uncommon. When we process a message, we first determine whether it's a duplicate by checking our database, again using an index-based query.
As an expert in IndexedDB, perhaps you can talk about how index scans are implemented? Surely we don't read that much data from disk when we do a index-based query?
scottnonnenberg
on 29 Jan 2018
I'm afraid I'm nowhere near an IndexedDB expert. :-) I was involved in open-sourcing parts of LevelDB (in particular, the parts relating to compression), and I've also used its internal predecessor (SSTable) a fair amount. But IndexedDB is on top of that again, and that's where any secondary indexing sits—and I've never touched it.
sesse
on 29 Jan 2018
@sesse Do you have the log to go along with that 'reading hundreds of megabytes' slow load?
scottnonnenberg
on 29 Jan 2018
I think this is the one: https://gist.github.com/anonymous/d54f911f5e5083bf24eca6678b172ede . It looks as if it may have scrolled out, though :-/
In general, it appears LevelDB is performing very poorly on my system. There shouldn't be hundreds of these really small files, e.g. this from the LevelDB log (LOG in the directory):
2018/01/28-19:52:10.889 11030 Compacting 1@2 + 29@3 files
2018/01/28-19:52:10.917 11030 Generated table #18250@2: 8 keys, 711 bytes
2018/01/28-19:52:10.943 11030 Generated table #18251@2: 3 keys, 1092 bytes
2018/01/28-19:52:10.969 11030 Generated table #18252@2: 2 keys, 1096 bytes
2018/01/28-19:52:11.000 11030 Generated table #18253@2: 3 keys, 830423 bytes
2018/01/28-19:52:11.027 11030 Generated table #18254@2: 4 keys, 1627 bytes
2018/01/28-19:52:11.055 11030 Generated table #18255@2: 7 keys, 2812 bytes
2018/01/28-19:52:11.101 11030 Generated table #18256@2: 1 keys, 3740570 bytes
2018/01/28-19:52:11.127 11030 Generated table #18257@2: 5 keys, 1815 bytes
2018/01/28-19:52:11.154 11030 Generated table #18258@2: 2 keys, 1087 bytes
2018/01/28-19:52:11.180 11030 Generated table #18259@2: 2 keys, 1158 bytes
2018/01/28-19:52:11.206 11030 Generated table #18260@2: 2 keys, 949 bytes
2018/01/28-19:52:11.232 11030 Generated table #18261@2: 2 keys, 1102 bytes
2018/01/28-19:52:11.258 11030 Generated table #18262@2: 1 keys, 841 bytes
2018/01/28-19:52:11.285 11030 Generated table #18263@2: 2 keys, 916 bytes
2018/01/28-19:52:11.311 11030 Generated table #18264@2: 2 keys, 1308 bytes
2018/01/28-19:52:11.337 11030 Generated table #18265@2: 3 keys, 1331 bytes
2018/01/28-19:52:11.363 11030 Generated table #18266@2: 1 keys, 841 bytes
2018/01/28-19:52:11.390 11030 Generated table #18267@2: 1 keys, 657 bytes
2018/01/28-19:52:11.419 11030 Generated table #18268@2: 1 keys, 723 bytes
2018/01/28-19:52:11.459 11030 Generated table #18269@2: 2 keys, 2863460 bytes
2018/01/28-19:52:11.486 11030 Generated table #18270@2: 1 keys, 733 bytes
2018/01/28-19:52:11.512 11030 Generated table #18271@2: 2 keys, 1119 bytes
2018/01/28-19:52:11.540 11030 Generated table #18272@2: 1 keys, 733 bytes
2018/01/28-19:52:11.566 11030 Generated table #18273@2: 1 keys, 713 bytes
2018/01/28-19:52:11.592 11030 Generated table #18274@2: 1 keys, 783 bytes
2018/01/28-19:52:11.618 11030 Generated table #18275@2: 4 keys, 1906 bytes
2018/01/28-19:52:11.645 11030 Generated table #18276@2: 3 keys, 1314 bytes
2018/01/28-19:52:11.672 11030 Generated table #18277@2: 3 keys, 1655 bytes
2018/01/28-19:52:11.698 11030 Generated table #18278@2: 2 keys, 1339 bytes
2018/01/28-19:52:11.739 11030 Generated table #18279@2: 1 keys, 2804578 bytes
2018/01/28-19:52:11.739 11030 Compacted 1@2 + 29@3 files => 10269392 bytes
2018/01/28-19:52:11.766 11030 compacted to: files[ 0 0 24 261 400 0 0 ]
All these level-2 shards at a few kilobytes? That looks strange to me.
sesse
on 29 Jan 2018
As an expert in IndexedDB, perhaps you can talk about how index scans are implemented? Surely we don't read that much data from disk when we do a index-based query?
I look a look in the IndexedDB documentation, and it seems simple enough: For each entry in the index, you have a LevelDB entry. That entry tells you the primary key, where the real record is.
So if you're doing a scan along an index, you'll have some nice and regular reads for the index itself, and then a bunch of really random lookups throughout the actual data. So they are certainly more costly than reading over the primary key (not surprising), although hundreds of megabytes sounds maybe a bit excessive. How many records are you expecting to read in the typical case?
sesse
on 29 Jan 2018
@sesse Clearly we're not in the right ballpark with all this guessing. We don't do massive reads. What I suspect is that there are some sort of cleanup/compaction operations going on because we've fragmented the database, or added enough, or deleted enough.
scottnonnenberg
on 30 Jan 2018
I don't see there being done massive compactions; if so, there would be write activity, not just read activity.
If you can reproduce this, generally have a look at the LOG file LevelDB leaves in the directory. It mentions all new shards, compactions, etc. as they go (but not reads). In my case, it looks somehow like the compaction scheme has gone all awry (way too many level-2 and level-3 files, and any level-0 file that's being written is pretty much immediately causing a compaction), and you'd probably need some real LevelDB expertise to figure out why.
sesse
on 30 Jan 2018
https://gist.github.com/1033d5b648075d17d830ec7224ec0060
Linux Ubuntu Mate x64 17.10
Here is a new log.
I restarted my PC and I'm hearing my HDD.
There are many HDD-Accesses-Tasks slowing down the whole system, while this APP stats up.
MartinX3
on 9 Feb 2018
Same problem here.
Using Linux Mint 18.3 x64 Mate.
All 4 cpu cores are at ~100%.
The HDD is under heavy load.
Here is my log:
https://gist.github.com/anonymous/315bc653b9243b06aeefa9920ba26b8f
 Terenceskill
on 9 Feb 2018
Terenceskill
on 9 Feb 2018
I'll chip in a set of logs, on a Dell XPS 13 running Debian Buster (testing):
https://gist.github.com/konklone/e67d649c95b32d1c1f9709e454c27dcd
I didn't record the CPU load or disk load, but it definitely felt like a 100% saturated set of CPUs, for at least 5 minutes, maybe 10. My .config/Signal directory reads 55M when I run du -sh . in it.
I've observed this behavior before several times, a long and consuming CPU experience while the message count goes up (very slowly) by 10 at a time. It doesn't happen on every single app startup, but it's fairly frequent -- I imagine it relates to the unpredictable delays and densities of conversations I have in Signal between application opens.
 konklone
on 14 Feb 2018
konklone
on 14 Feb 2018
Hi
same issue here on an Asus Debian SID. 10 min to load messages (probably many of them)
https://debuglogs.org/9b6f53eb38ac0ea2ba4c8c11f5289e0d7fb0963c0446467a564d483968059ca6
Have a great day
 clavelc
on 6 Apr 2018
clavelc
on 6 Apr 2018
"Me Too". Have not long started using the Desktop app (infrequently).
Starting it up today took several minutes, debug log contains lines like this:
INFO 2018-04-29T08:19:09.043Z Ignore invalid expire timer. Expected numeric expireTimer, got: null
INFO 2018-04-29T08:19:09.145Z Ignore invalid expire timer. Expected numeric expireTimer, got: null
INFO 2018-04-29T08:19:09.186Z Ignore invalid expire timer. Expected numeric expireTimer, got: null
Claimed to need to load >1000 messages, which i'd be surprised at, but I suppose that's not entirely impossible...
Windows 7 Home 64 bit.
Unsure if it finished loading because it was done, or because I had time to Find this thread in the background and then bring up the log file...
 blakjaknz
on 29 Apr 2018
blakjaknz
on 29 Apr 2018
@blakjaknz Thanks for the report. A couple of notes that might shed some light on long startup times:
Ignore invalid expire timer. Expected numeric `expireTimer`: got nullis a known debug message and unrelated to startup performance. It should go away as our other apps get upgraded.- Download counter shows 1000+ messages: That number can be misleading as we count every kind of message, e.g. read sync, contact sync, safety number change, etc. as separate message, not just ones that have been sent to you from another user. So even not connecting for a day or two can make that number become very large.
- Recent versions of the app have introduced new indexes for our IndexedDB database and for users with large databases this can introduce an unfortunate startup delay. We have already heavily invested in making our users’ (and our own 😉) databases smaller by moving attachments onto disk: https://github.com/signalapp/Signal-Desktop/releases/tag/v1.7.0
Could you please share your full debug log so we can investigate the root cause of your poor startup performance?
 gasi-signal
on 1 May 2018
gasi-signal
on 1 May 2018
I can still confirm, that the Signal Desktop App under Linux Ubuntu 18.04 is using my entire HDD performance.
MartinX3
on 1 May 2018
Debug log for a slow startup on Arch Linux: https://debuglogs.org/09c9db3bcdd413978b7c50104de4cec0b469c37eb2b131f214580639a9f1474f
 captn3m0
on 5 Jun 2018
captn3m0
on 5 Jun 2018
I deleted the directory ~/.config/Signal/attachments.noindex. As a result signal-desktop starts fast again. The drawback is that all attachments (images, videos,...) are lost.
I guess the loading routine of these simply is not implemented very efficient.
 rahra
on 27 Jun 2018
rahra
on 27 Jun 2018
@rahra Next time, before taking drastic steps like that, please provide a debug log to help us determine the cause of the slowdown on your machine. For example, I'm not sure why deleting all of your attachments would make startup of the app slower. I can imagine that it might make the load of a given conversation faster, since all the attachments would be gone, but not overall startup.
 scottnonnenberg-signal
on 27 Jun 2018
scottnonnenberg-signal
on 27 Jun 2018
https://debuglogs.org/50f8e0e230d72c4b8c4e405a4bcb925d45bec930bdafb22a3860de890b650956
this is a debug log of my Android app, hope it helps
 knokelmaat
on 27 Jun 2018
knokelmaat
on 27 Jun 2018
@knokelmaat
This is about the desktop-app
MartinX3
on 27 Jun 2018
@scottnonnenberg Sorry, of course. But no problem since I made a backup before deleting.
Here's the log. But there seam to have been some code updates since then because it starts much faster (just a few seconds now) than it did 1 week ago (it took minutes).
https://pastebin.com/4U7zwF8e
The data contains 125 attachments, mostly images.
rahra
on 2 Jul 2018
Another debug log where I see this problem: https://gist.github.com/rfjakob/9eb86a8d350a6b2429df51bbed98c401
Startup took two minutes:
INFO  2018-07-14T07:57:34.800Z app ready
[...]
INFO  2018-07-14T07:59:34.787Z draw attention
 rfjakob
on 14 Jul 2018
rfjakob
on 14 Jul 2018
@rfjakob About how long had it been since you last had opened desktop? I count 35 contact syncs, each of which requires a file download - I'd like to calculate an average number of contact syncs per day for you. I assume you're using Android, BTW? Also, how high did the counter on the loading screen get?
scottnonnenberg-signal
on 15 Jul 2018
1 or 2 weeks I'd say. Yes my mobile phone is Android. The counter got to about 300 I think.
rfjakob
on 15 Jul 2018
This is the second time I tried to make a gif of the slow startup. And again, after a few botched recordings and signal restarts, the startup is fast again:

Looks like it needs a few days of not running for becoming slow?
rfjakob
on 15 Jul 2018
@rfjakob Signal Desktop downloads all of your queued messages on the server on startup. So yes, if you haven't opened it in a while, it will take some time to download all the messages that your phone has been downloading one at a time.
scottnonnenberg-signal
on 16 Jul 2018
Ok. What kind of download speed would you expect? Looks like less than 1 message per second at the moment.
rfjakob
on 17 Jul 2018
@rfjakob If those messages contain attachments (which contact syncs do) and those attachments are somewhat large, per-message performance might be very slow. Without attachments, something like 20-50 per second is expected.
scottnonnenberg-signal
on 17 Jul 2018
I open Signal Desktop it shows loading messages 50 so far then it opens (here is the debug log: https://debuglogs.org/04086d5c35b7c2cbfaeeebbd7dde080d8fe59faab566d6177314a5eb09032f19 ).
It shows no new messages. Then I close it and start it again and it shows loading messages 10 so far (here is the debug log: https://debuglogs.org/5934c19820dca2f6195ce7fbecd4b79f2f1ee3fb1c69f13d2615636297ce836d ).
At the mean time between these two startups (round about 10 seconds) I didn't get any message. So I don't know why Signal Desktop loads new messages after I closed it, because I didn't get any new messages since the last time I used Signal Desktop (20 seconds before).
 0xmatthias
on 24 Jul 2018
0xmatthias
on 24 Jul 2018
I can confirm @rahra "fix" just moved ~/.config/Signal/attachments.noindex to ~/ started signal desktop (it starts really fast < 1s) close it moved attachments.noindex back to ~/.config/Signal/ and started signal desktop again and it starts fast. Here is the debug log: https://debuglogs.org/8b62ee0456c608ef44313dd10cc233ab7e1545e009f71f06fe6ec81ed1a809d1
What I noticed all the Ignore invalid expire timer. Expected numeric expireTimer: got null messages are gone.
0xmatthias
on 24 Jul 2018
@0xmatthias In some cases, when we fail to process a message, we will try to process it again on startup. That's why you're seeing messages processed after restarting with no messages pending.
I wouldn't expect that removing the attachments directory would improve performance; it would just make it so we don't have any of your attachments to load and display anymore. You had lots of these errors in your log:
ERROR 2018-07-24T12:29:59.689Z Top-level unhandled promise rejection: Error: ENOENT: no such file or directory, open '/home/signal/.config/Signal/attachments.noindex/bc/bc05d61db65f60012fbdf0a0230b772da4e23c10abedebafed0f8b556a2003cf'
In general, starting the application once, and then starting it again immediately after will result in a radical performance improvement, simply because the first start did all the work: downloading and processing all outstanding messages. The second startup just starts up, no need to download or process anything.
scottnonnenberg-signal
on 24 Jul 2018
@scottnonnenberg Yeah the error messages came after I clicked on the conversation and scrolled to media messages. So I expected them.
That's exactly what I thought would happen, but it didn't happened.
First time I started it took nearly as long as the second time (15-20 seconds).
But after i moved the attachment file signal started really fast < 1s.
0xmatthias
on 25 Jul 2018
I see there's a new version now (it spent some time “optimizing messages” on first boot, and has a new look), and as far as I can see, the best case has become significantly worse. (I can't say anything about the worst case before having used it for a while.)
Now even with warm cache (start, close, then measure start the second time) it takes 25–30 seconds to start up. This isn't I/O bound anymore; now it's using one core pegged at 100%, plus another core at 15% or so. It's “Loading…”, then “Optimizing application…”, then “Loading…” again before the UI finally shows up.
sesse
on 6 Aug 2018
@sesse As you may have noticed, we started using SQLCIpher in the most recent release. Perhaps that has had a negative affect for you? Either way, we'll need logs to better understand that.
scottnonnenberg-signal
on 6 Aug 2018
sesse
on 6 Aug 2018
@sesse Very interesting!
INFO  2018-08-06T17:21:20.900Z upgradeMessages: upgrade without index complete!
INFO  2018-08-06T17:21:33.871Z upgradeMessages: upgrade with index {"done":true,"numProcessed":0,"fetchDuration":12969,"upgradeDuration":0,"saveDuration":0,"totalDuration":12969}
Though we had already migrated to SQLCipher, the code left in the product to ensure everything is migrated over took 13 seconds to do a query on an empty indexeddb. That's something we'll have to think about for folks like you, with your 30k migrated messages!
Again, thanks for providing your log. With all the recent change, it's important to get data from heavy users like you.
scottnonnenberg-signal
on 6 Aug 2018
So can I kill the old IndexedDB, then? :-)
sesse
on 6 Aug 2018
@sesse The release notes mention this as Phase 1, so no, that would be very destructive to the app. https://github.com/signalapp/Signal-Desktop/releases/tag/v1.15.0
scottnonnenberg-signal
on 6 Aug 2018
Been having this bug for a while and it just bothered me enough to search and find this issue...
My usage pattern is maybe dozens or low-hundreds of messages per day all with one contact, maybe 1-5 attachments per day. I rarely use the desktop client, but when I do start it, the first startup is slow, with "loading messages" slowly progressing 10 at a time for many minutes. Subsequent startups done the same day are practically instant.
Here's a debug log containing both a slow start and a fast start about 20 minutes later.
https://debuglogs.org/47970701a6b0f4275763e6cdc63b66d7392e3221f7e650934d2dd5bea2133a3f
 jbrzozoski
on 4 Sep 2018
jbrzozoski
on 4 Sep 2018
 janvlug
on 18 Nov 2018
janvlug
on 18 Nov 2018
This is the primary issue tracking slow startup: https://github.com/signalapp/Signal-Desktop/issues/3010
scottnonnenberg-signal
on 2 Jan 2019
I'm very happy to see this issue taken seriously.
 helgihg
on 18 Jan 2019
helgihg
on 18 Jan 2019
The issue persists here too.
janLo
on 18 Jan 2019
Not for me. Even if I drop the caches, Signal starts up in about two seconds.
sesse
on 18 Jan 2019
Issue still here in Linux desktop app 1.20.0
 4mig4
on 23 Jan 2019
4mig4
on 23 Jan 2019
3010 is locked, is seems that #3171 the appropriate issue to continue this.
 tuxayo
on 3 Jul 2019
tuxayo
on 3 Jul 2019
Related issues
 vincenzopalazzo
·
3Comments
vincenzopalazzo
·
3Comments
 halb9
·
3Comments
halb9
·
3Comments
 petcap
·
3Comments
petcap
·
3Comments
 ProactiveServices
·
3Comments
ProactiveServices
·
3Comments
 mawed
·
3Comments
mawed
·
3Comments
Most helpful comment
I'd like to mention, that this happens only since I use the "standalone" version. It never happened with the chrome app.