Pyvista: `PlotterITK.show(True)` only works as the last command of a Jupyter cell.
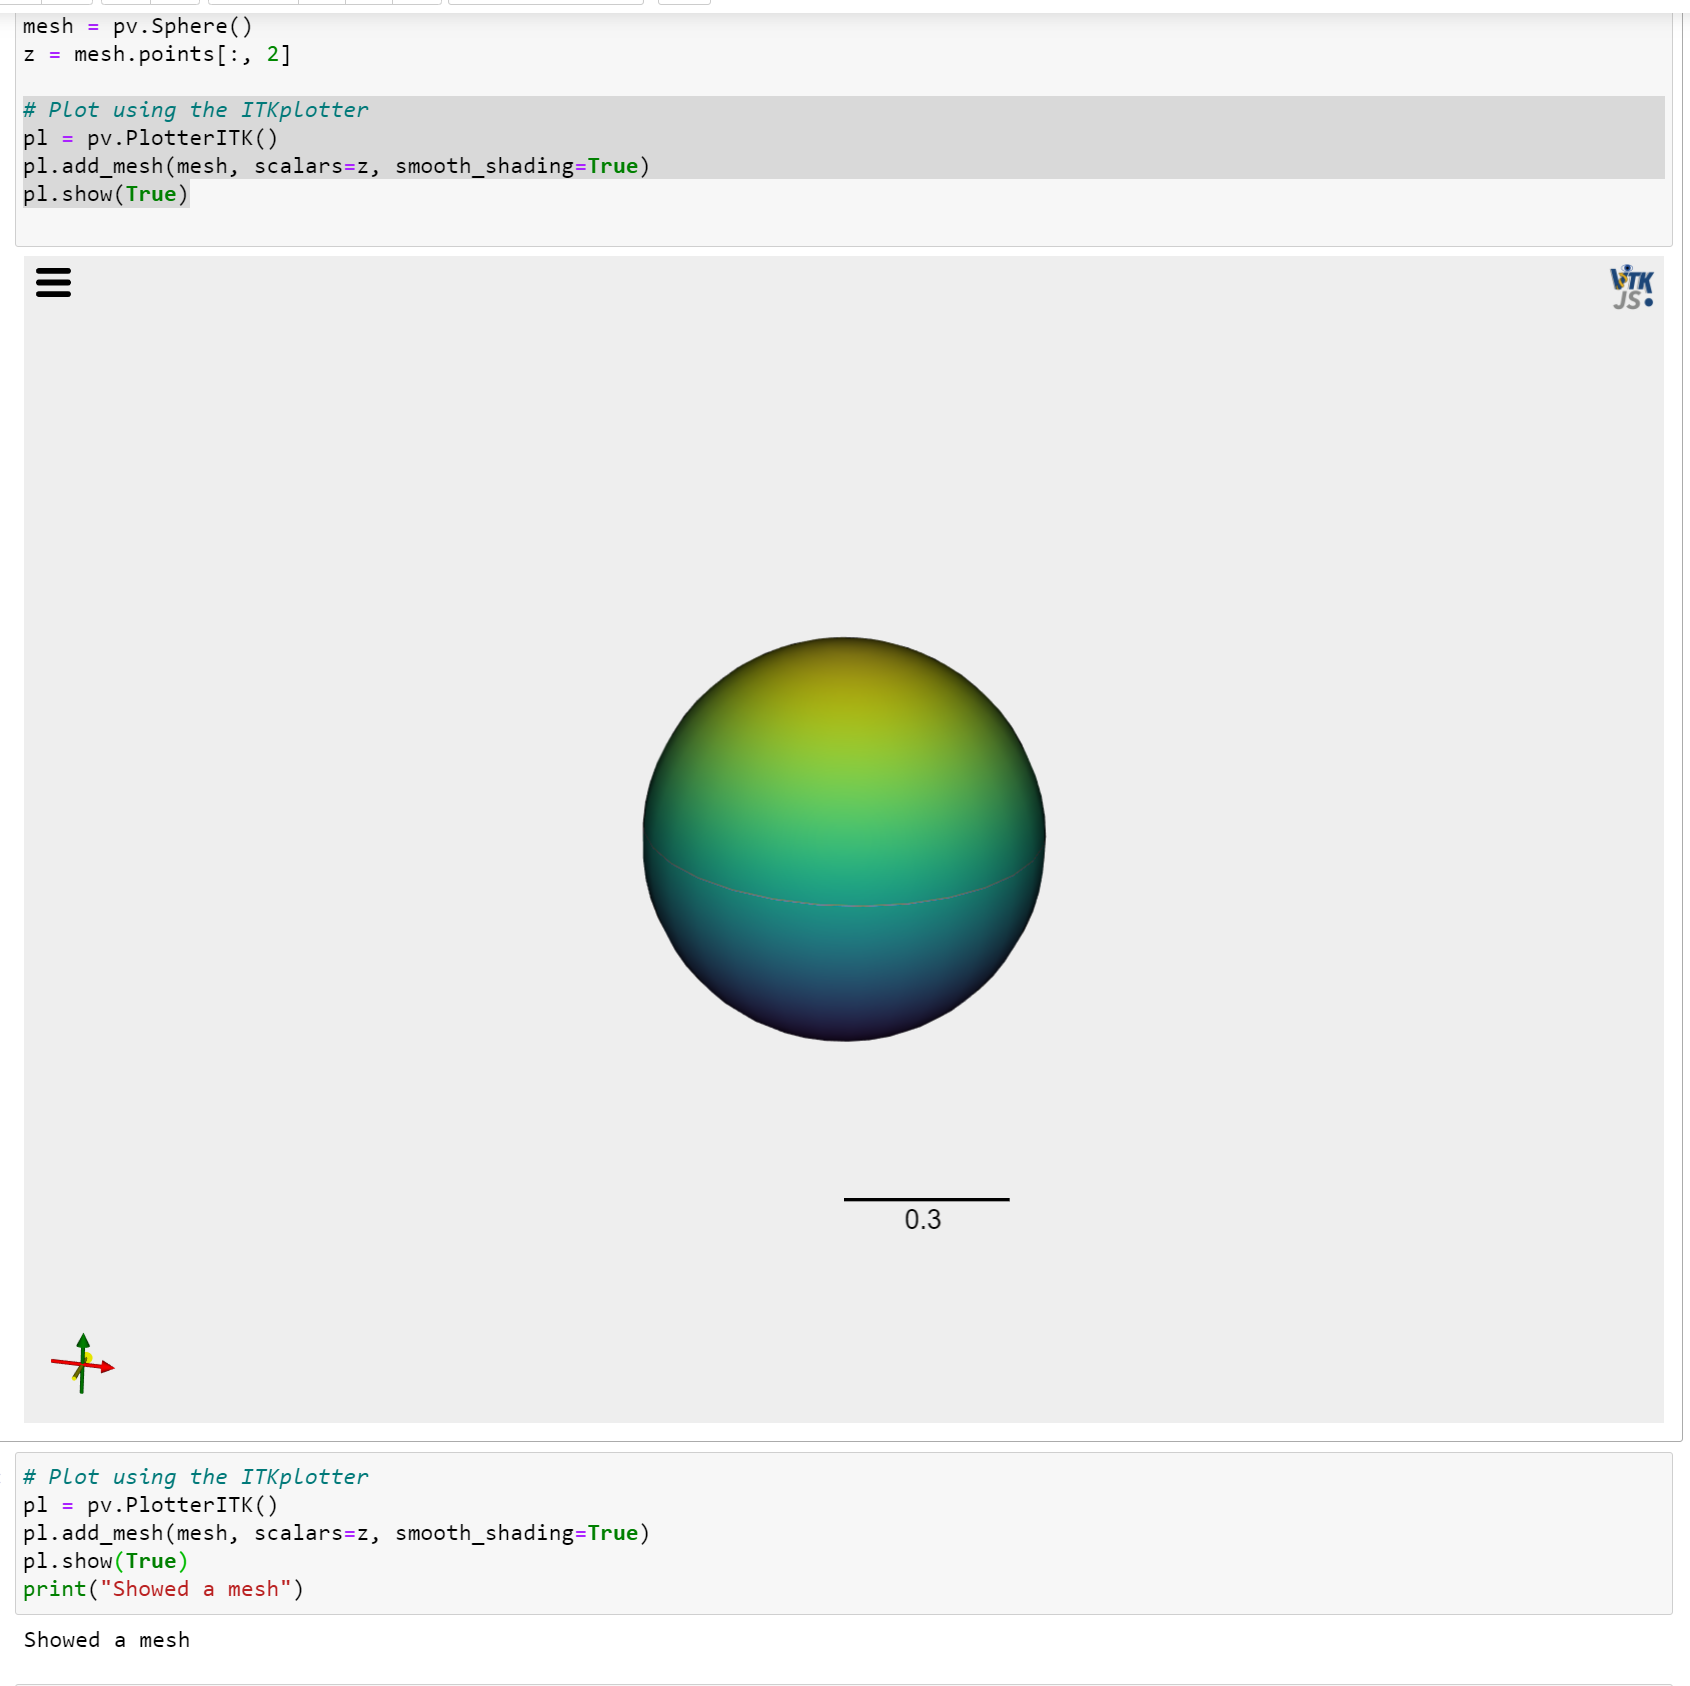
I've found that while the examples provide for plotting interactively in a Jupyter notebook work (very well!), slight modifications cause it to not plot anything. The MVE is a print command immediately following the call to show, which causes there to be no plot. I would have expected this to work similarly to the base Plotter where plots can be generated in the middle of a cell and potentially many per cell. If this is a known bug/limitation/feature, perhaps it could be more clearly documented.
To Reproduce
import pyvista as pv

# create a mesh and identify some scalars you wish to plot
mesh = pv.Sphere()
z = mesh.points[:, 2]

# Plot using the ITKplotter
pl = pv.PlotterITK()
pl.add_mesh(mesh, scalars=z, smooth_shading=True)
pl.show(True) # works
```py
pl = pv.PlotterITK()
pl.add_mesh(mesh, scalars=z, smooth_shading=True)
pl.show(True) # Doesn't work
print("Showed a mesh")
**Screenshots**
If applicable, add screenshots to help explain your problem.
-----
**System Information:**
```txt
--------------------------------------------------------------------------------
Date: Sun Oct 25 09:25:44 2020 Eastern Daylight Time
OS : Windows
CPU(s) : 8
Machine : AMD64
Architecture : 64bit
Environment : Jupyter
Intel : GPU Vendor
Intel(R) HD Graphics 630 : GPU Renderer
4.5.0 - Build 22.20.16.4749 : GPU Version
Python 3.7.7 (default, May 6 2020, 11:45:54) [MSC v.1916 64 bit (AMD64)]
pyvista : 0.25.3
vtk : 9.0.1
numpy : 1.19.0
imageio : 2.9.0
appdirs : 1.4.4
scooby : 0.5.6
meshio : 4.0.16
matplotlib : 3.3.0
IPython : 7.16.1
colorcet : 1.0.0
scipy : 1.5.1
itkwidgets : 0.32.0
tqdm : 4.48.0
--------------------------------------------------------------------------------
This is using jupyterlab==2.2.9 and Microsoft Edge. I can try to test it on other browsers/OSs if there is interest.
 russelldj
All 2 comments
This is a valid point! The arises from how we're returning a itkwidgets.widget_viewer.Viewer object, but we're not actively displaying it. By default, anything at the end of the cell that stands on its own and ipython/jupyterlab displays that. What I should have done when creating this module is simply called display from within the show method:
from IPython import display
import pyvista as pv
pl = pv.PlotterITK()
pl.add_mesh(pv.Sphere())
out = pl.show()
display.display_html(out)
print('weeeee')
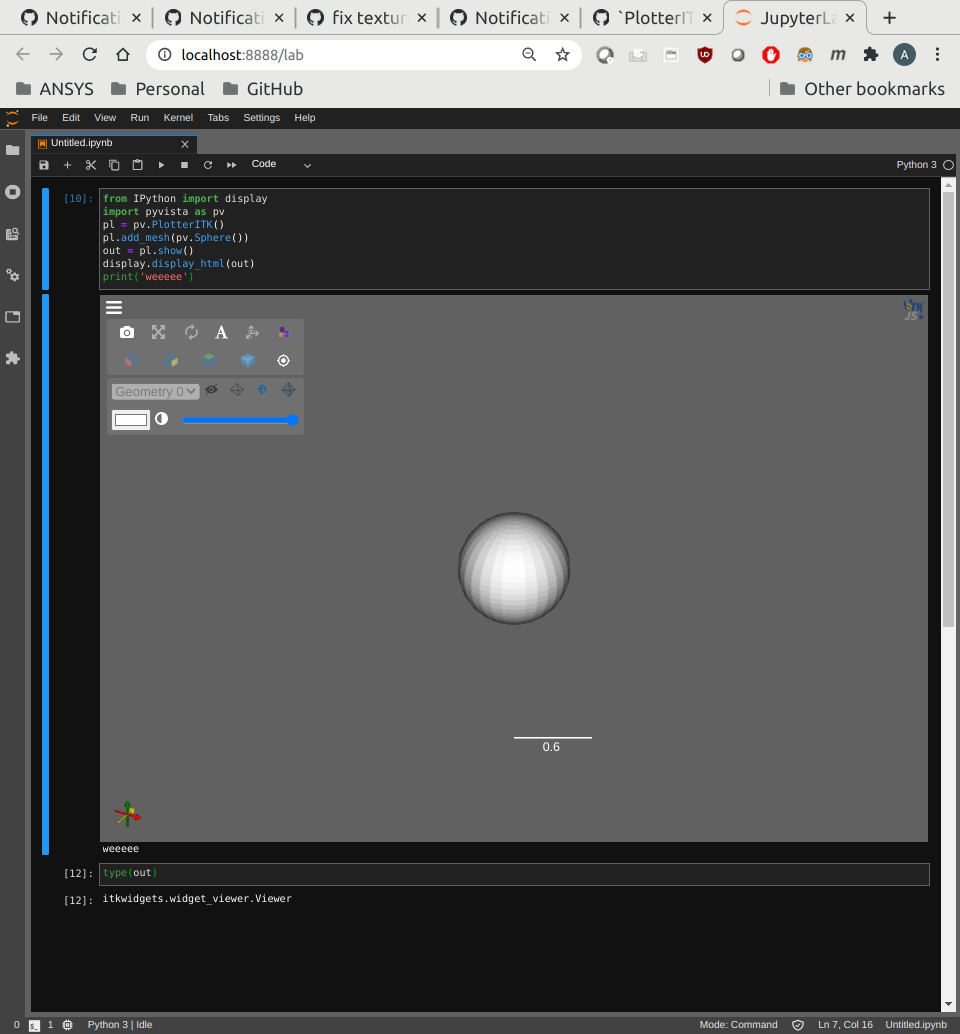
As you can see here, it works in this context, and this necessitates an update to the PlotterITK class.
 akaszynski
on 30 Oct 2020
akaszynski
on 30 Oct 2020
Fixed in 0.27.0
akaszynski
on 10 Nov 2020
Related issues
 rodrigomologni
·
3Comments
rodrigomologni
·
3Comments
 dcbr
·
4Comments
dcbr
·
4Comments
 KeunwooPark
·
4Comments
KeunwooPark
·
4Comments
 flothesof
·
4Comments
flothesof
·
4Comments
 JiaweiZhuang
·
6Comments
JiaweiZhuang
·
6Comments
Most helpful comment
Fixed in
0.27.0