Pyvista: Subplot axis labels moved after rescale
Describe the bug, what's wrong, and what you expect:
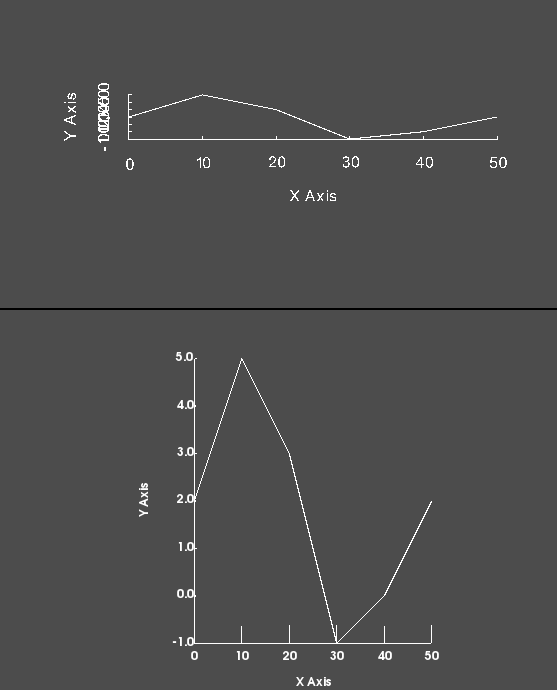
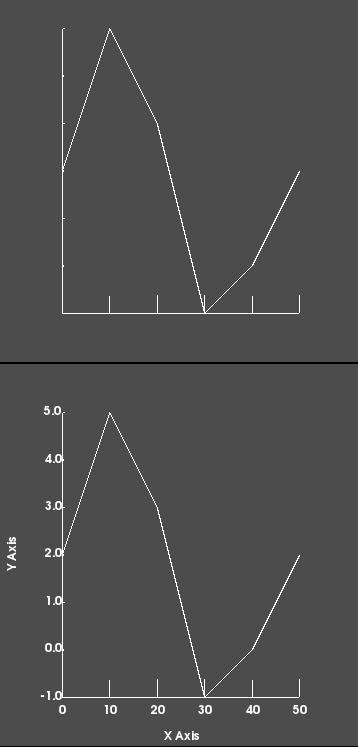
I would like to draw some 2D plots in several subplots. The data I would like to draw has a different scaling (orders of magnitude) in the X dimension compared to the Y dimension. The current way of tackling this is to plot the data, use plotter.set_scale and plotter.show_bounds (see code example below). This setup works perfectly fine in case there are no subplots. However, in a multi-view layout, the axis labels disappear in all but the bottom-left most subplot (see screenshot).
When zooming in to the subplots with disappeared labels, the labels start appearing and moving towards their respective locations. So it seems to me there is something wrong with their position?
I already had a look at different camera settings, but cannot seem to spot any major differences between the cameras of different subplots.
If you could point me in a direction to look for a solution, I can help to pinpoint what is causing this. But unfortunately I'm not a VTK expert and I don't really now where to start looking.
Alternatively, if there are other ways to make these 2D plots, that would be helpful as well! I found for example the vtkChartXY class, but I don't think it has been adopted by pyvista (yet)?
To Reproduce
import numpy as np
import pyvista as pv

xy_data = np.array([[0,2],[10,5],[20,3],[30,-1],[40,0],[50,2]])
points = np.concatenate((xy_data,np.zeros((xy_data.shape[0],1))),axis=1)

p = pv.Plotter(shape=(2,1))
p.subplot(0,0)
p.add_mesh(pv.lines_from_points(points))
p.set_scale(yscale=10) # If this line is commented out everything is fine, however I need to rescale to get a readable plot
p.show_bounds(show_zaxis=False,show_zlabels=False)
p.view_xy()
print(p.camera.GetWindowCenter())
p.subplot(1,0)
p.add_mesh(pv.lines_from_points(points))
p.set_scale(yscale=10)
p.show_bounds(show_zaxis=False,show_zlabels=False)
p.view_xy()
print(p.camera.GetWindowCenter())
p.show()
Screenshots
Without scaling in the top subplot:
With scaling in the top subplot:
System Information:
Please run the following code wherever you are experiencing the bug and paste the output below. This report helps us track down bugs and it is critical to addressing your bug:
# Get system info
import pyvista as pv
print(pv.Report())
# Paste system info here
--------------------------------------------------------------------------------
  Date: Mon Apr 27 17:22:05 2020 Romance Daylight Time
                OS : Windows
            CPU(s) : 8
           Machine : AMD64
      Architecture : 64bit
       Environment : Python
        GPU Vendor : ATI Technologies Inc.
      GPU Renderer : AMD Radeon(TM) RX Vega 10 Graphics
       GPU Version : 4.5.13541 Core Profile Context 25.20.14146.2002
  Python 3.7.7 (default, Apr 15 2020, 05:09:04) [MSC v.1916 64 bit (AMD64)]
           pyvista : 0.24.1
               vtk : 8.1.2
             numpy : 1.18.1
           imageio : 2.8.0
           appdirs : 1.4.3
            scooby : 0.5.3
            meshio : 4.0.11
             scipy : 1.4.1
  Intel(R) Math Kernel Library Version 2020.0.0 Product Build 20191125 for
  Intel(R) 64 architecture applications
--------------------------------------------------------------------------------
 dcbr
dcbr
All 4 comments
Hi and welcome! Thanks for posting your first issue in the PyVista project! Someone from @pyvista/developers will chime in before too long. If your question is support related, it may be automatically transferred to https://github.com/pyvista/pyvista-support
![github-actions[bot] picture](https://avatars.githubusercontent.com/in/15368?v=4&s=40) github-actions[bot]
on 27 Apr 2020
github-actions[bot]
on 27 Apr 2020
I found this example on the VTK site: https://lorensen.github.io/VTKExamples/site/Cxx/Visualization/CubeAxesActor2D/ and tried combining it with pyvista as follows:
import numpy as np
import pyvista as pv
import vtk

def show_axes(p):
    axes = vtk.vtkCubeAxesActor2D()
    axes.SetBounds(p.renderer.bounds)
    axes.SetCamera(p.camera)
    axes.SetFlyModeToClosestTriad()
    axes.ZAxisVisibilityOff()
    p.add_actor(axes)

xy_data = np.array([[0,2],[10,5],[20,3],[30,-1],[40,0],[50,2]])
points = np.concatenate((xy_data,np.zeros((xy_data.shape[0],1))),axis=1)

p = pv.Plotter(shape=(2,1))
p.subplot(0,0)
p.add_mesh(pv.lines_from_points(points))
p.set_scale(yscale=10)
show_axes(p)
p.view_xy()

p.subplot(1,0)
p.add_mesh(pv.lines_from_points(points))
p.set_scale(yscale=10)
p.show_bounds(show_zaxis=False,show_zlabels=False)
p.view_xy()
p.show()
which results in the following plot:
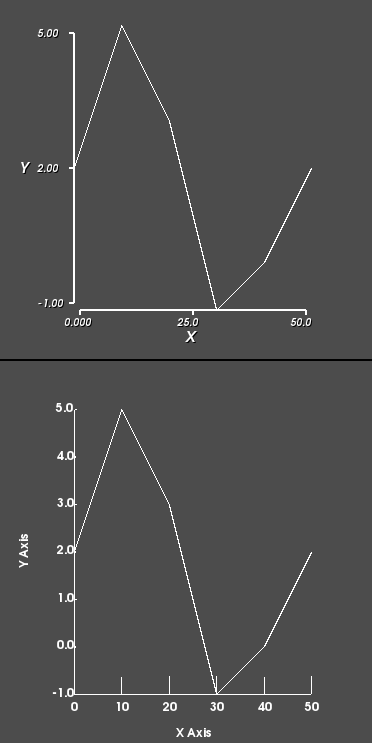
For my use case this works perfectly! And despite its name, it seems the vtkAxesCubeActor2D can actually plot scaled 3D axes as well.
dcbr
on 28 Apr 2020
Nice fix! We'll have to incorporate that when scaling axes so other users don't have the same issue. Thanks for posting your solution here.
 akaszynski
on 29 Apr 2020
akaszynski
on 29 Apr 2020
This is a really compelling use case for vtkAxesCubeActor2D! I had noticed the issues with the axes disappearing when doing scaled multi-plots in the past and ignored it assuming it was an upstream issue.
Unfortunately, there's no easy way to plug this into PyVista's show_bounds method without a significant refactor (as we have a lot of code to set colors, font sizes, axis ticks, etc. which are not the same between the vtkAxesCubeActor2D and vtkAxesCubeActor classes. I think the best route forward would be to add another method called show_bounds_2d() and deprecate the possibly deprecate the use_2d option of show_bounds
 banesullivan
on 29 May 2020
banesullivan
on 29 May 2020
Related issues
 zhaofenqiang
·
5Comments
zhaofenqiang
·
5Comments
 JiaweiZhuang
·
6Comments
JiaweiZhuang
·
6Comments
 KeunwooPark
·
4Comments
KeunwooPark
·
4Comments
 rodrigomologni
·
3Comments
banesullivan
·
4Comments
rodrigomologni
·
3Comments
banesullivan
·
4Comments