Picongpu: Density of fully ionised gas does not match?
Hi,
Good evening. I am testing the density of a fully ionized helium gas by using [email protected]. I initialized a homogeneous profile with the following params:betatron_test.zip
The base density is set to be the Helium ion density
#ifndef PARAM_BASE_DENSITY_SI
#   define PARAM_BASE_DENSITY_SI 4.0e24
#endif
In speciesInitialization.param, I am following the manual by using ProtonTimesWeighting:
    using InitPipeline = bmpl::vector<
        CreateDensity<
            densityProfiles::Homogenous,
            startPosition::Random2ppc,
            PIC_Helium
        >,
        ManipulateDerive<
            manipulators::binary::ProtonTimesWeighting,
            PIC_Helium,
            PIC_Electrons
        >
    >;
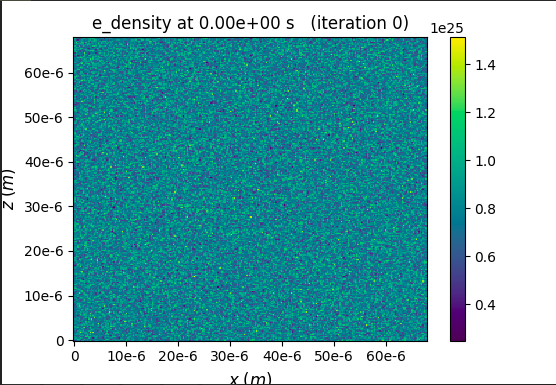
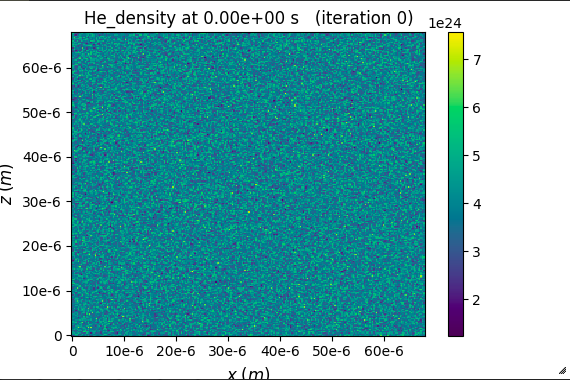
So the electron density to be created will be 2 times that is 8e24. I assume ne = Z*ni, where Z is the charge of Helium. I then plot the result of zero time step by using openPMD. The Helium density here is 8e24 while the electron density is 1.5e25, which is 4 times the base density.
Did I set something wrong or miss something? Thanks.
 StevE-Ong
All 7 comments
Hello @StevE-Ong .
Sorry, I am perhaps missing something. But from the colorbars on the plots attached it seems the He_density is about 4e24 (so base density) and e_density about twice that. Could you clarfy where does e.g. the 1.5e25 electron density value come from? - to me it looked to just be the max tick on the colorbar.
So I think your expectation that electron density should be 8e24 is correct. I just don't see how the plots contradict that.
 sbastrakov
on 6 Nov 2020
sbastrakov
on 6 Nov 2020
Thanks for your reply @sbastrakov. I am looking at the maximum of the tick at the colorbar so the density is 1.5e25. Isn't it the maximum should not be more than the base density? Or how should I look at it?
StevE-Ong
on 6 Nov 2020
So initially we generate macroparticles according to the user-given density, in your case uniform. We (and other PIC codes as well as far as I know) do not actually sample the given density fully randomly on the whole simulation area, as this would be problematic computationally. Instead, we do it on a cell basis: evaluate the density functor for each cell, from there get the expected number of physical particles for this cell, then take into account user-requested particles per cell (in your case 2) and MIN_WEIGHTING and finally get the number of macroparticles for this cell. This many macroparticles are created and Initial positions are selected according to the second parameter of CreateDensity, in your case randomly inside the cell.
So if you integrate over a reasonably large volume, by counting the number of physical particles (as number of macroparticles times weighting, as your weighting is constant in this case) and divide by the volume it should give a number that's very close to your expected density.
However, this density output you've got is not computed like that. Instead, it is based on actual data of macroparticles in simulation and computed with the same resolution as grid for fields. Since you only have 2 macroparticles per cell, distributed randomly inside, naturally it can be that a certain grid node would have macroparticles spawned near it from many of the adjacent cells. And so this value of density would be larger than average. And some nodes would have particles father than average and so smaller than average density. These fluctuations in the output density should decrease with taking a larger volume (so even from this output if you average over regions of it) or having more particles per cell. Higher-order shapes also help
sbastrakov
on 6 Nov 2020
So as a tl;dr of my last message. The output you posted is the "numerical" density on a really finely resolved grid and on such a small scale you really see the effects of random sampling of macroparticles. And I don't see anything wrong with it, since it's what the simulation actually operates with. These effects should be much less seen on a less resolved grid as they would be much more smoothed out.
sbastrakov
on 6 Nov 2020
Thanks, @sbastrakov for the clarification. So from the figure what I actually see is the density fluctuation, say electron density between 0.2-1.5e25. Taking a larger number of particles per cell can help in reducing the fluctuation. The following is the case for 4 macroparticles per cell:
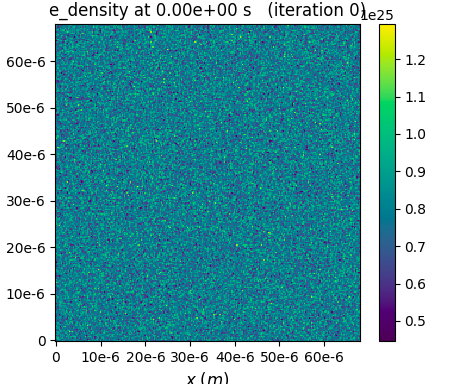
I guess for a gas target these fluctuations won't have much effect to the outcome.
StevE-Ong
on 6 Nov 2020
Yes. In other words, what you get from this type of output is the density of markers (macroparticles). Which approaches the real physical density as you increase the number of macroparticles per cell or shape order. However, it can be rather "jumpy" with few macroparticles per density data point. Which is what you setup does, however it should still be fine in terms of whether the PIC method is adequate; you just see the visual effect of sampling and grid discretization.
Or it would look smoother at a less refined detalization level (e.g. each density point not per cell, but per 4x4x4 cells), since then while you would get still the same number of markers per physical volume, you would get more per density data point and that would smooth the "jumps"
sbastrakov
on 6 Nov 2020
@StevE-Ong we have recently done a small study of how macroparticle sampling affects current values on the grid, which is of course a similar type of fluctuations as you observed. The results are reported in #3392
sbastrakov
on 6 Nov 2020
Related issues
 hightower8083
·
4Comments
hightower8083
·
4Comments
 HighIander
·
4Comments
HighIander
·
4Comments
 ax3l
·
4Comments
ax3l
·
4Comments
sbastrakov
·
3Comments
ax3l
·
4Comments
ax3l
·
4Comments
sbastrakov
·
3Comments
Most helpful comment
So initially we generate macroparticles according to the user-given density, in your case uniform. We (and other PIC codes as well as far as I know) do not actually sample the given density fully randomly on the whole simulation area, as this would be problematic computationally. Instead, we do it on a cell basis: evaluate the density functor for each cell, from there get the expected number of physical particles for this cell, then take into account user-requested particles per cell (in your case 2) and
MIN_WEIGHTINGand finally get the number of macroparticles for this cell. This many macroparticles are created and Initial positions are selected according to the second parameter ofCreateDensity, in your case randomly inside the cell.So if you integrate over a reasonably large volume, by counting the number of physical particles (as number of macroparticles times weighting, as your weighting is constant in this case) and divide by the volume it should give a number that's very close to your expected density.
However, this density output you've got is not computed like that. Instead, it is based on actual data of macroparticles in simulation and computed with the same resolution as grid for fields. Since you only have 2 macroparticles per cell, distributed randomly inside, naturally it can be that a certain grid node would have macroparticles spawned near it from many of the adjacent cells. And so this value of density would be larger than average. And some nodes would have particles father than average and so smaller than average density. These fluctuations in the output density should decrease with taking a larger volume (so even from this output if you average over regions of it) or having more particles per cell. Higher-order shapes also help