Pfelk: Security Network (enhancing the built-in SIEM)
Running current version from the repository and noticed that when you look in Security => Network the events are being populated as "Network Events" and only Flows are populated. Is there any plan to tweak the squid, unbound, nginx (reverse proxy) parsing so DNS/, HTTP, and TLS populate from the data being fed from opnsense/pfsense. This will further enhance the capability when there is more than just firewall data flowing into the elastic stack.
- [x] Unbound
- [x] Squid
- [x] Suricata
- [x] Snort
@a3ilson and contributors. Keep up the good work.
 rrosson
All 49 comments
@rrosson - Thanks!
Enriching the data to be usable within the security module is and has been an objective/goal. I'll leave this issue open and will make some progress in the next 2-3 months,
 a3ilson
on 29 Oct 2020
a3ilson
on 29 Oct 2020
DNS with unbound does not appear to be possible via the built-in SIEM
- The Elastic SIEM requires both the
dns.question.nameanddns.quesiton.registered_domainfields - Unbound only provides the
dns.question.namefield/data
Best solution
- Installing packetbeat on a system with access to a span or network tap which will populate the DNS, HTTP and TLS fields of the built-in SIEM
- This could be installed along side pfELK but would require another interface for mirrored/tapped traffic
I'll add a quick guide/tutorial in the wiki but it`ll likely be while before I get around to it.
Reference:
https://www.elastic.co/guide/en/beats/packetbeat/current/packetbeat-installation-configuration.html
https://www.elastic.co/guide/en/siem/guide/current/siem-field-reference.html
https://www.pluralsight.com/guides/setup-dns-traffic-event-monitoring-elasticsearch-siem
a3ilson
on 10 Nov 2020
@rrosson - Here's what I have so far (Suricata only)...will post to the repo later but feel free to implement...provide feedback and revise as needed. This will work with the built-in SIEM and I'll post customized dashboards later.
Add these to your /etc/logstash/conf.d/
- suricata.zip
- You'll need to rename the following:
- 45-cleanup.conf to 95-cleanup.conf
- 50-outputs.conf to 99-outputs.conf
Add these to your /etc/logstash/conf.d/ruby/
Add these to your /etc/logstash/conf.d/databases/
a3ilson
on 3 Jan 2021
Thank you for the work. Both personal and work life has taken up a lot of my time. I will try to take a look at this this weekend.
Do you have a roadmap of the other opnsense/pfsens logs too get them all to ECS format? Just curious?
rrosson
on 4 Jan 2021
@rrosson - Unfortunately, I've had a bit of free time during the past few weeks as I seek to secure a job and have spent a bit of time on this project. Hopefully and despite the busyness of life, you are doing well.
The lasted breaking update leveraged ECS compliance (10-December). The ECS template for pfELK was derived from the elastic repository utilizing v2.0.0-dev here. Next, all fields were amended to leverage the corresponding ECS fields. That effort utilized the ECS Field Reference. However, firewall logs are not explicitly described (from what I found) and as such I nested all pf specific logs under the pf object. Additionally, here are some notes from the latest change and as follows:
- The Suricata ECS compliant scheme was leveraged from here and tailored it to pfelk within this thread and also the experimental folder.
- I've been running this since yesterday and appears to enrich and align Suricata with ECS which also works nicely with the built-in SIEM plugin
- pfelk Suricata Enhancement Project
- I plan to do the same with Snort but do not run this natively...hoping for a collaborative effort
- pfelk Snort Enhancement Project
- HAProxy has a few fields that need to be amended. Next, those need to be enriched but I do not utilize this either
- pfelk HAProxy ECS Project
- Squid is already ECS 1.0.0 compliant but according to OPNsense's roadmap, the 21.1 update will be included in the next release/update
- pfelk Squid ECS (Json) Project
- Unbound is ECS...and those fields were aligned based on the ECS Field Reference
- The built-in SIEM contradicts the alignment of Unbound...
- I created this project to amend, if needed, these changes
Let me know if that covers ECS and/or if anything was overlooked.
a3ilson
on 4 Jan 2021
@rrosson - A few updates...
-Unbound and Squid logs will now parse out correctly for the built-in SIEM plus a number of others (specifically all pfelk instances are captured)
- Suricata (experimental) also works with the built-in SIEM but not posted to the main repo until I've tested it in-depth as it requires a number of added conf files
a3ilson
on 12 Jan 2021
I was able to take the time too spin this up with all your changes that you had outlined but it looks like Logstash hangs when it hits Logstash.filters.geoip. :(. No errors, it just sits there. Below is the last few lines of the logs:
[2021-01-12T22:41:42,434][INFO ][logstash.outputs.elasticsearch][main] ES Output version determined {:es_version=>7}
[2021-01-12T22:41:42,438][WARN ][logstash.outputs.elasticsearch][main] Detected a 6.x and above cluster: the `type` event field won't be used to determine the document _type {:es_version=>7}
[2021-01-12T22:41:42,483][INFO ][logstash.outputs.elasticsearch][main] New Elasticsearch output {:class=>"LogStash::Outputs::ElasticSearch", :hosts=>["https://127.0.0.1:9200"]}
[2021-01-12T22:41:43,009][INFO ][logstash.filters.geoip   ][main] Using geoip database {:path=>"/usr/share/logstash/vendor/bundle/jruby/2.5.0/gems/logstash-filter-geoip-6.0.3-java/vendor/GeoLite2-City.mmdb"}
[2021-01-12T22:41:43,328][INFO ][logstash.filters.geoip   ][main] Using geoip database {:path=>"/usr/share/logstash/vendor/bundle/jruby/2.5.0/gems/logstash-filter-geoip-6.0.3-java/vendor/GeoLite2-City.mmdb"}
[2021-01-12T22:41:43,332][INFO ][logstash.filters.geoip   ][main] Using geoip database {:path=>"/usr/share/GeoIP/GeoLite2-ASN.mmdb"}
The VM is configure with 8GB of memory and 8 vCPU.
TIA
-Ron
rrosson
on 12 Jan 2021
When did you spin this instance up? I did a bit of work on it today and made a number of changes here which is what I am currently running as I review logs and make final tweaks.
The previous geoip file had an 8GB cache set (four instances) which I committed out on the latest and defaulted to the built-in geoip vs MaxMind. However, based on your provide log, it appears it is utilizing the built-in GeoIP & MaxMind (located at /usr/share/GeoIP) <-- do you have MaxMind installed? This may be the problem but if not check out the updates located here
- ☑️ Install a regular instance of pfelk
- ☑️ Download the experimental files
- This will overwrite (original pfelk files) the following with these:
- 05-apps.conf
- 30-geoip.conf
- This will remove the following from pfelk:
- 36-ports-desc.conf <-- replaced by 36-enhanced_portnames.conf
- This will add the following to pfelk (/etc/logstash/conf.d/)
- 06-enhanced_suricata.conf - SURICATA
- 07-enhanced_snort.conf - SNORT
- 25-intrusion_severity.conf - SURICATA
- 31-geoip_extended.conf
- 33-enhanced_dns.conf
- 39-suricata_enrich_dns.conf
- 40-cleanup_suricata.conf - SURICATA
- These are required dependencies
- Location: /etc/logstash/conf.d/ruby/
- Location: /etc/logstash/conf.d/databases/
- snort_cve.yml - SNORT
- iana_icmp_code.yml
- iana_icmp_type.yml
- iana_icmpv6_code.yml
- iana_icmpv6_type.yml
- iana_service_names_dccp.yml
- iana_service_names_sctp.yml
- iana_service_names_tcp.yml
- iana_service_names_udp.yml
- ip_rep_basic.yml.zip <-- you'll need to unzip this...compressed as it exceeds GitHub's size limitation
If you've completed the above, if not already accomplished, please provide the log file which is located (by default) --> /var/log/logstash/logstash-plain.log and I'll help.
I did a clean install this morning and revised a number of files for further testing...overall, everything is working great but I had a couple of minor issues (nothing that breaks or stops logstash...just invalid fields I'm working to fix [one specific issue]).
a3ilson
on 13 Jan 2021
Here's a quick overview of the built-in SIEM with the latest changes:
a3ilson
on 13 Jan 2021
Just finished a complete wipe and rebuild with the current code base using the installer on an ubuntu 20 LTS. The installer script worked without issue. Still need to tackle enabling security so I can take advantage of the SIEM portion. Was wondering if you had any thoughts as adding the "enabling of security" at the end of your script?
Hopefully this weekend I can get some FaceTime with my computer to get security enabled.
Keep up the good work!
rrosson
on 15 Jan 2021
I've utilized X-PACK, in the past, by manually configuring and could certainly add/or incorporate into the script. The only hiccup may be setting the security solution within the settings (hopefully that's possible via the API).
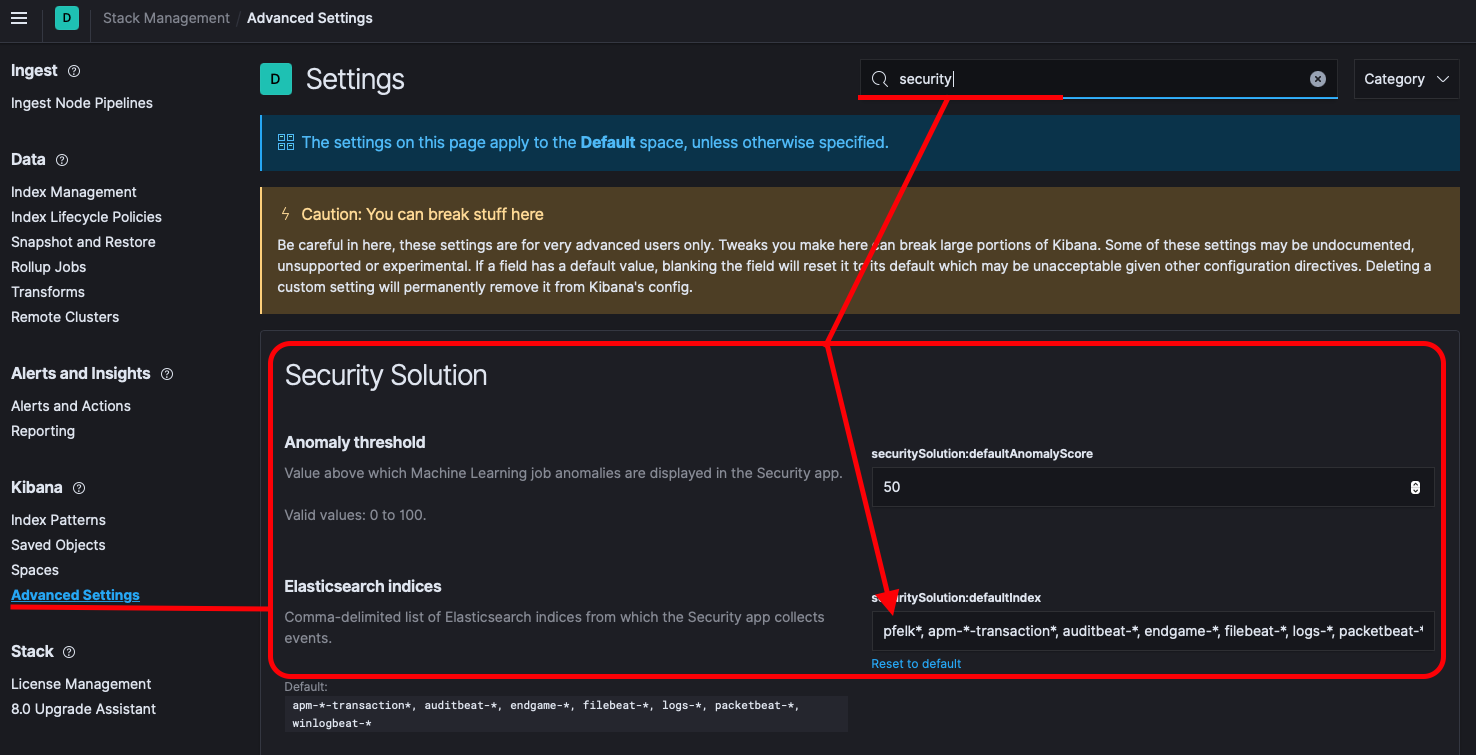
Anyway, once you have everything up and running current and/or experimental - you'll need to navigate to Stack Management>>Kibana>>Advanced Settings: then add pfelk* to the Elasticsearch indices under the security solution. This will allow you to use most of the SIEM without X-PACK being installed (however, you'll received warnings to install X-PACK).
a3ilson
on 15 Jan 2021
HELP/TESTING WANTED
Seeking additional testing, specifically with SNORT. Please note that the current dashboards will not work but will update after testing validation:
For snort, please update the grok filter within the pfelk.grok pattern file to the following:
SNORT \[%{INT:[rule][uuid]}\:%{INT:[rule][reference]}\:%{INT:[rule][version]}\].%{GREEDYDATA:[vulnerability][description]}.\[Classification\: %{DATA:[vulnerability][classification]}\].\[Priority\: %{INT:[event][severity]}\].\{%{DATA:[network][transport]}\}.%{IP:[source][ip]}(\:%{INT:[source][port]})?.->.%{IP:[destination][ip]}(\:%{INT:[destination][port]})?
- ☑️ Install a regular instance of pfelk
- ☑️ Download the experimental files
- This will overwrite (original pfelk files) the following with these:
- 05-apps.conf
- 30-geoip.conf
- This will remove the following from pfelk:
- 36-ports-desc.conf <-- replaced by 36-enhanced_portnames.conf
- This will add the following to pfelk (/etc/logstash/conf.d/)
- 06-enhanced_suricata.conf - SURICATA
- 07-enhanced_snort.conf - SNORT
- 25-intrusion_severity.conf - SURICATA
- 31-geoip_extended.conf
- 33-enhanced_dns.conf
- 39-suricata_enrich_dns.conf
- 40-cleanup_suricata.conf - SURICATA
- These are required dependencies
- Location: /etc/logstash/conf.d/ruby/
- Location: /etc/logstash/conf.d/databases/
- snort_cve.yml - SNORT
- iana_icmp_code.yml
- iana_icmp_type.yml
- iana_icmpv6_code.yml
- iana_icmpv6_type.yml
- iana_service_names_dccp.yml
- iana_service_names_sctp.yml
- iana_service_names_tcp.yml
- iana_service_names_udp.yml
- ip_rep_basic.yml.zip <-- you'll need to unzip this...compressed as it exceeds GitHub's size limitation
a3ilson
on 25 Jan 2021
ok, just finished grabbing all this stuff, and restarted logstash to see what would happen... just for sanity sake, i recommend other testsers grab the last zipped yml file with wget, then use unzip to inflate it directly on the machine. Trying to copy and past 1.25 million lines of text crashes putty lol
 revere521
on 25 Jan 2021
revere521
on 25 Jan 2021
I just got a Pipeline error {:pipeline_id=>"main", :exception=>#<Grok::PatternError: pattern %{SQUID} not defined>,
so i need to make sure the rest of my stuff is up to date, and then enable x-pack
revere521
on 25 Jan 2021
i'm currently receiving this error:
[ERROR][logstash.agent ] Failed to execute action {:action=>LogStash::PipelineAction::Create/pipeline_id:main, :exception=>"Java::JavaLang::IllegalStateException", :message=>"Unable to configure plugins: (ConfigurationError) Something is wrong with your configuration.", :backtrace=>["org.logstash.config.ir.CompiledPipeline.<init>(CompiledPipeline.java:119)", "org.logstash.execution.JavaBasePipelineExt.initialize(JavaBasePipelineExt.java:83)", "org.logstash.execution.JavaBasePipelineExt$INVOKER$i$1$0$initialize.call(JavaBasePipelineExt$INVOKER$i$1$0$initialize.gen)", "org.jruby.internal.runtime.methods.JavaMethod$JavaMethodN.call(JavaMethod.java:837)", "org.jruby.ir.runtime.IRRuntimeHelpers.instanceSuper(IRRuntimeHelpers.java:1169)", "org.jruby.ir.runtime.IRRuntimeHelpers.instanceSuperSplatArgs(IRRuntimeHelpers.java:1156)", "org.jruby.ir.targets.InstanceSuperInvokeSite.invoke(InstanceSuperInvokeSite.java:39)", "usr.share.logstash.logstash_minus_core.lib.logstash.java_pipeline.RUBY$method$initialize$0(/usr/share/logstash/logstash-core/lib/logstash/java_pipeline.rb:47)", "org.jruby.internal.runtime.methods.CompiledIRMethod.call(CompiledIRMethod.java:80)", "org.jruby.internal.runtime.methods.MixedModeIRMethod.call(MixedModeIRMethod.java:70)", "org.jruby.runtime.callsite.CachingCallSite.cacheAndCall(CachingCallSite.java:332)", "org.jruby.runtime.callsite.CachingCallSite.call(CachingCallSite.java:86)", "org.jruby.RubyClass.newInstance(RubyClass.java:939)", "org.jruby.RubyClass$INVOKER$i$newInstance.call(RubyClass$INVOKER$i$newInstance.gen)", "org.jruby.ir.targets.InvokeSite.invoke(InvokeSite.java:207)", "usr.share.logstash.logstash_minus_core.lib.logstash.pipeline_action.create.RUBY$method$execute$0(/usr/share/logstash/logstash-core/lib/logstash/pipeline_action/create.rb:52)", "usr.share.logstash.logstash_minus_core.lib.logstash.pipeline_action.create.RUBY$method$execute$0$__VARARGS__(/usr/share/logstash/logstash-core/lib/logstash/pipeline_action/create.rb)", "org.jruby.internal.runtime.methods.CompiledIRMethod.call(CompiledIRMethod.java:80)", "org.jruby.internal.runtime.methods.MixedModeIRMethod.call(MixedModeIRMethod.java:70)", "org.jruby.ir.targets.InvokeSite.invoke(InvokeSite.java:207)", "usr.share.logstash.logstash_minus_core.lib.logstash.agent.RUBY$block$converge_state$2(/usr/share/logstash/logstash-core/lib/logstash/agent.rb:365)", "org.jruby.runtime.CompiledIRBlockBody.callDirect(CompiledIRBlockBody.java:138)", "org.jruby.runtime.IRBlockBody.call(IRBlockBody.java:58)", "org.jruby.runtime.IRBlockBody.call(IRBlockBody.java:52)", "org.jruby.runtime.Block.call(Block.java:139)", "org.jruby.RubyProc.call(RubyProc.java:318)", "org.jruby.internal.runtime.RubyRunnable.run(RubyRunnable.java:105)", "java.base/java.lang.Thread.run(Thread.java:834)"]}
@revere521 - The squid issue was previously corrected (amended 05-apps.conf). After you updated your files, are you still having the squid issue?
//break//
I am running with the current files from this repo plus those in the experimental folder... can you confirm your file structure:
01-inputs.conf             20-interfaces.conf          36-enhanced_resolve_portnames.conf  49-enhanced_private.conf
02-types.conf              25-intrusion_severity.conf  37-enhanced_user_agent.conf         50-outputs.conf
03-filter.conf             30-geoip.conf               38-enhanced_url.conf                databases
05-apps.conf               31-geoip_extended.conf      39-enhanced_suricata_final.conf     patterns
06-enhanced_suricata.conf  33-enhanced_dns.conf        40-cleanup_suricata.conf            ruby
07-enhanced_snort.conf     35-rules-desc.conf          45-cleanup.conf

./databases:
iana_icmp_code.yml    iana_icmpv6_type.yml         iana_service_names_tcp.yml  ip_rep_whitelist.yml   snort_cve.yml
iana_icmp_type.yml    iana_service_names_dccp.yml  iana_service_names_udp.yml  private-hostnames.csv  suricata_cve.yml
iana_icmpv6_code.yml  iana_service_names_sctp.yml  ip_rep_basic.yml            rule-names.csv

./patterns:
pfelk.grok

./ruby:
logstash-ruby-filter-community-id.rb  logstash-ruby-filter-dns-related.rb
Above is my current file structure (ls -R)
a3ilson
on 25 Jan 2021
ok, i've run through everything - and i think i am all set with the correct files - here is the entirety of the error (it mentions suricata_cve,yml - which may be a typo somewhere)
Jan 25 15:36:22 ubuntuserver1 logstash[28758]: [2021-01-25T15:36:22,862][INFO ][logstash.runner          ] Starting Logstash {"logstash.version"=>"7.10.2", "jruby.version"=>"jruby 9.2.13.0 (2.5.7) 2020-08-03 9a89c94bcc OpenJDK 64-Bit Server VM 11.0.8+10 on 11.0.8+10 +indy +jit [linux-x86_64]"}
Jan 25 15:36:30 ubuntuserver1 logstash[28758]: [2021-01-25T15:36:30,068][INFO ][org.reflections.Reflections] Reflections took 27 ms to scan 1 urls, producing 23 keys and 47 values
Jan 25 15:36:31 ubuntuserver1 logstash[28758]: [2021-01-25T15:36:31,135][ERROR][logstash.filters.translate] Invalid setting for translate filter plugin:
Jan 25 15:36:31 ubuntuserver1 logstash[28758]:   filter {
Jan 25 15:36:31 ubuntuserver1 logstash[28758]:     translate {
Jan 25 15:36:31 ubuntuserver1 logstash[28758]:       # This setting must be a path
Jan 25 15:36:31 ubuntuserver1 logstash[28758]:       # File does not exist or cannot be opened /etc/logstash/conf.d/databases/suricata_cve.yml
Jan 25 15:36:31 ubuntuserver1 logstash[28758]:       dictionary_path => "/etc/logstash/conf.d/databases/suricata_cve.yml"
Jan 25 15:36:31 ubuntuserver1 logstash[28758]:       ...
Jan 25 15:36:31 ubuntuserver1 logstash[28758]:     }
Jan 25 15:36:31 ubuntuserver1 logstash[28758]:   }
Jan 25 15:36:31 ubuntuserver1 logstash[28758]: [2021-01-25T15:36:31,143][ERROR][logstash.agent           ] Failed to execute action {:action=>LogStash::PipelineAction::Create/pipeline_id:main, :exception=>"Java::JavaLang::IllegalStateException", :message=>"Unable to configure plugins: (ConfigurationError) Something is wrong with your configuration.", :backtrace=>["org.logstash.config.ir.CompiledPipeline.<init>(CompiledPipeline.java:119)", "org.logstash.execution.JavaBasePipelineExt.initialize(JavaBasePipelineExt.java:83)", "org.logstash.execution.JavaBasePipelineExt$INVOKER$i$1$0$initialize.call(JavaBasePipelineExt$INVOKER$i$1$0$initialize.gen)", "org.jruby.internal.runtime.methods.JavaMethod$JavaMethodN.call(JavaMethod.java:837)", "org.jruby.ir.runtime.IRRuntimeHelpers.instanceSuper(IRRuntimeHelpers.java:1169)", "org.jruby.ir.runtime.IRRuntimeHelpers.instanceSuperSplatArgs(IRRuntimeHelpers.java:1156)", "org.jruby.ir.targets.InstanceSuperInvokeSite.invoke(InstanceSuperInvokeSite.java:39)", "usr.share.logstash.logstash_minus_core.lib.logstash.java_pipeline.RUBY$method$initialize$0(/usr/share/logstash/logstash-core/lib/logstash/java_pipeline.rb:47)", "org.jruby.internal.runtime.methods.CompiledIRMethod.call(CompiledIRMethod.java:80)", "org.jruby.internal.runtime.methods.MixedModeIRMethod.call(MixedModeIRMethod.java:70)", "org.jruby.runtime.callsite.CachingCallSite.cacheAndCall(CachingCallSite.java:332)", "org.jruby.runtime.callsite.CachingCallSite.call(CachingCallSite.java:86)", "org.jruby.RubyClass.newInstance(RubyClass.java:939)", "org.jruby.RubyClass$INVOKER$i$newInstance.call(RubyClass$INVOKER$i$newInstance.gen)", "org.jruby.ir.targets.InvokeSite.invoke(InvokeSite.java:207)", "usr.share.logstash.logstash_minus_core.lib.logstash.pipeline_action.create.RUBY$method$execute$0(/usr/share/logstash/logstash-core/lib/logstash/pipeline_action/create.rb:52)", "usr.share.logstash.logstash_minus_core.lib.logstash.pipeline_action.create.RUBY$method$execute$0$__VARARGS__(/usr/share/logstash/logstash-core/lib/logstash/pipeline_action/create.rb)", "org.jruby.internal.runtime.methods.CompiledIRMethod.call(CompiledIRMethod.java:80)", "org.jruby.internal.runtime.methods.MixedModeIRMethod.call(MixedModeIRMethod.java:70)", "org.jruby.ir.targets.InvokeSite.invoke(InvokeSite.java:207)", "usr.share.logstash.logstash_minus_core.lib.logstash.agent.RUBY$block$converge_state$2(/usr/share/logstash/logstash-core/lib/logstash/agent.rb:365)", "org.jruby.runtime.CompiledIRBlockBody.callDirect(CompiledIRBlockBody.java:138)", "org.jruby.runtime.IRBlockBody.call(IRBlockBody.java:58)", "org.jruby.runtime.IRBlockBody.call(IRBlockBody.java:52)", "org.jruby.runtime.Block.call(Block.java:139)", "org.jruby.RubyProc.call(RubyProc.java:318)", "org.jruby.internal.runtime.RubyRunnable.run(RubyRunnable.java:105)", "java.base/java.lang.Thread.run(Thread.java:834)"]}
Jan 25 15:36:31 ubuntuserver1 logstash[28758]: warning: thread "Converge PipelineAction::Create<main>" terminated with exception (report_on_exception is true):
Jan 25 15:36:31 ubuntuserver1 logstash[28758]: LogStash::Error: Don't know how to handle `Java::JavaLang::IllegalStateException` for `PipelineAction::Create<main>`
Jan 25 15:36:31 ubuntuserver1 logstash[28758]:           create at org/logstash/execution/ConvergeResultExt.java:129
Jan 25 15:36:31 ubuntuserver1 logstash[28758]:              add at org/logstash/execution/ConvergeResultExt.java:57
Jan 25 15:36:31 ubuntuserver1 logstash[28758]:   converge_state at /usr/share/logstash/logstash-core/lib/logstash/agent.rb:378
Jan 25 15:36:31 ubuntuserver1 logstash[28758]: [2021-01-25T15:36:31,151][ERROR][logstash.agent           ] An exception happened when converging configuration {:exception=>LogStash::Error, :message=>"Don't know how to handle `Java::JavaLang::IllegalStateException` for `PipelineAction::Create<main>`"}
Jan 25 15:36:31 ubuntuserver1 logstash[28758]: [2021-01-25T15:36:31,199][FATAL][logstash.runner          ] An unexpected error occurred! {:error=>#<LogStash::Error: Don't know how to handle `Java::JavaLang::IllegalStateException` for `PipelineAction::Create<main>`>, :backtrace=>["org/logstash/execution/ConvergeResultExt.java:129:in `create'", "org/logstash/execution/ConvergeResultExt.java:57:in `add'", "/usr/share/logstash/logstash-core/lib/logstash/agent.rb:378:in `block in converge_state'"]}
Jan 25 15:36:31 ubuntuserver1 logstash[28758]: [2021-01-25T15:36:31,242][ERROR][org.logstash.Logstash    ] java.lang.IllegalStateException: Logstash stopped processing because of an error: (SystemExit) exit
Jan 25 15:36:31 ubuntuserver1 systemd[1]: logstash.service: Main process exited, code=exited, status=1/FAILURE
Jan 25 15:36:31 ubuntuserver1 systemd[1]: logstash.service: Failed with result 'exit-code'.
its referred to in 25-intrusion_severity.conf, but the file doesn't seem to exist in the repo - not sure why its being called though
revere521
on 25 Jan 2021
🤦
Dang...that's on me... I just uploaded that file, suricata_cve.yml
Hopefully, that was the only error
a3ilson
on 25 Jan 2021
no worries, its what testing is for
now its looking for ip_rep_whitelist.yml:
[2021-01-25T16:00:42,461][ERROR][logstash.filters.translate] Invalid setting for translate filter plugin:
Jan 25 16:00:42 ubuntuserver1 logstash[33148]:   filter {
Jan 25 16:00:42 ubuntuserver1 logstash[33148]:     translate {
Jan 25 16:00:42 ubuntuserver1 logstash[33148]:       # This setting must be a path
Jan 25 16:00:42 ubuntuserver1 logstash[33148]:       # File does not exist or cannot be opened /etc/logstash/conf.d/databases/ip_rep_whitelist.yml
Jan 25 16:00:42 ubuntuserver1 logstash[33148]:       dictionary_path => "/etc/logstash/conf.d/databases/ip_rep_whitelist.yml"
Jan 25 16:00:42 ubuntuserver1 logstash[33148]:       ...
Jan 25 16:00:42 ubuntuserver1 logstash[33148]:     }
Jan 25 16:00:42 ubuntuserver1 logstash[33148]:   }
maybe an old reference to ip_rep_basic?
revere521
on 25 Jan 2021
Sorry...added that file too and double checked the rest.
a3ilson
on 25 Jan 2021
no worries, i think i sorted all those out now - and now i need to figure out configuring xpack. I enabled the xpack security line in elasticsearch.yml, but i'm not certain if i need to do more
Can you run xpack security with a basic license, without setting up a trial/subscription? since I'm only monitoring my home-lab, I'd rather not setup a subscription
revere521
on 26 Jan 2021
X-Pack is recommended but I too opt for the free/opensource path. I currently do not have it enabled and am able to access SIEM but I receive errors (little messages in the lower right that can be ignored and/or closed).
Let me enabled X-Pack and see if it'll allow for basic vs trial=>basic (after 30days).
a3ilson
on 26 Jan 2021
I just disabled the xpack security line, as i'd rather worry about fewer variables. once i did logstash started and kibana came up, etc. I'm going to let it collect some data and then check what I get
I should see things unde the security heading in this case? it looks like the SIEM heading is gone
revere521
on 26 Jan 2021
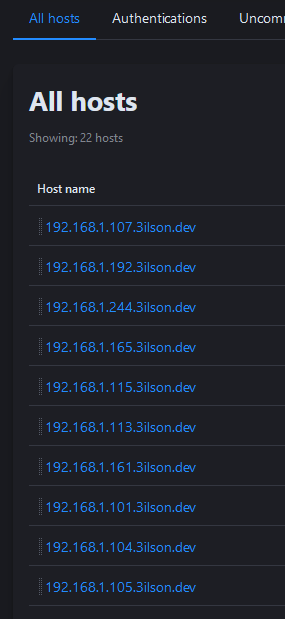
ok, i'm starting to see some data fill in, is there a setting somewhere that hard-codes your domain to DHCP addresses?
revere521
on 26 Jan 2021
yes.
This was added in the 49-enhanced_private.conf file.
This adds the domain name and geo data for your private IP addresses/hosts and contains two parts
- 1 Lines 10-26 performs a dictionary lookup and adds a hostname
- If there are no matching values it defaults to the IP address
- Amend
/etc/logstash/conf.d/databases/private-hostnames.csvto enrich with hostnames
- 2 Lines 27-44 adds custom geoip if "Private_Client_IP" is in [tags]
- Amend as desired to enrich private GeoIP
This file is optional and may be removed if not needed or desired. I have not added it to the script or manual instructions but may as an option with referenced instructions posting in the Wiki.
- Amend as desired to enrich private GeoIP
Let me know your thoughts
a3ilson
on 26 Jan 2021
Alright...give the following a try to get SIEM accessible:
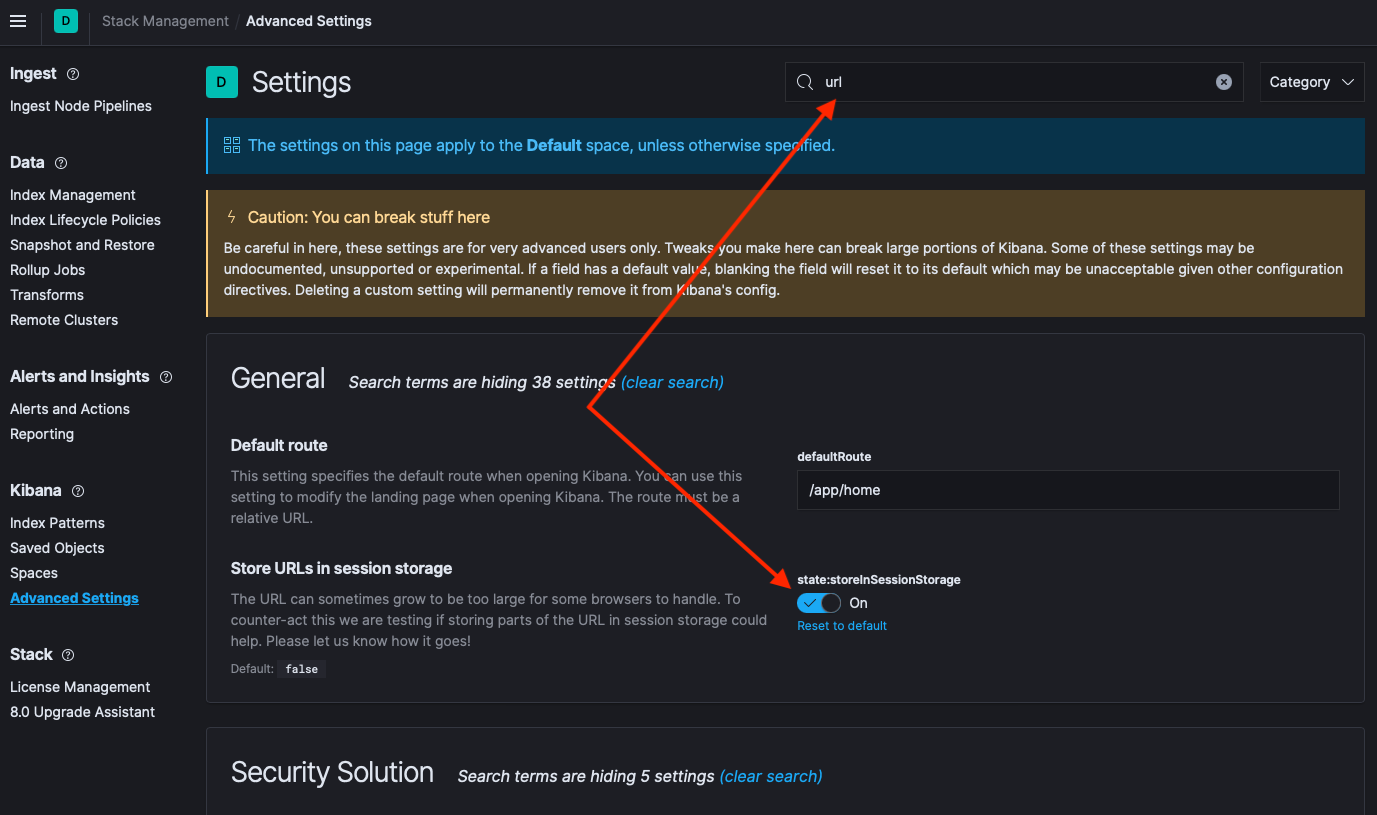
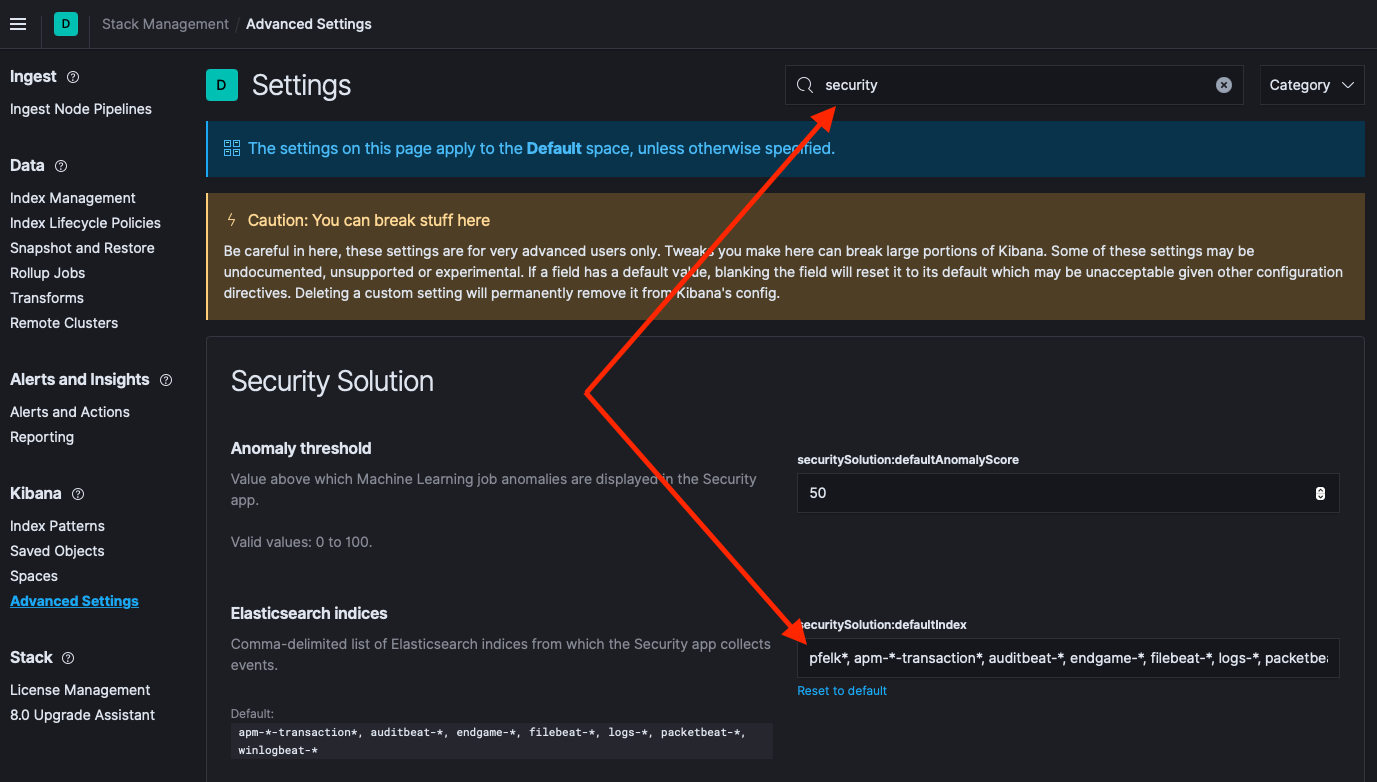
Navigate to Stack Management(under management)>>Advanced Settings(under Kibana)
type
urlin the search and enable "Store URLs in session storage"
type
securityin the search and addpfelk-*as a Elasticsearch indices
a3ilson
on 26 Jan 2021
I like the 49-enhanced_private.conf settings, i think it will add value for both identifying devices on the network - and for setting the home location. The other settings I have set as you show in the advanced settings - is guess they just renamed the "SIEM" heading in Kibana to just "Security"
I will let the system collect data for a few more hours and see what i get. I do see that I can probably keep the Snort dashboard alongside this, but i will need to update the visualizations to account for the new "vulnerability" field names
revere521
on 26 Jan 2021
You can amend /etc/logstash/conf.d/databases/private-hostnames.csv without restarting logstash and works if you have static IP addresses but DHCP renders it useless.
The SIEM within Kibana is okay but works better when other elements are feeding it (e.g. Filebeats, Packet Beats, Wazuh etc..). A nice expansion option for those looking to leverage and aggregate logging.
a3ilson
on 26 Jan 2021
X-Pack - I do not plan on added this to pfelk as I foresee issues related to setting it up but with elasticstack it is capable for those interested.
a3ilson
on 26 Jan 2021
I am struggling with setting all the auth, and i can see that as an issue for folks like me (with no central LDAM or Active Directory to leverage)
So i am going to shut it back off.
Should I expect to see something under security being collected? or does this do something else?
revere521
on 26 Jan 2021
This is what mine looks like:
I prefer the current dashboards but do see the utility for those looking to leverage the built-in SIEM. I believe the latest snort update (grok pattern and extra file) will suffice in populating the built-in SIEM and will include that in the main repo once you've had a chance to update the dashboard.
My thoughts were to enable a capability but not looking to move in that direction. The basic install will be supported but the additional files within the experimental folder will be there for others to dabble with along with those looking to utilize the built-in SIEM. The updates conform to ECS and with ECS related data the built-in SIEM will work (depending on the datasets being observed).
Thanks for testing and I'll close these two issues, once snort is updated as they support the built-in SIEM but to take full advantage, additional datasets are required.
a3ilson
on 26 Jan 2021
ok, sure thing - should I revert to the standard install then? I'm not getting any events under detections - but it may not have been long enough yet.
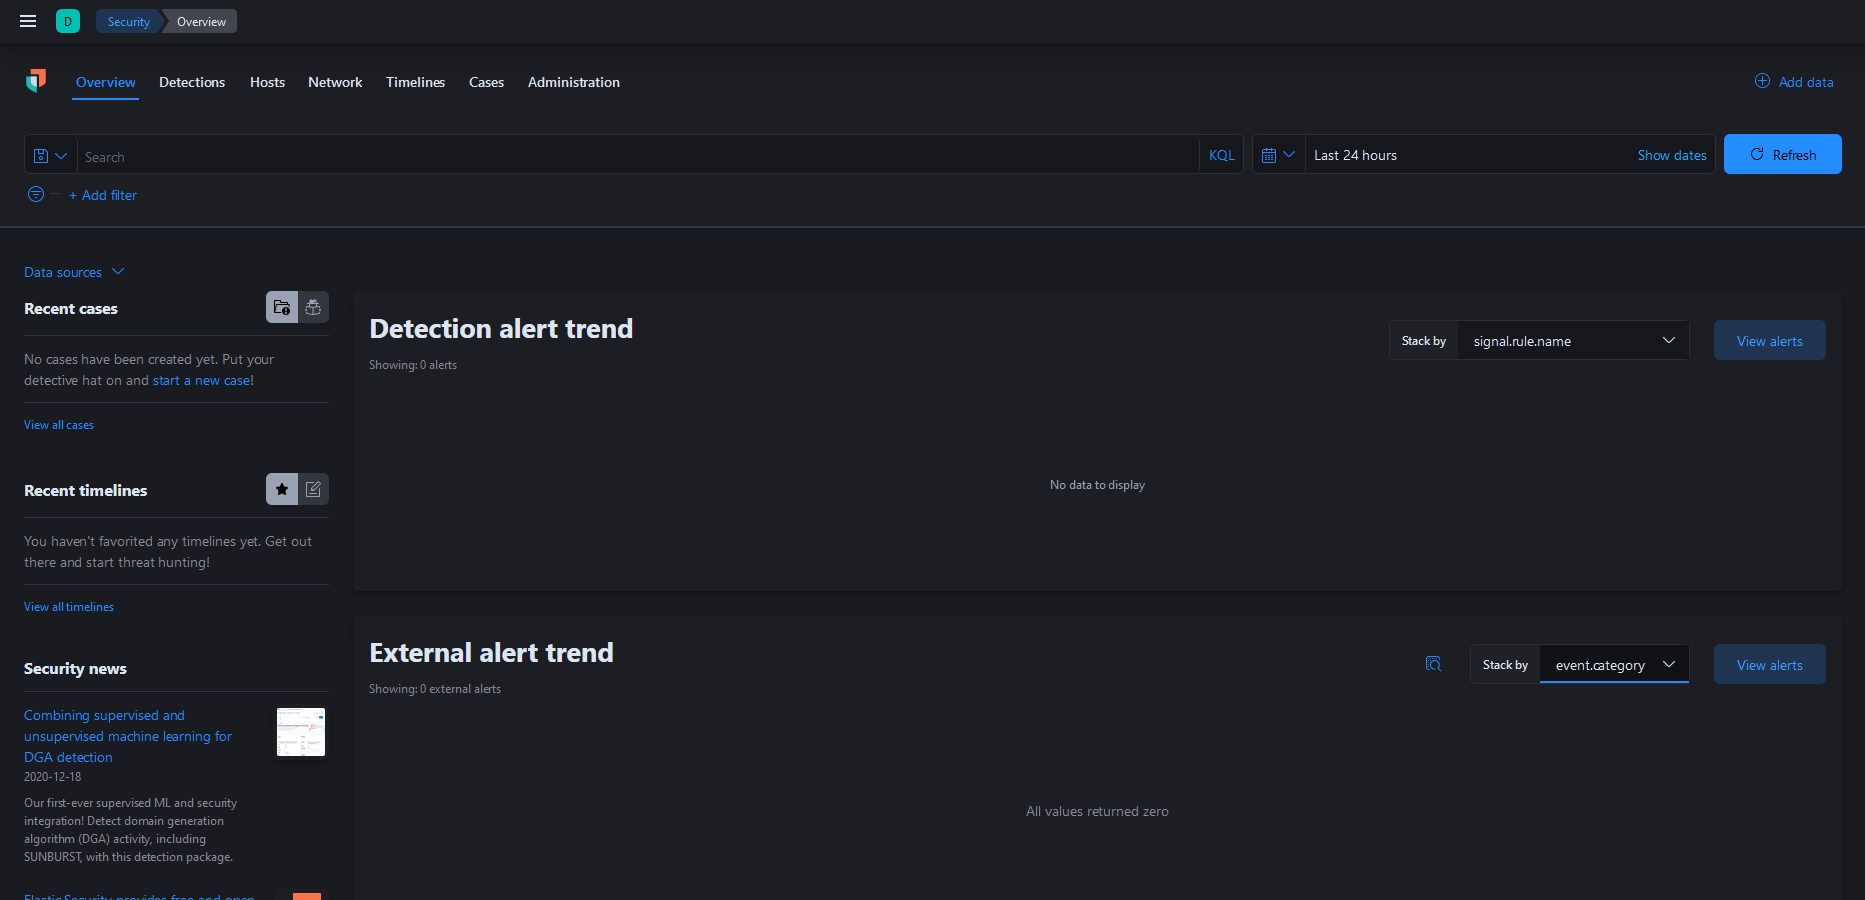
revere521
on 26 Jan 2021
You won't get anything under detection alert trend as that element requires X-Pack and Machine Learning configured for the index.
However, you should see data under the next two.
- Detection alert trend should illustrate snort/suricata events
- Events should illustrate all pfelk logged events
- did you add
pfelk-*in the security solution?
- did you add
a3ilson
on 26 Jan 2021
i did, I added it as "pfelk*" like in your screencap
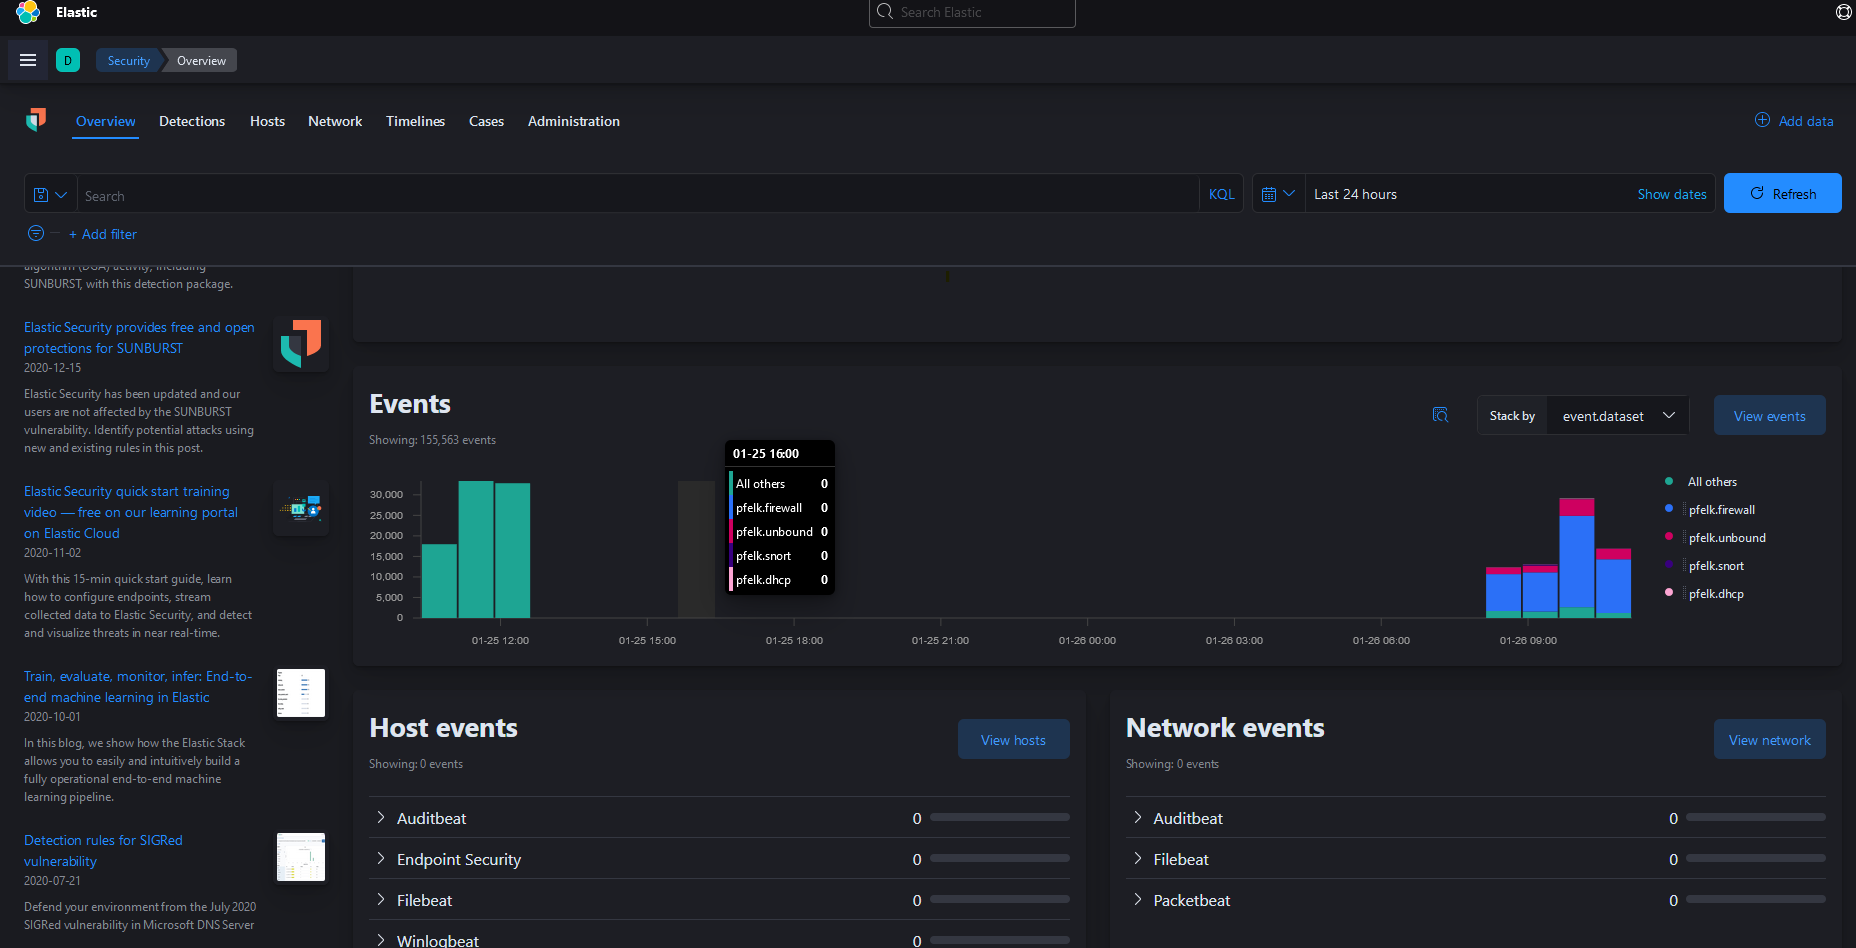
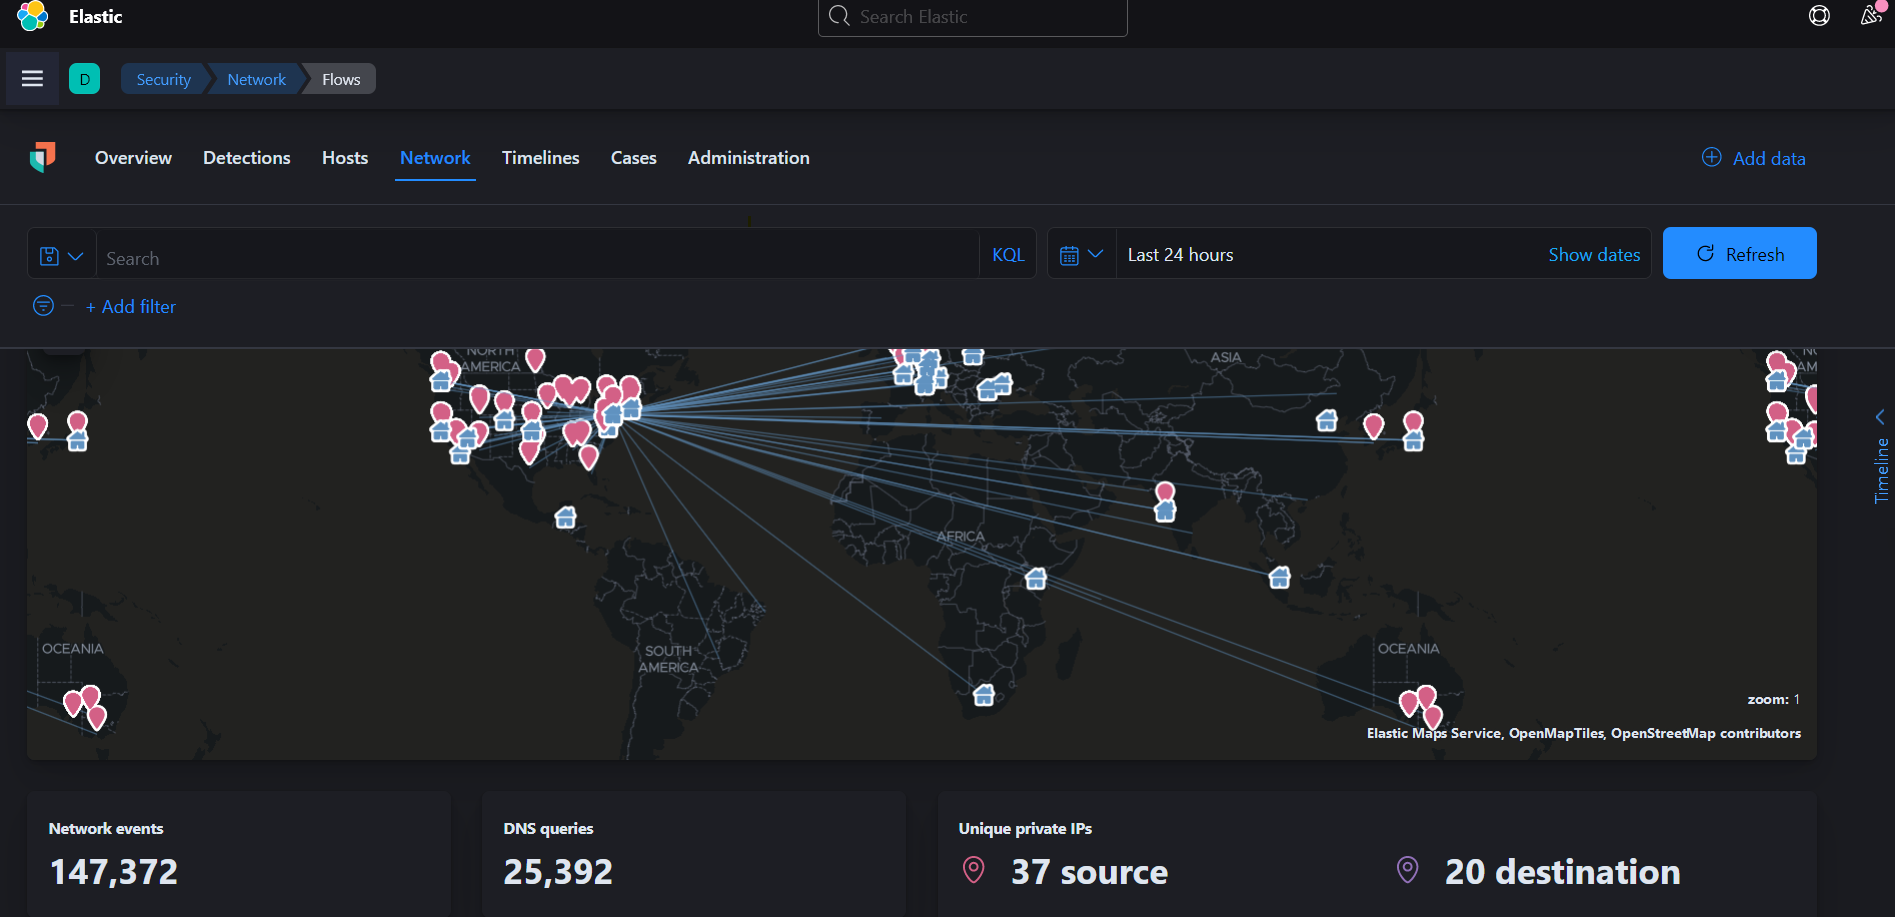
and i have some items collected under hosts and network as well, but the network map has an error that its not configured properly
revere521
on 26 Jan 2021
That looks consistent with mine... as for the map under network it populates the map based on the added index pattern (i.e. pfelk-* from the security solution).
Two ways to mitigating having to add this every time:
- 1 - create an index pattern names
pfelk-*
2 - added all (
pfelk-firewall-*, etc...) the indices into the security solution vspfelk-*3 - manually add but you have to do this with each session
a3ilson
on 26 Jan 2021
adding all the index patterns fixes it as noted..
revere521
on 26 Jan 2021
I'm going to leave it for today, then maybe go back tomorrow. I may just need to blow out all the configs and just build the current stable from scratch again anyway
revere521
on 26 Jan 2021
Sounds good and thank you!
This Wiki Page that outlines the steps to get the SIEM working
This Wiki Page has the basics for getting X-Pack configured
I'll add another page for the 49-enhanced_private.conf file
Not sure which installation method you plan to utilize but would be curious on your thoughts regarding the optional files? I was thinking of placing them in a separate folder with separate instructions thus delineating the basic/core installation from the various additions which may or may not be supported in the future - thoughts?
After your fresh installation and evaluation of the built-in SIEM, I'll close this issue pending any major issues you encounter. I believe these revisions will suffice SIEM support and leveraging the full capability of the built-in SIEM is out of scope for this project - thoughts?
a3ilson
on 26 Jan 2021
The only thing i can imagine doing - if you want to keep the SIEM capability as optional - is to change the snort ashboard (and maybe the standard install) to use the new SIEM terms (vulnerability.classification, instead of just classification, etc.)
I can see the new field names:
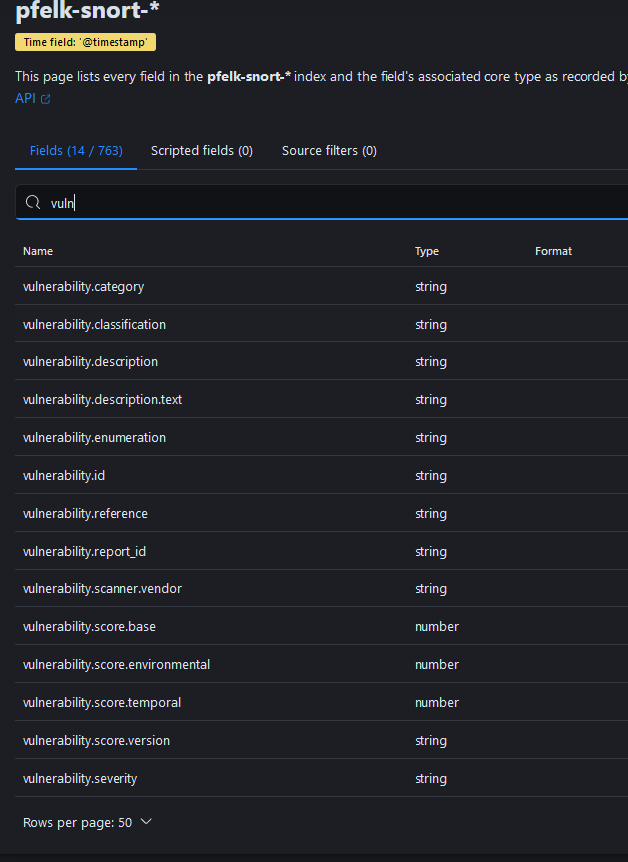
Which if they were called that across both the standard install and the optional install - means we could just leverage them for the custom dashboards which would work either way. Not sure if there is significant changes to make to the standard install to do that though.
Once you decide, I can see making the Experimental folder - into and "Advanced - Native SEIM" or "Advanced - Native ELK Security" folder, and calling it out separately in the instructions (which could become extensive)
revere521
on 26 Jan 2021
Absolutely! I plan to utilize the revised snort grok pattern and assume everything worked? I should have specified but will await the updated snort dashboard prior to updating. This will allow the standard dashboard but also allow those seeking to leverage SIEM the ability to do so with minimal revisions.
a3ilson
on 26 Jan 2021
Ok, sounds good - i'll see if i can get my visualizations and dashboard updated with the new terms, and post it here
revere521
on 26 Jan 2021
Great/thanks again - on another topic...are you running pfBlocker-NG? I think I have a solution to export and visualize those logs but never heard back from the originator (testing) of the proposed idea.
a3ilson
on 26 Jan 2021
i am, and it would require SyslogNG to export the logs, i believe
I use the DNSBL flavor, not IP / Firewall Rule blocking
revere521
on 26 Jan 2021
correct... syslogng would be required...I'll shelf this until 2.5.0 is released as it appears they made some improvements on the external logging.
a3ilson
on 26 Jan 2021
ive been watching redmine - https://redmine.pfsense.org/versions/33 - its gotta be close, a couple of months i would think
revere521
on 26 Jan 2021
This appears to be all working - visualizations for the v6.1 dashboard updated for new terms with SEIM, with all visualizations included, excluding related objects and the index pattern. Hopefully its all exported and set this time (for once)
revere521
on 27 Jan 2021
since all the dashboards are working along with what works in the SIEM, my drive to rebuild is low... maybe i'll do that over the weekend. I also have to move my openHAB onto a raspberry pi, so i may need to worry about that first.
revere521
on 27 Jan 2021
The following indices were updated and compliant with ECS 1.5+ allowing and enabling utilization of the built-in SIEM.
- Unbound
- Squid
- Suricata
- Snort
a3ilson
on 27 Jan 2021
Related issues
 fktkrt
·
5Comments
fktkrt
·
5Comments
 squirrelboot
·
12Comments
squirrelboot
·
12Comments
 myrsecurity
·
12Comments
myrsecurity
·
12Comments
 s7thamon
·
14Comments
s7thamon
·
14Comments
 ledge39
·
7Comments
ledge39
·
7Comments