Openfoodnetwork: Order Cycle Distributor Totals by Supplier results in Snail
Description
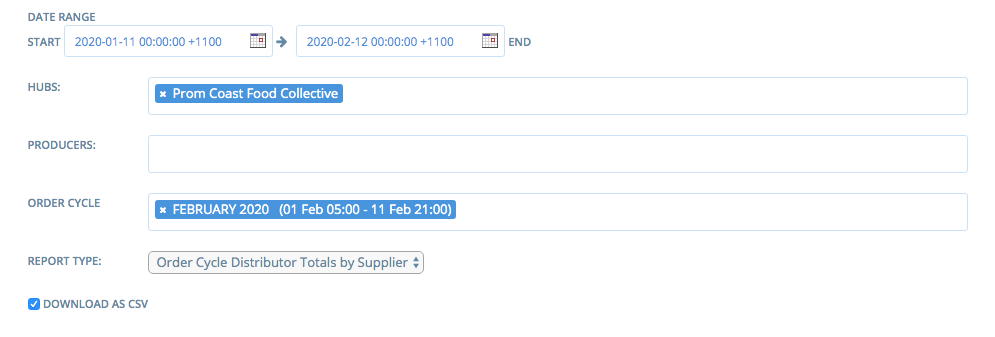
One Enterprise (Prom Coast Food Collective) on the Aus Instance has reported being unable to run the Order Cycle Distributor Totals by Supplier report. They have been trying repeatedly over 2 days and it has only successful run the report once.
Their Order Cycle finishes tonight at 9pm (11/02/2020) and they will need to run the report between 9pm - 10pm (Aus time)
Expected Behaviour
Report should run successfully
Actual Behaviour
Snail
Steps to Reproduce
I have successfully run the report as Superadmin, and as a Manager of the specific enterprise. I have been unable to reproduce the error.
Animated Gif/Screenshot
Workaround
The only workaround is that someone at OFN will need to run the report for them at 9pm tonight, as they can't run it themselves.
Severity
S2 - unless the above workaround is acceptable - then S3
bug-s1: a critical feature is broken: checkout, payments, signup, login
bug-s2: a non-critical feature is broken, no workaround
bug-s3: a feature is broken but there is a workaround
bug-s4: it's annoying, but you can use it
bug-s5: we can live with it, only a few users impacted
https://github.com/openfoodfoundation/openfoodnetwork/wiki/Bug-severity
 emilyjeanrogers
All 12 comments
I just ran the report as super-admin and it worked. But it took over 2 minutes and the process used a lot of memory, it's now at 60%. Our swap is exhausted. I restarted unicorn to free some memory but after running the report again, it used 58% of memory again. I think that means that it fails if another worker tries to run the same report because two processes can't use that much memory at the same time.
I will increase the swap size for now but I agree that this is S2 and we need to work on the performance of this report.
 mkllnk
on 11 Feb 2020
mkllnk
on 11 Feb 2020
I'm checking Wormly and I have a few doubts @mkllnk you might know the answer for
- Do we only have 2-day data retention? The RAM graph has only data until Feb 11th
- Do you know when the user check the report?
- When did we restart the unicorn?
 sauloperez
on 13 Feb 2020
sauloperez
on 13 Feb 2020
The data reporting had crashed a long time ago and I didn't monitor that. I restarted the reporting on that day when I investigated and observed the memory consumption of the unicorn worker manually.
I did add a dead-man-switch condition now so that we will get an alert if no data is flowing in. Still learning...
I'm not exactly sure but I think that the user runs the report once a month. You can check the order cycle dates to see their pattern.
I restarted unicorn several times. First I rand the report and observed a lot of memory consumption. I then restarted unicorn and ran the report again. As described above, it used almost as much memory again which was an indicator that the report used the memory, not another request served by the same worker. I also observed that the database is very busy for maybe a minute, then unicorn becomes busy for another minute. So I guess it's preloading lots of data and maybe more than we need?
mkllnk
on 13 Feb 2020
invaluable information @mkllnk thanks!
I also observed that the database is very busy for maybe a minute, then unicorn becomes busy for another minute. So I guess it's preloading lots of data and maybe more than we need?
It makes perfect sense to me. Here's my hypothesis: reports bombard the DB with endless N+1 and all that data is then transformed into fat ActiveRecord objects that take heaps of memory. That data is then processed through the report's procs that group and sort it. This, in turn, will instantiate even more objects into memory. Add just one week on the time-window and the cost likely increases exponentially.
All this puts a lot of pressure on the garbage collector, which can't handle it properly. That might be why only a restart fully cuts down the memory consumption.
Well, nothing new...
sauloperez
on 14 Feb 2020
This is what I found so far and the explanation I give it. I ran the report as if I was the enterprise owner and managed to get some data last Friday while you Aussies were sleeping. Hopefully, it didn't affect normal operation the next morning :see_no_evil: .
Impact on the system
It literally takes over 60s to generate this report in these lab conditions. The queries alone (just a handful) weight 37Kb :see_no_evil: The consequences are petty hard for the server. Almost no free memory left after it and high swap usage, which in turn makes everything slower. Ruby's garbage collector is not able to clean up the mem. used by the report either. See the stats after generating the report 3 times :point_down:
$ free -m
              total        used        free      shared  buff/cache   available
Mem:           7466        5014         525         189        1925        1976
Swap:          8319        5346        2973
Performance of the DB queries
I ran an explain analyze on the DB and I got this invaluable visual report: https://explain.dalibo.com/plan/hUj. Some things that stand out to me:
- The reason for the totally nuts sequential scans are the LEFT JOIN statements, which ask for the whole
spree_line_items,spree_variantsandspree_productstables, the former being the worst one of all due it's size. Check out "left outer join" in https://blog.codinghorror.com/a-visual-explanation-of-sql-joins/. - This becomes a big issue in AU because it's the oldest instance and has heaps of data. It has 360016 line items, 26060 variants, and 10004 products.
- We lack some specific indexing but it will become apparent when get rid of the LEFT JOINs. It seems negligible now.
- The queries themselves use a considerable amount of RAM due to the size of the dataset but within PostgreSQL
work_memlimits (I have to check that). - Based on my experiments, querying takes almost half the time of the whole. The rest is Ruby processing the tons of data: grouping, aggregating, etc. this should be done but the DB too, which will reduce the response time a lot more.
Issues that I encountered on the way
- We lack diagnostics data. I miss
pg_stat_statementsorpg_stat_activityat least. I'd be great to have auto-explain enabled too. We don't have nginx logs either. - This server does way to many different things that can potentially negatively affect each other. It has a Mysql and PHP running in it. I would seriously encourage to move responsibilities out of this machine.
- Move to a larger server (double the RAM and without swap), at least temporally will definitely improve things. This is easy with ofn-install.
sauloperez
on 18 Feb 2020
Sorry, this is taking me long but I do think is very worth it. We can't afford going back to it every now and then because the issue is not resolved. I did the first step in #4879
sauloperez
on 2 Mar 2020
I tested a similar scenario just last week in an unoptimized 500 MB RAM (no swap) dev server I am using for another Ruby project, where loading large DB data with lots of LEFT JOINS consistently killed the Rails console.
The last step I did before it started surviving was unloading associations through reset as soon as the Ruby objects are no longer needed. Maybe that's something we could try for some reports?
 kristinalim
on 3 Mar 2020
kristinalim
on 3 Mar 2020
Wow @kristinalim that's a pretty interesting insight! I didn't know #reset existed and yes, this might buy us some more time while we improve the report itself.
sauloperez
on 5 Mar 2020
Now that #4879 got into v2.7.9 I checked the performance of this report with Prom Coast Food Collective again and we didn't get the expected results :sob:
It still takes over 60s to generate the report. The good news is that the system is not suffering as much as it used to as reported in https://github.com/openfoodfoundation/openfoodnetwork/issues/4782#issuecomment-587341981 and the free mem after running the report is higher now.
$ free -m
              total        used        free      shared  buff/cache   available
Mem:           8955        5699        3048         137         207        2949
Swap:          8319        3820        4499
We can't conclude this improvement is due to #4879 as the new server has surely impact on that too, but now running this should become less of an emergency @mkllnk . Note, however, that it still uses a lot of swap, although not as much as used to, and that's a bit concerning
Another information worth mentioning is that the report, with Prom Coast Food Collective settings, allocates 63778040 objects :scream: . Unfortunately, I don't have a baseline to compare to.
EDIT
:warning: I dug deeper and checked the new query that gets generated to fetch the line items and I believe the situation got quite worse.
AR's eager loading went nuts with the changes we did and it's left joining lots more tables :see_no_evil:
v2.7.8's query: https://gist.github.com/sauloperez/3fe8600552894ae9f9659dbf0f532ee1
v2.7.9's query: https://gist.github.com/sauloperez/9c72e0b1fe9d5b0250d7421a4277c791
we might need to revert #4879. Thoughts @Matt-Yorkley @mkllnk @luisramos0 ?
sauloperez
on 18 Mar 2020
yeah, difficult stuff! We shouldnt wait for live execution to compare sql.
To work with this I recommend what I have done before: get the live data into your local computer and compare the SQL generated before and after your changes. It works well for a difficult problem as this one.
Looking at the SQL, there are lots of extra joins: enterprises, orders, shipments, shipping_methods, adjustments...
I vote for a revert, definitely. Or some form of evolution from this.
 luisramos0
on 18 Mar 2020
luisramos0
on 18 Mar 2020
I gave our server 11GB of memory now to speed things up and deal with the increased demand. You can see the memory increases in this graph and how it's just completely used:
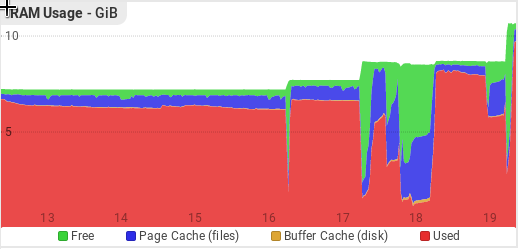
mkllnk
on 19 Mar 2020
yep, reverting is the good call here. The issue is that I didn't get an exact copy of AU prod DB but checked things in prod occasionally and that's why eager loading didn't behave the same in all DBs I tested this with.
I'm thinking that, with or without this regression @mkllnk, this should the AU's default RAM size from now on. The situation before this regression wasn't much better either.
sauloperez
on 19 Mar 2020
Related issues
 filipefurtad0
·
3Comments
filipefurtad0
·
3Comments
 myriamboure
·
3Comments
myriamboure
·
3Comments
 kirstenalarsen
·
3Comments
luisramos0
·
3Comments
filipefurtad0
·
3Comments
kirstenalarsen
·
3Comments
luisramos0
·
3Comments
filipefurtad0
·
3Comments