Kiali: Tracing and metrics fail to resolve
I have istio 0.7.1 installed with all of the add-ons (includes jaeger). However when I follow the instructions to install kiali I see errors to resolve grafana and jaeger services in the kiali UI. I don't see a configuration map that allows me to set the service URL. Are there built-in assumptions about the istio installation that kiali has baked in that I must use the istio install from the kiali project (I wouldn't think this would be the case).
Note, everything is installed in the istio-system namespace. I am using a 1.10.1 kubernetes install in IKS. Istio with grafana and jaeger are working fine.
 dcberg
All 35 comments
@dcberg thank you for reporting an issue.
I'm assuming the issue you have is incorrect links to Grafana and Jaeger. Can you tell us what are the URL displayed in your UI? Or don't you have any link at all?
While in an OpenShift setup, routes are created to provide access to Jaeger and Grafana services, in a plain Kubernetes setup these routes are not available, so Kiali tries to find the Grafana & Jaeger services external IPs, if configured, and build the URLs from that. As an alternative you can override the URLs in config, either via config map (named kiali / config.yaml)
products:
  grafana:
    url: VALUE
  jaeger:
    url: VALUE
or via environment variables :
GRAFANA_URL and JAEGER_URL
All options are described there: https://github.com/kiali/kiali#environment-variables
Hope it will help. Please let me know also if the documentation is inaccurate.
 jotak
on 29 May 2018
jotak
on 29 May 2018
@dcberg Thanks for the report. On top of what @jotak said: if you have a good idea on how to detect / set up the equivalent of the OpenShift routes for plain Kube, could you help us here and potentially even submit a PR ?
 pilhuhn
on 29 May 2018
pilhuhn
on 29 May 2018
@pilhuhn AFAIK the k8s ingress is the closest equivalent to openshift route. It requires also creating an Ingress controller (without which the created ingresses won't work, but it does exist by default on GCE), while (iirc) in openshift there is a Router out of the box.
 abonas
on 29 May 2018
abonas
on 29 May 2018
On 29 May 2018, at 13:31, abonas wrote:
@pilhuhn AFAIK the k8s
ingress
is the closest equivalent to openshift route. It requires
If that Ingress controller is created for Jaeger and Prometheus (which I
assume, as Istio users want to access them from outside the cluster),
we could try to find it and then populate the config map from it.
We = Kiali :-)
Patches are welcome 😎
pilhuhn
on 29 May 2018
@pilhuhn I cannot find any mention of ingress in p8s/grafana/jaeger "installation" files (at least for ymls that go with istio 0.7.1)
abonas
on 29 May 2018
Correct...ingress is the proper way to do this in k8s. I am using IKS which comes with a pre-installed ingress controller based on nginx. I have been able to make some progress.
I created an ingress resource in k8s that looks like the following....
apiVersion: extensions/v1beta1
kind: Ingress
metadata:
  name: kiali-ingress
  namespace: istio-system
  annotations:
    ingress.bluemix.net/rewrite-path: "serviceName=grafana rewrite=/;serviceName=jaeger-query rewrite=/"
spec:
  tls:
   - hosts:
     - <my-subdomain>
     secretName: <subdomain-secret>
  rules:
  - host: <my-subdomain>
    http:
      paths:
      - path: /
        backend:
          serviceName: kiali
          servicePort: 20001
      - path: /api/jaeger
        backend:
          serviceName: jaeger-query
          servicePort: 80
      - path: /api/grafana
        backend:
          serviceName: grafana
          servicePort: 3000
First I had to create a path to grafana and jaeger which kiali is expecting which are on the /api/grafana and /api/jaeger paths. Obviously grafana and jaeger know nothing of these paths which is why I have the rewrites in the annotation. I also had to use TLS because kiali complains if the routes are not secure (fair enough).
With the above ingress I am now seeing metrics on the service metrics tab. YAY!
But traces are still failing. In the Distributed Tracing tab I see the correct URL is used for jaeger but the page is blank (no obvious errors being thrown). When I go to the service > traces tab I get redirected to an undefined URL.
https://<my-subdomain>/console/namespaces/default/services/undefined/search?service=productpage
So close to making it work. :)
Any ideas?
dcberg
on 29 May 2018
actually, I just saw that for Istio there is another recommended way that is not Ingress (but it works on k8s too). it is called Istio Gateway https://istio.io/docs/tasks/traffic-management/ingress/
abonas
on 4 Jun 2018
@jotak Seems that simply adding external_services.jaeger.service and external_services.jaeger.service_namespace to kiali/config.yaml doesn't work.
Adding external_services.jaeger.url and environment variable doesn't work, either,
Here is my config for kiali:
apiVersion: v1
data:
  config.yaml: |
    server:
      port: 20001
      static_content_root_directory: /opt/kiali/console
      credentials:
        username: admin
        password: admin
    external_services:
      jaeger:
        service_namespace: istio-system
        service: jaeger-query
kind: ConfigMap
metadata:
  labels:
    app: kiali
  name: kiali
  namespace: istio-system
Still get error from kiali logs:
...
W0612 09:58:02.514872       1 unused_service.go:62] Deployment prometheus has not a proper version label [version]
W0612 09:58:02.514985       1 unused_service.go:62] Deployment servicegraph has not a proper version label [version]
I0612 09:58:02.522922       1 graph.go:326] DEBUG: Generating config for [cytoscape] service graph...
I0612 09:58:02.522941       1 graph.go:336] DEBUG: Done generating config for [cytoscape] service graph.
E0612 09:58:04.816654       1 jaeger.go:18] Unable to find Jaeger URL: no route defined. ExternalIPs not defined on service 'jaeger'
Have gone through the code that generates the err:
https://github.com/kiali/kiali/blob/master/handlers/jaeger.go#L26-L65
We can see that for plain Kubernetes cluster(not OpenShift), Kiali tries to find the Jaeger services external IPs, no matter whether the service_namespace and service are defined or not.
Why do we have to use external IP to access jaeger service? Can we use service's DNS + port? because we can ping jaeger service from kiali pod.
/cc @gyliu513
 morvencao
on 12 Jun 2018
morvencao
on 12 Jun 2018
@morvencao , I suspect you've read about external_services.jaeger... from the docs in master, but you're using an older version, no? Can you try to replace external_services with products ? It has been renamed lately.
As of why we're not using the service's DNS + port, it's because the config is only used to generate links in the front-end, so it has to be valid from your client browser standpoint, not for Kiali backend itself.
jotak
on 12 Jun 2018
@jotak Thanks for your reminder. Have updated external_services to products, still no good.
jaeger-query service in my env:
root@master:~# kubectl -n istio-system get svc jaeger-query -o yaml
apiVersion: v1
kind: Service
metadata:
  labels:
    app: tracing
    chart: tracing
    heritage: Tiller
    jaeger-infra: jaeger-service
    release: istio
  name: jaeger-query
  namespace: istio-system
spec:
  clusterIP: 10.0.0.242
  externalTrafficPolicy: Cluster
  ports:
  - name: query-http
    nodePort: 30051
    port: 80
    protocol: TCP
    targetPort: 16686
  selector:
    app: tracing
    chart: tracing
    heritage: Tiller
    release: istio
  sessionAffinity: None
  type: LoadBalancer
status:
  loadBalancer: {}
As you can see, I'm running istio and jaeger in a kubenetes cluster without loadbalancer, so the external IP for jaeger-query is empty.
morvencao
on 12 Jun 2018
@morvencao if you have any fixed url then I you should be able to use it in kiali's config, else you could still use the clusterIP but that would be only valid for testing purpose:
    products:
      jaeger:
        url: "http://10.0.0.242:80/"
At the moment I fear it's the only solution if there's no route explicitly exposed. If you see other ways to provide a working URL I'd be glad to know!
jotak
on 12 Jun 2018
@jotak Thanks. The only way I can make it is that exposing jaeger service by NodePort and setting products.jaeger.url to http://$NodeIP:$NodePort/
Will try other methods, like gateway API of istio-0.8.0.
morvencao
on 12 Jun 2018
A bit confused here: why not use "jaeger-query.istio-system:port" ? K8S will resolve this.
Creating an Ingress or Gateway are pretty risky - it would mean exposing it to the web. We could use an internal gateway (ILB) - but that doesn't work in a lot of clouds.
 costinm
on 14 Jul 2018
costinm
on 14 Jul 2018
@costinm The .istio-system implies that Istio-Jaeger are deployed in the istio-system namespace, where some folks apparently want to deploy it somewhere else.
So I guess we need to be a bit more clever and not put any static namespace in, but rather templatize the chart here.
pilhuhn
on 16 Jul 2018
Actually the jaeger namespace can be configured.
But such URL would work if jaeger-query was accessed from kiali backend, but here it's accessed from the client browser.
Til recently at least: this PR #336 may have changed how we can handle jaeger access.
@aljesusg , is it something that your PR has "fixed" ? (ie. going to jaeger through proxy + jaeger-query.namespace:port)
jotak
on 16 Jul 2018
If some folks want to deploy somewhere else - they may run into problems, since that deployment is not typically tested or supported or recommended. That's fine - but the kiali template that is included in istio
should still default to the recommended values, and if needed provide some way to override ( using Release.Namespace like other components ).
Customized or not - the real problem is that it now depends on a (customized) URL which is hard to setup automatically (and securely) - when it could use a customized service name.
costinm
on 17 Jul 2018
Actually Kiali have a proxy to query Jaeger service to avoid the SSL configuration while we finish the security feature, so with the new Configmaps you'll have two services in Kiali but this not impact in the istio installation.
 aljesusg
on 17 Jul 2018
aljesusg
on 17 Jul 2018
Kial is included in a release version of it 1.0.0 helm chart. I think it will be good practice to provide working defaults for Jeager and Prometheus. Could anyone provide example Istio helm chart with proper configuration of Kiali?
 swistaczek
on 7 Aug 2018
swistaczek
on 7 Aug 2018
I installed kiali as the official website steps but got the error messages:
Distributed Tracing is not available.
This could mean that we couldn't communicate to the service.
 rootsongjc
on 8 Aug 2018
rootsongjc
on 8 Aug 2018
I think is related to this JIRA https://issues.jboss.org/browse/KIALI-1293
Looking at it
 lucasponce
on 8 Aug 2018
lucasponce
on 8 Aug 2018
@lucasponce @jotak
The PR for this issue should be merged: https://github.com/kiali/kiali/pull/412
Have tried with the latest image from https://hub.docker.com/r/kiali/kiali/
Still can't get tracing rendered properly, without error message. Just get You need to enable JavaScript to run this app. in chrome console.
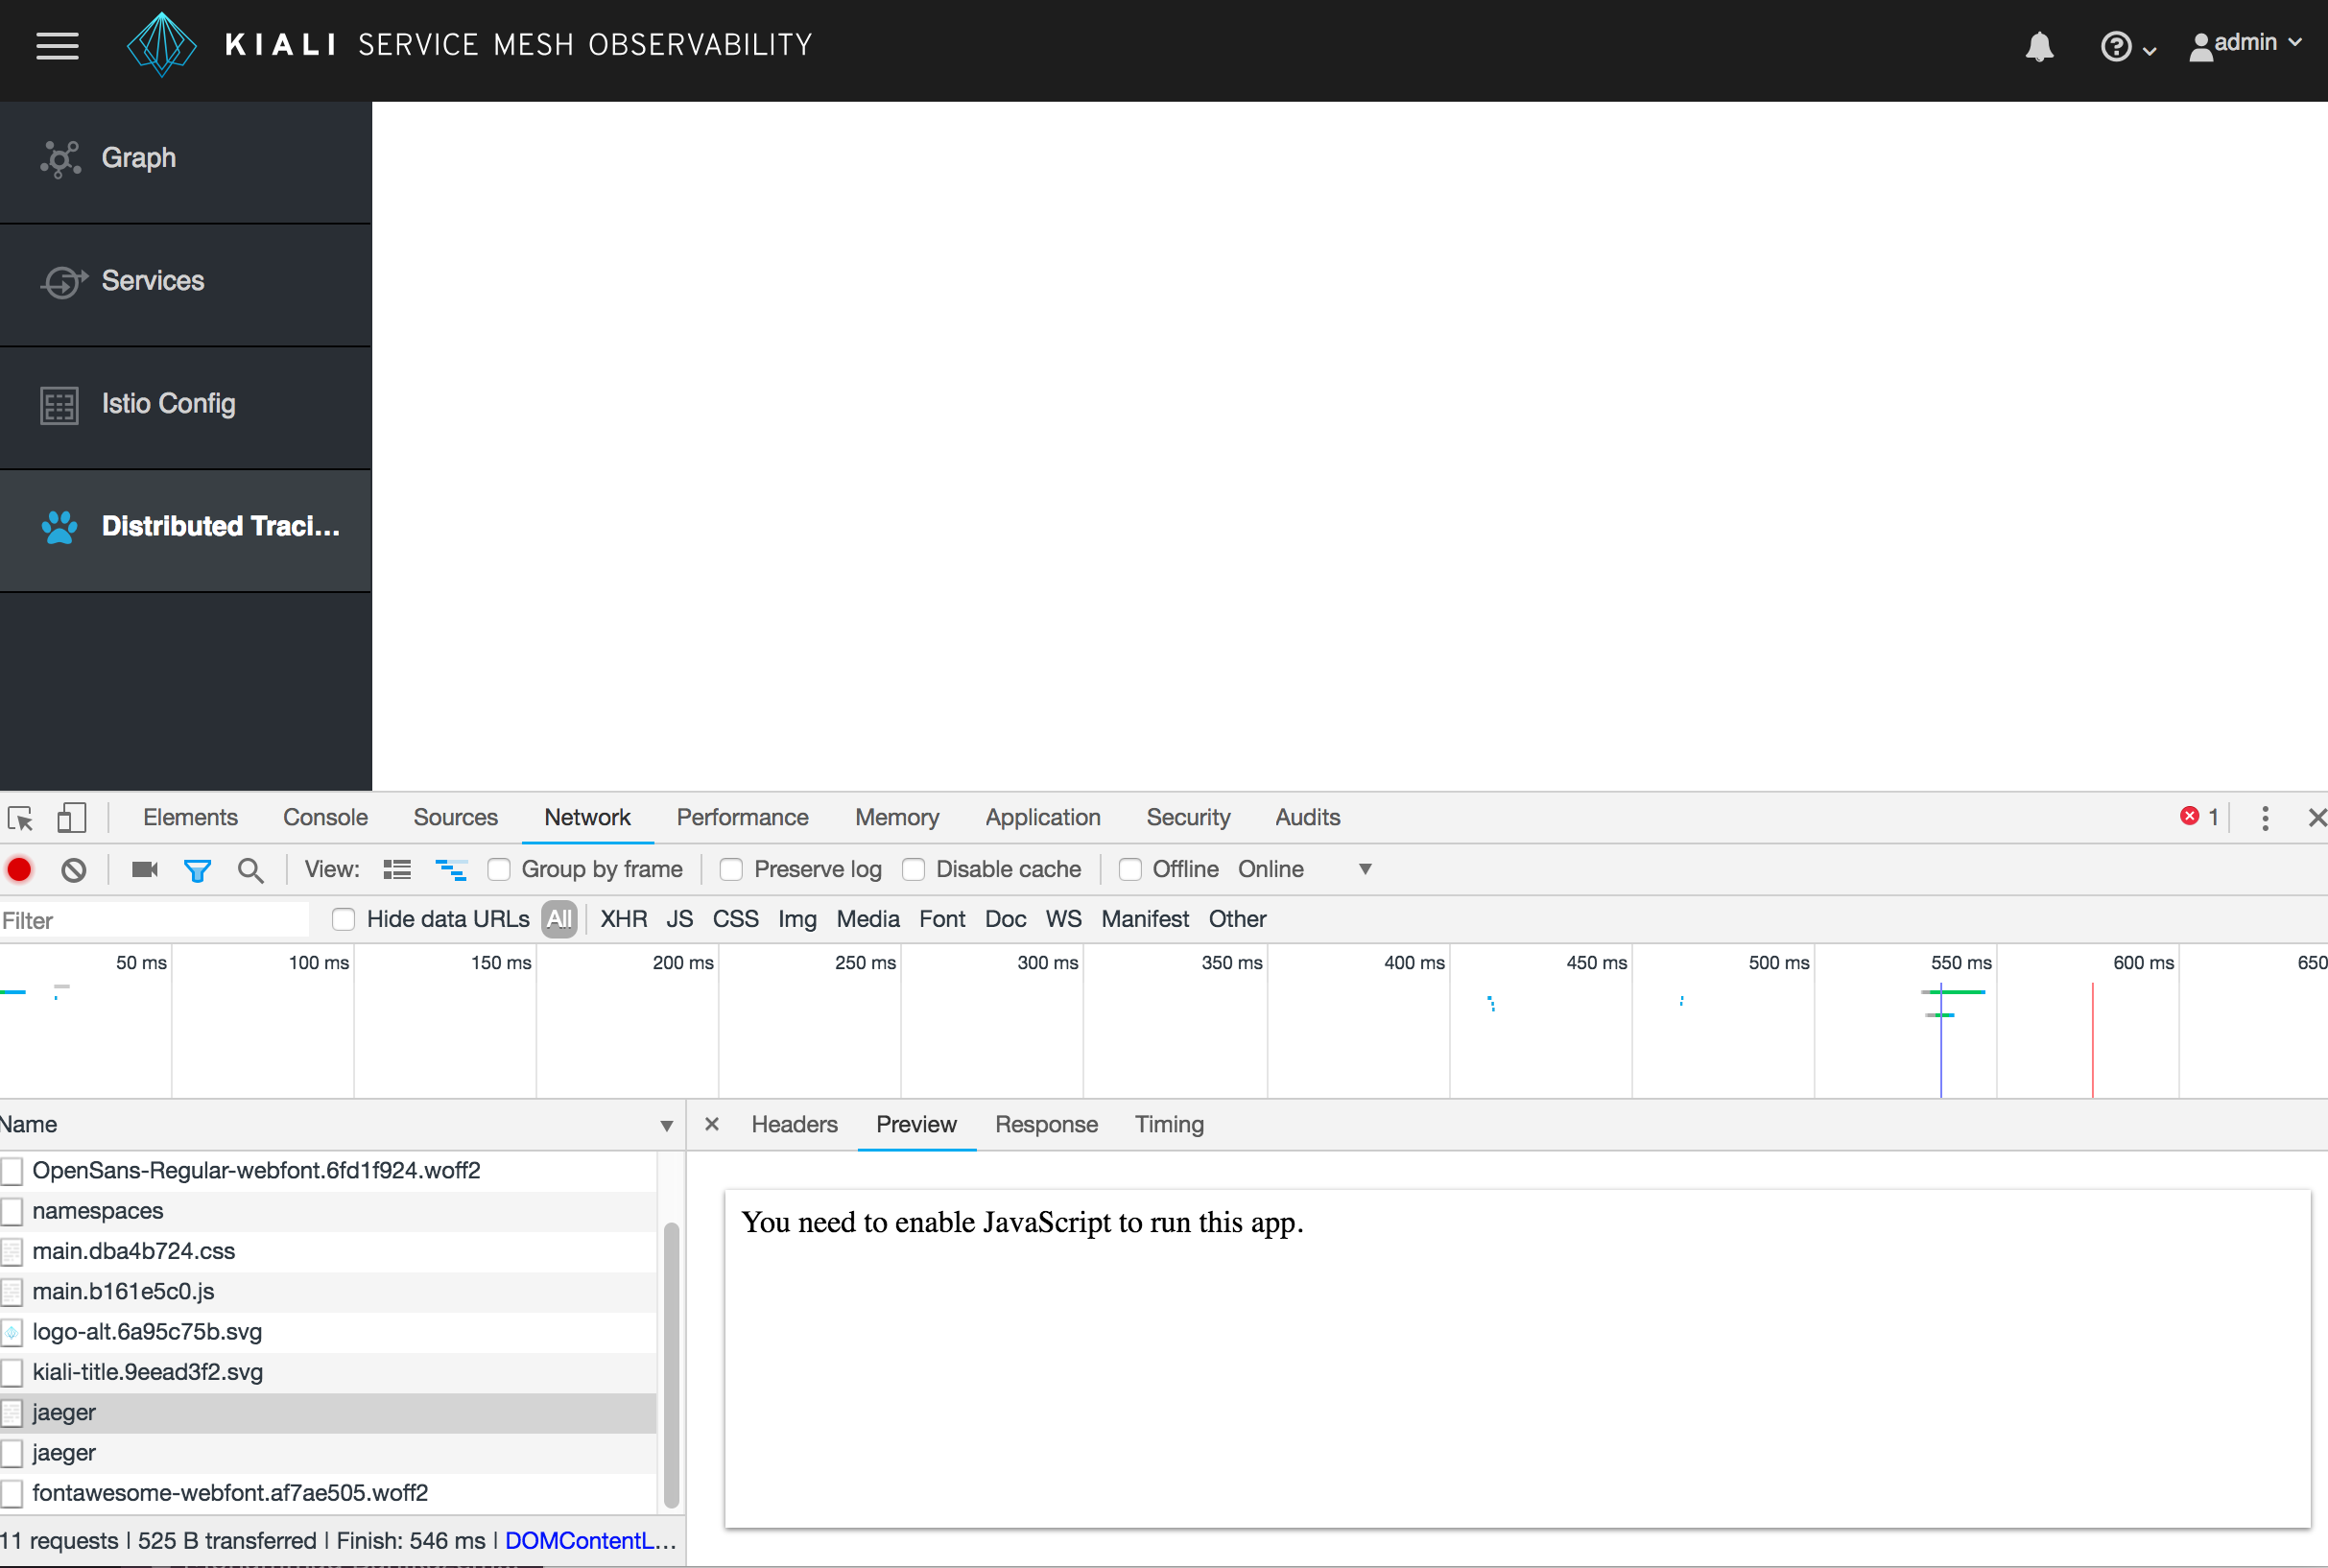
Not sure whether this is related to my browser settings, because javascript is enabled for my chrome.
Or am I missing something?
I'm playing with Istio 1.0.0 on K8s 1.11.1 cluster with jaeger as tracing service in istio-system system. Have checked with the env list: https://github.com/kiali/kiali#environment-variables, my settings should be OK. I have no idea what causes this.
morvencao
on 14 Aug 2018
Thanks @morvencao for the feedback.
Perhaps this issue depends on k8s (I've tested on OpenShift).
Please, could you run a couple of checks ?
- Run a
oc get services -n istio-systemor similarkubectl get services -n istio-systemand check where is the jaeger service listening, for example, on my test environment I have:
jaeger-query ClusterIP 172.30.224.50 <none> 16686/TCP 22h
Kiali basically reads jaeger from this service and exposes it as a proxy for the UI.
- Could you attach the kiali pod logs ? Probably if there is some connection problem, it should be logged there.
- Note that there should be no environment variable related as jaeger if proxy is istio is deployed on default location.
- Also, are you using some certificate for your cluster ? We have found some issue related to it and there is a work in progress related to that (PR https://github.com/kiali/kiali/pull/376).
Thanks !
lucasponce
on 14 Aug 2018
@lucasponce
jaeger service is listening the default port with default name, so I didn't set any environment variables.
root@master:~# kubectl -n istio-system get svc | grep jaeger
jaeger-agent               ClusterIP      None         <none>        5775/UDP,6831/UDP,6832/UDP                                                                                  7h
jaeger-collector           ClusterIP      10.0.0.179   <none>        14267/TCP,14268/TCP                                                                                         7h
jaeger-query               ClusterIP      10.0.0.161   <none>        16686/TCP
Didn't find any useful info about connection problem in kiali logs:
root@master:~# kubectl -n istio-system logs -f kiali-6ddb4b887d-m2lj6 | head -n 100
I0814 03:50:57.951135       1 kiali.go:59] Kiali: Version: v0.5.1-SNAPSHOT, Commit: b6bdfb185e9c68f82746d108a436a42506fbc2dd
I0814 03:50:57.951253       1 kiali.go:60] DEBUG: Kiali: Command line: [/opt/kiali/kiali -config /kiali-configuration/config.yaml -v 4]
I0814 03:50:57.951269       1 config.go:276] DEBUG: Reading YAML config from [/kiali-configuration/config.yaml]
I0814 03:50:57.951570       1 kiali.go:80] Kiali: Console version: 0.6.0-SNAPSHOT.1895
I0814 03:50:57.953024       1 server.go:43] Server endpoint will start at [:20001]
I0814 03:50:57.953040       1 server.go:44] Server endpoint will serve static content from [/opt/kiali/console]
I0814 03:58:29.438494       1 graph.go:83] DEBUG: Build graph for [6] namespaces [[cert-manager default kube-public kube-system platform services]]
I0814 03:58:29.438523       1 graph.go:87] DEBUG: Build traffic map for namespace [cert-manager]
I0814 03:58:29.438553       1 graph.go:398] DEBUG: Executing query round(sum(rate(istio_requests_total{reporter="destination",source_workload="unknown",destination_service_namespace="cert-manager",response_code=~"[2345][0-9][0-9]"} [60s])) by (source_workload_namespace,source_workload,source_app,source_version,destination_service_namespace,destination_service_name,destination_workload,destination_app,destination_version,response_code),0.001)@time=2018-08-14 03:58:29 (now=2018-08-14 03:58:29, 1534219109)
I0814 03:58:29.441679       1 graph.go:398] DEBUG: Executing query round(sum(rate(istio_requests_total{reporter="source",source_workload_namespace!="cert-manager",destination_service_namespace="cert-manager",response_code=~"[2345][0-9][0-9]"} [60s])) by (source_workload_namespace,source_workload,source_app,source_version,destination_service_namespace,destination_service_name,destination_workload,destination_app,destination_version,response_code),0.001)@time=2018-08-14 03:58:29 (now=2018-08-14 03:58:29, 1534219109)
I0814 03:58:29.442923       1 graph.go:398] DEBUG: Executing query round(sum(rate(istio_requests_total{reporter="source",source_workload_namespace="cert-manager",response_code=~"[2345][0-9][0-9]"} [60s])) by (source_workload_namespace,source_workload,source_app,source_version,destination_service_namespace,destination_service_name,destination_workload,destination_app,destination_version,response_code),0.001)@time=2018-08-14 03:58:29 (now=2018-08-14 03:58:29, 1534219109)
I0814 03:58:29.487436       1 unused_node.go:62] DEBUG: Adding unused node for deployment [cert-manager-cert-manager] with labels [map[app:cert-manager chart:cert-manager-0.3.2 heritage:Tiller release:cert-manager]]
I0814 03:58:29.505526       1 graph.go:87] DEBUG: Build traffic map for namespace [default]
I0814 03:58:29.505627       1 graph.go:398] DEBUG: Executing query round(sum(rate(istio_requests_total{reporter="destination",source_workload="unknown",destination_service_namespace="default",response_code=~"[2345][0-9][0-9]"} [60s])) by (source_workload_namespace,source_workload,source_app,source_version,destination_service_namespace,destination_service_name,destination_workload,destination_app,destination_version,response_code),0.001)@time=2018-08-14 03:58:29 (now=2018-08-14 03:58:29, 1534219109)
I0814 03:58:29.507277       1 graph.go:398] DEBUG: Executing query round(sum(rate(istio_requests_total{reporter="source",source_workload_namespace!="default",destination_service_namespace="default",response_code=~"[2345][0-9][0-9]"} [60s])) by (source_workload_namespace,source_workload,source_app,source_version,destination_service_namespace,destination_service_name,destination_workload,destination_app,destination_version,response_code),0.001)@time=2018-08-14 03:58:29 (now=2018-08-14 03:58:29, 1534219109)
I0814 03:58:29.508537       1 graph.go:398] DEBUG: Executing query round(sum(rate(istio_requests_total{reporter="source",source_workload_namespace="default",response_code=~"[2345][0-9][0-9]"} [60s])) by (source_workload_namespace,source_workload,source_app,source_version,destination_service_namespace,destination_service_name,destination_workload,destination_app,destination_version,response_code),0.001)@time=2018-08-14 03:58:29 (now=2018-08-14 03:58:29, 1534219109)
I0814 03:58:29.512450       1 graph.go:87] DEBUG: Build traffic map for namespace [kube-public]
I0814 03:58:29.512473       1 graph.go:398] DEBUG: Executing query round(sum(rate(istio_requests_total{reporter="destination",source_workload="unknown",destination_service_namespace="kube-public",response_code=~"[2345][0-9][0-9]"} [60s])) by (source_workload_namespace,source_workload,source_app,source_version,destination_service_namespace,destination_service_name,destination_workload,destination_app,destination_version,response_code),0.001)@time=2018-08-14 03:58:29 (now=2018-08-14 03:58:29, 1534219109)
I0814 03:58:29.514420       1 graph.go:398] DEBUG: Executing query round(sum(rate(istio_requests_total{reporter="source",source_workload_namespace!="kube-public",destination_service_namespace="kube-public",response_code=~"[2345][0-9][0-9]"} [60s])) by (source_workload_namespace,source_workload,source_app,source_version,destination_service_namespace,destination_service_name,destination_workload,destination_app,destination_version,response_code),0.001)@time=2018-08-14 03:58:29 (now=2018-08-14 03:58:29, 1534219109)
I0814 03:58:29.515860       1 graph.go:398] DEBUG: Executing query round(sum(rate(istio_requests_total{reporter="source",source_workload_namespace="kube-public",response_code=~"[2345][0-9][0-9]"} [60s])) by (source_workload_namespace,source_workload,source_app,source_version,destination_service_namespace,destination_service_name,destination_workload,destination_app,destination_version,response_code),0.001)@time=2018-08-14 03:58:29 (now=2018-08-14 03:58:29, 1534219109)
I0814 03:58:29.519745       1 graph.go:87] DEBUG: Build traffic map for namespace [kube-system]
I0814 03:58:29.519773       1 graph.go:398] DEBUG: Executing query round(sum(rate(istio_requests_total{reporter="destination",source_workload="unknown",destination_service_namespace="kube-system",response_code=~"[2345][0-9][0-9]"} [60s])) by (source_workload_namespace,source_workload,source_app,source_version,destination_service_namespace,destination_service_name,destination_workload,destination_app,destination_version,response_code),0.001)@time=2018-08-14 03:58:29 (now=2018-08-14 03:58:29, 1534219109)
I0814 03:58:29.520809       1 graph.go:398] DEBUG: Executing query round(sum(rate(istio_requests_total{reporter="source",source_workload_namespace!="kube-system",destination_service_namespace="kube-system",response_code=~"[2345][0-9][0-9]"} [60s])) by (source_workload_namespace,source_workload,source_app,source_version,destination_service_namespace,destination_service_name,destination_workload,destination_app,destination_version,response_code),0.001)@time=2018-08-14 03:58:29 (now=2018-08-14 03:58:29, 1534219109)
I0814 03:58:29.521919       1 graph.go:398] DEBUG: Executing query round(sum(rate(istio_requests_total{reporter="source",source_workload_namespace="kube-system",response_code=~"[2345][0-9][0-9]"} [60s])) by (source_workload_namespace,source_workload,source_app,source_version,destination_service_namespace,destination_service_name,destination_workload,destination_app,destination_version,response_code),0.001)@time=2018-08-14 03:58:29 (now=2018-08-14 03:58:29, 1534219109)
I0814 03:58:29.533368       1 unused_node.go:62] DEBUG: Adding unused node for deployment [calico-kube-controllers] with labels [map[app:calico-kube-controllers]]
I0814 03:58:29.537226       1 unused_node.go:62] DEBUG: Adding unused node for deployment [custom-metrics-adapter] with labels [map[release:custom-metrics-adapter app:custom-metrics-adapter chart:ibm-custom-metrics-adapter-0.2.2 heritage:Tiller]]
I0814 03:58:29.537246       1 unused_node.go:62] DEBUG: Adding unused node for deployment [default-backend] with labels [map[app:default-backend chart:nginx-ingress-0.16.2 component:default-backend heritage:Tiller release:nginx-ingress]]
I0814 03:58:29.537254       1 unused_node.go:62] DEBUG: Adding unused node for deployment [heapster] with labels [map[k8s-app:heapster kubernetes.io/cluster-service:true]]
I0814 03:58:29.537260       1 unused_node.go:62] DEBUG: Adding unused node for deployment [helm-api] with labels [map[app:helm-api]]
I0814 03:58:29.537266       1 unused_node.go:62] DEBUG: Adding unused node for deployment [helm-repo] with labels [map[app:helm-repo]]
I0814 03:58:29.537274       1 unused_node.go:62] DEBUG: Adding unused node for deployment [ibmcloud-image-enforcement] with labels [map[app:ibmcloud-image-enforcement chart:ibmcloud-image-enforcement-0.2.1 heritage:Tiller release:image-security-enforcement]]
I0814 03:58:29.537280       1 unused_node.go:62] DEBUG: Adding unused node for deployment [metering-dm] with labels [map[app:metering-dm component:meteringsvc]]
I0814 03:58:29.537304       1 unused_node.go:62] DEBUG: Adding unused node for deployment [metering-ui] with labels [map[app:metering-ui component:meteringsvc]]
I0814 03:58:29.537313       1 unused_node.go:62] DEBUG: Adding unused node for deployment [metrics-server] with labels [map[k8s-app:metrics-server kubernetes.io/cluster-service:true]]
I0814 03:58:29.537321       1 unused_node.go:62] DEBUG: Adding unused node for deployment [monitoring-exporter] with labels [map[chart:ibm-icpmonitoring component:collectdexporter heritage:Tiller release:monitoring app:monitoring-exporter]]
I0814 03:58:29.537411       1 unused_node.go:62] DEBUG: Adding unused node for deployment [monitoring-grafana] with labels [map[heritage:Tiller release:monitoring app:monitoring-grafana chart:ibm-icpmonitoring component:grafana]]
I0814 03:58:29.537443       1 unused_node.go:62] DEBUG: Adding unused node for deployment [monitoring-prometheus] with labels [map[app:monitoring-prometheus chart:ibm-icpmonitoring component:prometheus heritage:Tiller release:monitoring]]
I0814 03:58:29.537456       1 unused_node.go:62] DEBUG: Adding unused node for deployment [monitoring-prometheus-alertmanager] with labels [map[app:monitoring-prometheus-alertmanager chart:ibm-icpmonitoring component:alertmanager heritage:Tiller release:monitoring]]
I0814 03:58:29.537467       1 unused_node.go:62] DEBUG: Adding unused node for deployment [monitoring-prometheus-elasticsearchexporter] with labels [map[release:monitoring app:monitoring-prometheus chart:ibm-icpmonitoring component:elasticsearchexporter heritage:Tiller]]
I0814 03:58:29.537476       1 unused_node.go:62] DEBUG: Adding unused node for deployment [monitoring-prometheus-kubestatemetrics] with labels [map[chart:ibm-icpmonitoring component:kubestatemetrics heritage:Tiller release:monitoring app:monitoring-prometheus]]
I0814 03:58:29.537484       1 unused_node.go:62] DEBUG: Adding unused node for deployment [secret-watcher] with labels [map[app:secret-watcher chart:secret-watcher-1.0.0 component:secret-watcher heritage:Tiller release:secret-watcher]]
I0814 03:58:29.537495       1 unused_node.go:62] DEBUG: Adding unused node for deployment [service-catalog-controller-manager] with labels [map[chart:service-catalog-0.0.13 heritage:Tiller release:service-catalog app:service-catalog]]
I0814 03:58:29.537501       1 unused_node.go:62] DEBUG: Adding unused node for deployment [tiller-deploy] with labels [map[app:helm name:tiller]]
W0814 03:58:29.658782       1 sidecars_check.go:64] Sidecar check found no pods Checking sidecars node [vapp_kube-system_service-catalog-controller-manager] num pods [0]
I0814 03:58:29.663731       1 graph.go:87] DEBUG: Build traffic map for namespace [platform]
I0814 03:58:29.663759       1 graph.go:398] DEBUG: Executing query round(sum(rate(istio_requests_total{reporter="destination",source_workload="unknown",destination_service_namespace="platform",response_code=~"[2345][0-9][0-9]"} [60s])) by (source_workload_namespace,source_workload,source_app,source_version,destination_service_namespace,destination_service_name,destination_workload,destination_app,destination_version,response_code),0.001)@time=2018-08-14 03:58:29 (now=2018-08-14 03:58:29, 1534219109)
I0814 03:58:29.665237       1 graph.go:398] DEBUG: Executing query round(sum(rate(istio_requests_total{reporter="source",source_workload_namespace!="platform",destination_service_namespace="platform",response_code=~"[2345][0-9][0-9]"} [60s])) by (source_workload_namespace,source_workload,source_app,source_version,destination_service_namespace,destination_service_name,destination_workload,destination_app,destination_version,response_code),0.001)@time=2018-08-14 03:58:29 (now=2018-08-14 03:58:29, 1534219109)
I0814 03:58:29.666560       1 graph.go:398] DEBUG: Executing query round(sum(rate(istio_requests_total{reporter="source",source_workload_namespace="platform",response_code=~"[2345][0-9][0-9]"} [60s])) by (source_workload_namespace,source_workload,source_app,source_version,destination_service_namespace,destination_service_name,destination_workload,destination_app,destination_version,response_code),0.001)@time=2018-08-14 03:58:29 (now=2018-08-14 03:58:29, 1534219109)
I0814 03:58:29.670551       1 graph.go:87] DEBUG: Build traffic map for namespace [services]
I0814 03:58:29.670573       1 graph.go:398] DEBUG: Executing query round(sum(rate(istio_requests_total{reporter="destination",source_workload="unknown",destination_service_namespace="services",response_code=~"[2345][0-9][0-9]"} [60s])) by (source_workload_namespace,source_workload,source_app,source_version,destination_service_namespace,destination_service_name,destination_workload,destination_app,destination_version,response_code),0.001)@time=2018-08-14 03:58:29 (now=2018-08-14 03:58:29, 1534219109)
I0814 03:58:29.671832       1 graph.go:398] DEBUG: Executing query round(sum(rate(istio_requests_total{reporter="source",source_workload_namespace!="services",destination_service_namespace="services",response_code=~"[2345][0-9][0-9]"} [60s])) by (source_workload_namespace,source_workload,source_app,source_version,destination_service_namespace,destination_service_name,destination_workload,destination_app,destination_version,response_code),0.001)@time=2018-08-14 03:58:29 (now=2018-08-14 03:58:29, 1534219109)
I0814 03:58:29.672932       1 graph.go:398] DEBUG: Executing query round(sum(rate(istio_requests_total{reporter="source",source_workload_namespace="services",response_code=~"[2345][0-9][0-9]"} [60s])) by (source_workload_namespace,source_workload,source_app,source_version,destination_service_namespace,destination_service_name,destination_workload,destination_app,destination_version,response_code),0.001)@time=2018-08-14 03:58:29 (now=2018-08-14 03:58:29, 1534219109)
I0814 03:58:29.676578       1 graph.go:378] DEBUG: Generating config for [cytoscape] service graph...
I0814 03:58:29.676710       1 graph.go:388] DEBUG: Done generating config for [cytoscape] service graph.
Thanks @morvencao.
Could you please check latest docker kiali image ?
There was an issue where we update a fix that probably is related here:
https://github.com/kiali/kiali/issues/416
Let me know if that solves your issue or if you are facing a different one.
Thanks !
lucasponce
on 14 Aug 2018
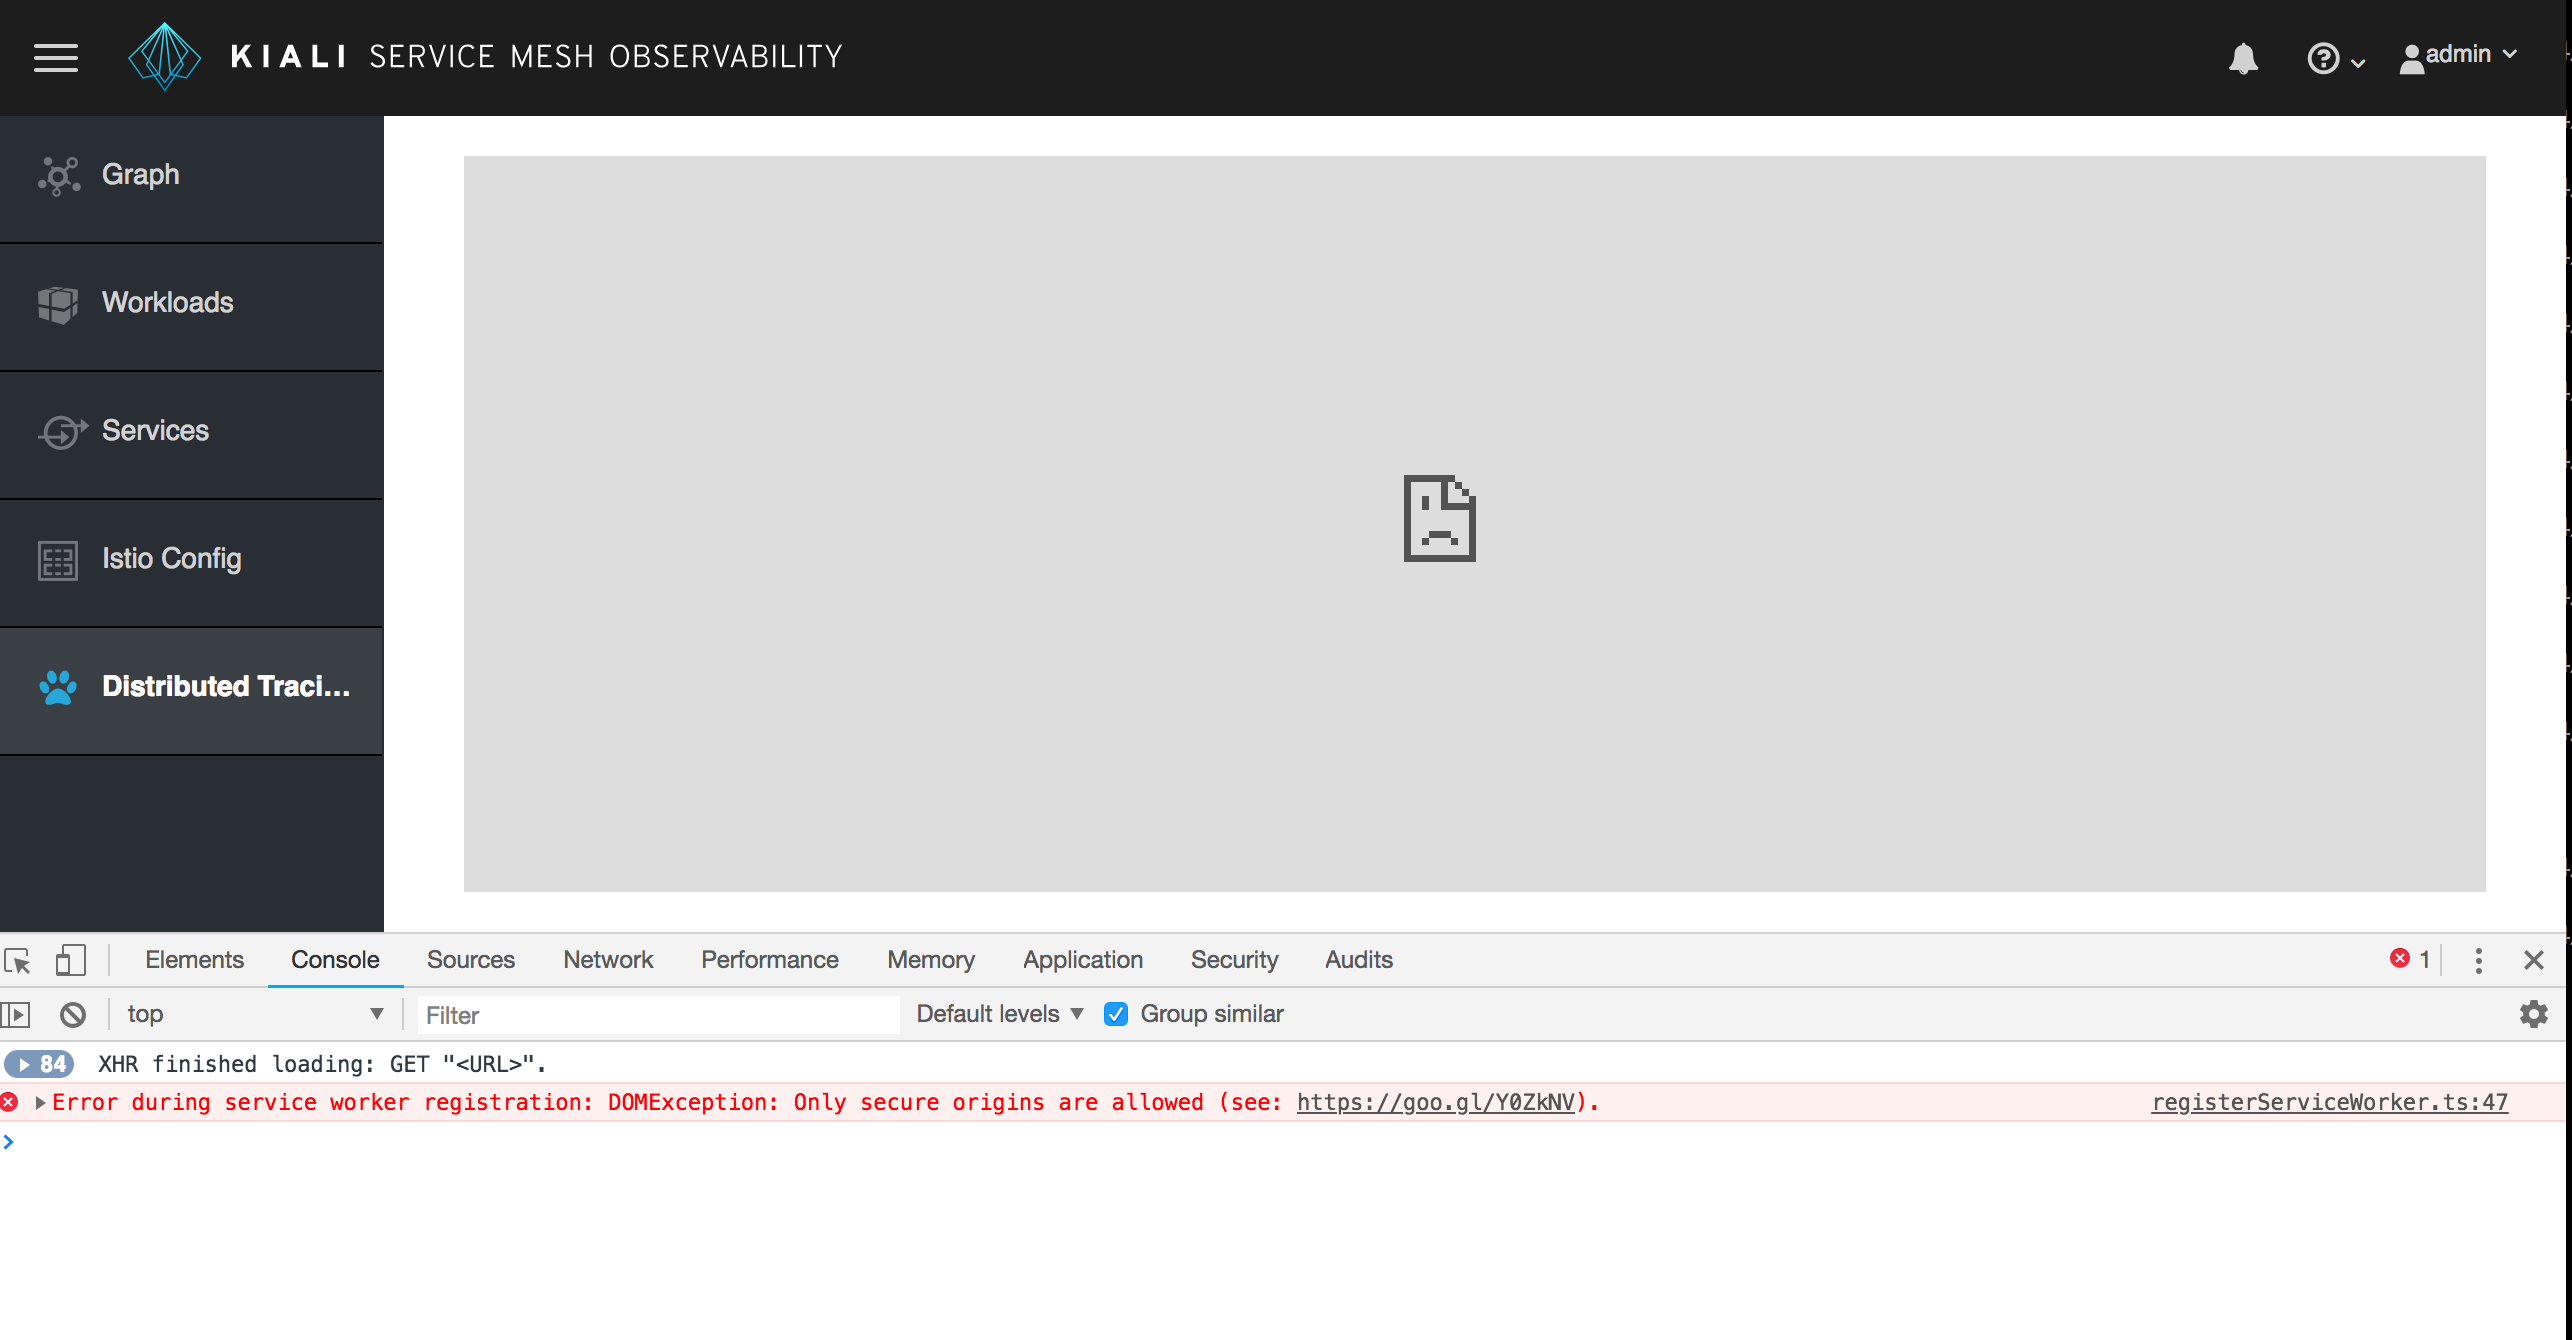
@lucasponce Have tried on the latest kiali image.
This time it should get the right proxy address for jaeger service, but blocked by chrome:

BTW, I can't access the proxy address for jageger-query from my browser: http://9.111.255.160:32439/
There isn't any useful message from kiali logs.
Just error message from chrome console:
registerServiceWorker.ts:47 Error during service worker registration: DOMException: Only secure origins are allowed (see: https://goo.gl/Y0ZkNV).
@morvencao ok, thanks for access, I guess the issue now is that kiali is deployed under a full SSL context but the proxy is still open.
Yes, we know that, there is a work in progress PR around it https://github.com/kiali/kiali/pull/376 not yet finished.
I think it will be fixed once that work is done.
The workaround is to accept the unsecure proxy link at the moment.
If you deploy Kiali under a non secure scenario, I think you don't have this issue. Am I right ?
(Just to confirm the problem).
lucasponce
on 14 Aug 2018
@lucasponce Thanks, this should be SSL issue.
But I don't know how to workaround this, since the jaeger app must be served in https to work:
https://developers.google.com/web/fundamentals/primers/service-workers/#you_need_https
morvencao
on 15 Aug 2018
With latest Kiali:
kiali-ui 0.6.0 (7ebeee3bec89b26235995d393ad99908b8fdb470)
kiali v0.6.0 (23643f7f6a099041692205ba5affa7b3a91cabdd)
Components
Istio 1.0.0
Prometheus 2.3.1
Kubernetes v1.11.1+icp-ee
jaeger in kiali is still not working:
morvencao
on 21 Aug 2018
@morvencao, could you please check the network tab in the chrome debug view and see which service is failing ?
Another checks that will help to debug this issue:
- Can you check the services of istio-system namespace (kubectl get services -n istio-system) (to validate that jaeger-query service is serving internally in the mesh on the 16686 port) ?
- Can you check if you can access to port 32439 where kiali is being served to the UI application ?
- Are you installing Kiali from a https or http ?
Basically, kiali listen to jaeger-query service on 16686 and exposes it under 32439 port to avoid manually create a route and config.
If it doesn't work, let me know and we can debug what is going on, feel free to jump into #kiali on freenode (nick lponce) and we can review your environment.
Thanks.
Lucas
lucasponce
on 21 Aug 2018
@lucasponce Thanks for your reply.
- Have checked the network tab of chrome debug view:
Filed for the request:http://9.111.254.149:32439/, response size is 0B.
- Kiali is installed with
http, nothttps - Actually I can't access this url
http://9.111.254.149:32439/from another chrome tab. jaeger-queryservice is serving internal on16686port:
root@mc-mst:~# kubectl -n istio-system get svc
NAME                       TYPE           CLUSTER-IP   EXTERNAL-IP   PORT(S)                                                                                                     AGE
grafana                    NodePort       10.0.0.228   <none>        3000:32545/TCP                                                                                              9h
istio-citadel              ClusterIP      10.0.0.136   <none>        8060/TCP,9093/TCP                                                                                           9h
istio-egressgateway        ClusterIP      10.0.0.55    <none>        80/TCP,443/TCP                                                                                              9h
istio-galley               ClusterIP      10.0.0.135   <none>        443/TCP,9093/TCP                                                                                            9h
istio-ingressgateway       LoadBalancer   10.0.0.150   <pending>     80:31380/TCP,443:31390/TCP,31400:31400/TCP,15011:30427/TCP,8060:32038/TCP,15030:31362/TCP,15031:31863/TCP   9h
istio-pilot                ClusterIP      10.0.0.229   <none>        15010/TCP,15011/TCP,8080/TCP,9093/TCP                                                                       9h
istio-policy               ClusterIP      10.0.0.184   <none>        9091/TCP,15004/TCP,9093/TCP                                                                                 9h
istio-sidecar-injector     ClusterIP      10.0.0.165   <none>        443/TCP                                                                                                     9h
istio-statsd-prom-bridge   ClusterIP      10.0.0.149   <none>        9102/TCP,9125/UDP                                                                                           9h
istio-telemetry            ClusterIP      10.0.0.62    <none>        9091/TCP,15004/TCP,9093/TCP,42422/TCP                                                                       9h
jaeger-agent               ClusterIP      None         <none>        5775/UDP,6831/UDP,6832/UDP                                                                                  9h
jaeger-collector           ClusterIP      10.0.0.241   <none>        14267/TCP,14268/TCP                                                                                         9h
jaeger-query               ClusterIP      10.0.0.19    <none>        16686/TCP                                                                                                   9h
kiali                      NodePort       10.0.0.92    <none>        20001:31521/TCP                                                                                             9h
prometheus                 ClusterIP      10.0.0.41    <none>        9090/TCP                                                                                                    9h
servicegraph               ClusterIP      10.0.0.85    <none>        8088/TCP                                                                                                    9h
tracing                    ClusterIP      10.0.0.54    <none>        16686/TCP                                                                                                   9h
zipkin                     ClusterIP      10.0.0.141   <none>        9411/TCP
Thanks @morvencao, so, the url http://9.111.254.149/ is serving kiali on port 80 ? Perhaps there is some route (NAT) from your browser to that IP or the way kiali is accessed from the UI ?.
In theory kiali pod should open a port on 32439 to serve jaeger query service.
In any case, I'm going to work on a JIRA to make the proxy fully configurable to avoid these cases.
I will notify when it is ready on latest image.
lucasponce
on 21 Aug 2018
@lucasponce Thanks . Kiali is serving internal on port 2001 and nodePort to be 31521. I access the kiali UI with nodePort.
morvencao
on 21 Aug 2018
@morvencao how do you install Kiali ?
I see that in https://github.com/kiali/kiali/blob/master/deploy/kubernetes/kiali.yaml#L39
There is a nodePort defined, but for some reason it doesn't show in your cluster.
(If I could reproduce the same steps to install a similar cluster, that would be great).
lucasponce
on 21 Aug 2018
@lucasponce Wow, thanks. I think I found the root cause and solution. I didn't create the kiali-jaeger service. I have installed kiali from Istio chart, obviously it didn't include the patch: https://github.com/kiali/kiali/commit/8446cc1e8c6bcd4240dc6baaf35e30ad75b5b832
I have to fire a PR to Istio to fix this.
morvencao
on 21 Aug 2018
We can close this
aljesusg
on 25 Jan 2019
Related issues
 jwurm
·
6Comments
abonas
·
5Comments
jwurm
·
6Comments
abonas
·
5Comments
 mtho11
·
5Comments
lucasponce
·
3Comments
lucasponce
·
5Comments
mtho11
·
5Comments
lucasponce
·
3Comments
lucasponce
·
5Comments
Most helpful comment
@lucasponce Wow, thanks. I think I found the root cause and solution. I didn't create the
kiali-jaegerservice. I have installed kiali from Istio chart, obviously it didn't include the patch: https://github.com/kiali/kiali/commit/8446cc1e8c6bcd4240dc6baaf35e30ad75b5b832I have to fire a PR to Istio to fix this.