Enterprise: Treemap: not drawn correctly when 1 value is dominating
Describe the bug
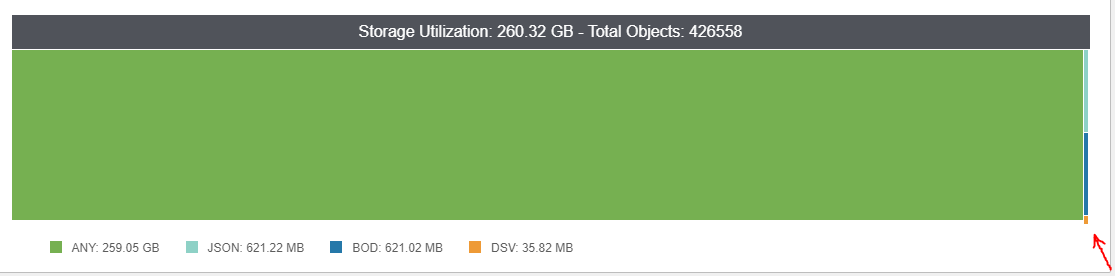
The chart is not drawn correctly when 1 value is dominating
To Reproduce
Steps to reproduce the behavior:
- create more values for treemap chart
- make one value something like 99% of the total
- observe chart
Expected behavior
Chart should be drawn properly as full rectangle
Screenshots
If applicable, add screenshots to help explain your problem.
 hohnzy
All 14 comments
What data do you have? I feel like this is maybe a non issue because if it is 99% it shouldn't fill the whole thing there might be a small strip in there.
 tmcconechy
on 16 Sep 2019
tmcconechy
on 16 Sep 2019
You can see the data in the legend
`{
  "size": 2.6345027174E11,
  "count": 428345,
  "data": [
    {
      "name": "Bod",
      "value": 621020385
    },
    {
      "name": "JSON",
      "value": 621524675
    },
    {
      "name": "AnyData",
      "value": 262171903987
    },
    {
      "name": "DSV",
      "value": 35822693
    }
  ]
}
The strip is okay, but I think it should be perfect rectangle. Here you can see it is not on the right side. On left side it's perfectly aligned.

hohnzy
on 17 Sep 2019
Hi @hohnzy can not reproduce the issue as given data. It render all blank.
<div class="row">
  <div class="twelve columns">
      <div class="widget">
        <div class="widget-header">
          <h2 class="widget-title">Tree Map Example</h2>
        </div>
        <div class="widget-content">
          <div id="treemap-chart-example" class="chart-container">
          </div>
        </div>
      </div>
  </div>
</div>

<script id="test-script">
$('body').on('initialized', function () {
  var treeMapData = {
    size: 2.6345027174E11,
    count: 428345,
    data: [
      {
        name: "Bod",
        value: 621020385
      },
      {
        name: "JSON",
        value: 621524675
      },
      {
        name: "AnyData",
        value: 262171903987
      },
      {
        name: "DSV",
        value: 35822693
      }
    ]
  };

  $('#treemap-chart-example').treemap({ dataset: treeMapData });

});
</script>
 deep7102
on 16 Jul 2020
deep7102
on 16 Jul 2020
I got it running like this....
<script>
$('body').on('initialized', function () {
  var data = {
   "name": "Total Objects",
   "children": [
      {
       "name": "type1",
       "children": [
        {"name": "Bod", "value": 621020385}
       ]
      },
      {
       "name": "type2",
       "children": [
        {"name": "JSON", "value": 621524675}
       ]
      },
      {
       "name": "type3",
       "children": [
        {"name": "AnyData", "value": 262171903987}
       ]
      },
      {
       "name": "type4",
       "children": [
        {"name": "DSV", "value": 35822693}
       ]
      }
     ]
  };

  $('#treemap-chart-example').treemap({dataset: data});
});
</script>
But that rendered something totally different.
tmcconechy
on 16 Jul 2020
any updates @hohnzy we still cant reproduce this.
tmcconechy
on 2 Sep 2020
I would like to see what it rendered then. because this dataset is rendering the exact screen ive already sent.
the code is this:
<div soho-treemap
             *ngIf="selectedChartType === overviewChartType.TREEMAP && !isLoading"
             [dataset]="chartsSettings.treemapData"
             [colors]="chartsSettings.colors"
             [redrawOnResize]="true"
             [showLabel]="false"
             [showTitle]="true"></div>
and the dataset has this model (and used the sent values):
interface TreemapDataModel {
  name: string,
  children: TreemapData[]
}

interface TreemapData {
  name: string,
  children: OverviewDataItem[]
}

export interface OverviewDataItem {
  name: string,
  value: number
}
ok, what we tried is to take the original data and massage it into this example....
<div class="row">
  <div class="twelve columns">
      <div class="widget">
        <div class="widget-header">
          <h2 class="widget-title">Tree Map Example</h2>
        </div>
        <div class="widget-content">
          <div id="treemap-chart-example" class="chart-container">
          </div>
        </div>
      </div>
  </div>
</div>

<script>
$('body').on('initialized', function () {
  var data = {
   "name": "Total Objects",
   "children": [
      {
       "name": "type1",
       "children": [
        {"name": "Bod", "value": 621020385}
       ]
      },
      {
       "name": "type2",
       "children": [
        {"name": "JSON", "value": 621524675}
       ]
      },
      {
       "name": "type3",
       "children": [
        {"name": "AnyData", "value": 262171903987}
       ]
      },
      {
       "name": "type4",
       "children": [
        {"name": "DSV", "value": 35822693}
       ]
      }
     ]
  };

  $('#treemap-chart-example').treemap({dataset: data});
});
</script>
It renders this:

Maybe you can put that example with a modal in a runable NG example file and paste it in or work on a https://stackblitz.com/
tmcconechy
on 3 Sep 2020
In ng demo app I've put the data into treemap.demo.ts:
public treemapData = {
      name: 'Storage Utilization (78 GB)',
      children: [
      {
        name: 'by type',
        children: [
        {
          name: 'type1',
          children: [
            {name: 'JSON', value: 262171903987}
          ]
        }, {
          name: 'type2',
          children: [
            {name: 'PDF', value: 621524675}
          ]
        }, {
          name: 'type3',
          children: [
            {name: 'BOD', value: 621020385}
          ]
        }, {
          name: 'type4',
          children: [
            {name: 'TXT', value: 35822693}
          ]
        }]
      }]
    };
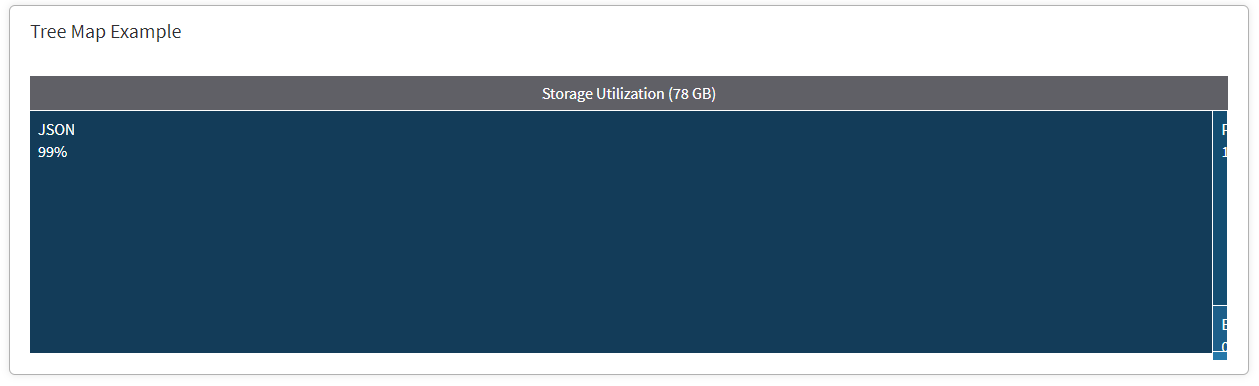
resulting in (much more visible with custom colors we are using):


hohnzy
on 15 Oct 2020
Playing a bit with the dataset and this is much more obvious
public treemapData = {
      name: 'Storage Utilization (78 GB)',
      children: [
      {
        name: 'by type',
        children: [
        {
          name: 'type1',
          children: [
            {name: 'JSON', value: 262171903987}
          ]
        }, {
          name: 'type2',
          children: [
            {name: 'PDF', value: 2621524675}
          ]
        }, {
          name: 'type3',
          children: [
            {name: 'BOD', value: 621020385}
          ]
        }, {
          name: 'type4',
          children: [
            {name: 'TXT', value: 29822693}
          ]
        }]
      }]
    };
also the labels are ugly, would be nice to have tooltips over areas
hohnzy
on 15 Oct 2020
Ok, Thanks i see the issue now with that data. By "ugly" you just mean the way its cut off right? Not so sure what we could do about that but i agree about the tooltips. I think we should add tooltips to the cells. For example
{
          name: 'type1',
          children: [
            {name: 'JSON', value: 262171903987}
          ],
          tooltip: 'test'
        }
Yes, would be great to be able to add tooltips this way!
hohnzy
on 15 Oct 2020
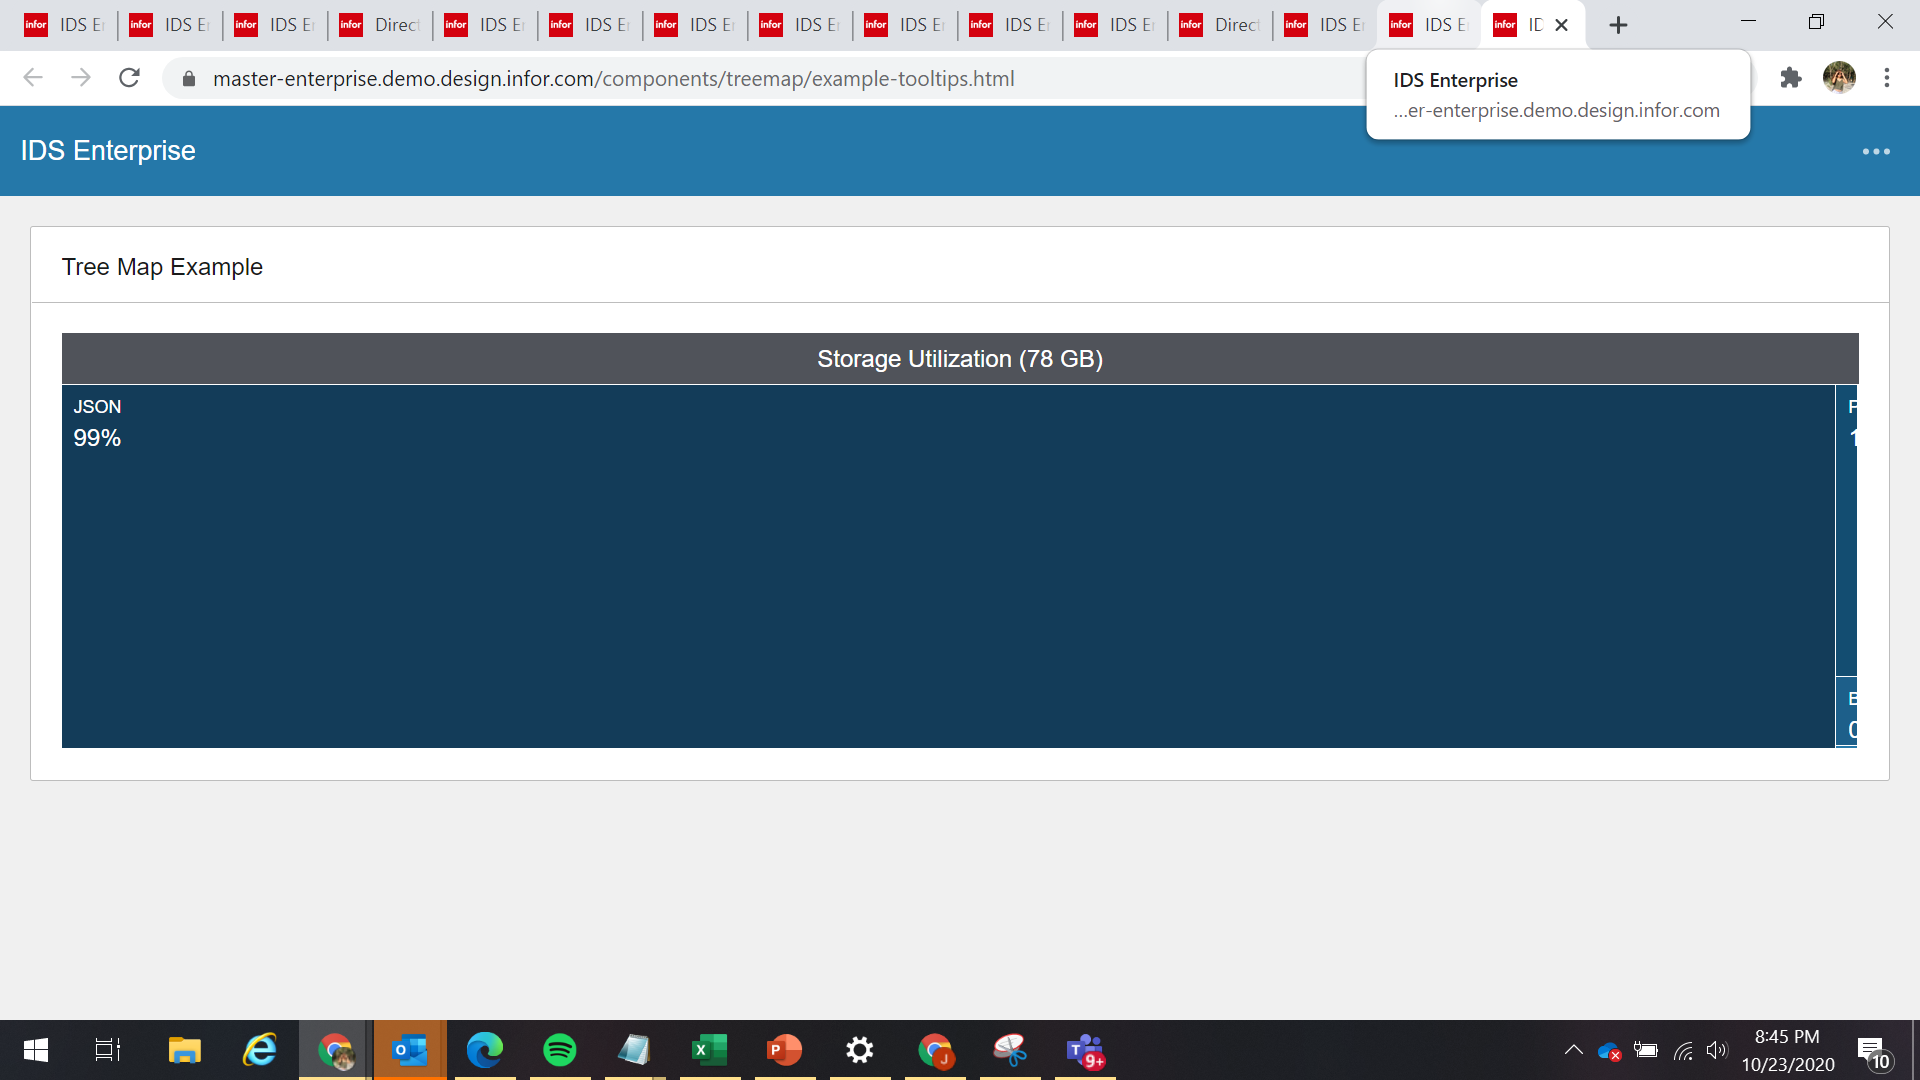
Noticed that the Label is cut off on other column. Had to confirm if this is also expected for the fix?
https://master-enterprise.demo.design.infor.com/components/treemap/example-tooltips.html
 janahintal
on 23 Oct 2020
janahintal
on 23 Oct 2020
Yes thats correct, the boxes wont fit because the slices are too small. So thats the data representation of how big it is. I added the tooltip so you can see the data that way.
tmcconechy
on 23 Oct 2020
Thanks for the clarification, Tim. Will now move this to Done :)
janahintal
on 26 Oct 2020
Related issues
 swetteinfor
·
3Comments
swetteinfor
·
3Comments
 EdwardCoyle
·
4Comments
EdwardCoyle
·
4Comments
 pwpatton
·
3Comments
pwpatton
·
3Comments
 jbrcna
·
3Comments
janahintal
·
3Comments
jbrcna
·
3Comments
janahintal
·
3Comments