Billboard.js: Question: Update Label Background
Is it possible to adjust the contents of a label outside of just adjusting the formatting?
An example would be including a background color or something of the sort to improve the label's readability.

 bryantserres
All 6 comments
Hi @serres2, I'm not clear what you're referring on label.
You mean, axis labels?
If so, you can style with the class name bb-axis-y-label, but adding background color it needs add some element(ex. <rect> element) manually to achieve that.
 netil
on 22 Aug 2018
netil
on 22 Aug 2018
@netil => I am actually referencing data labels.
Here is a larger image.
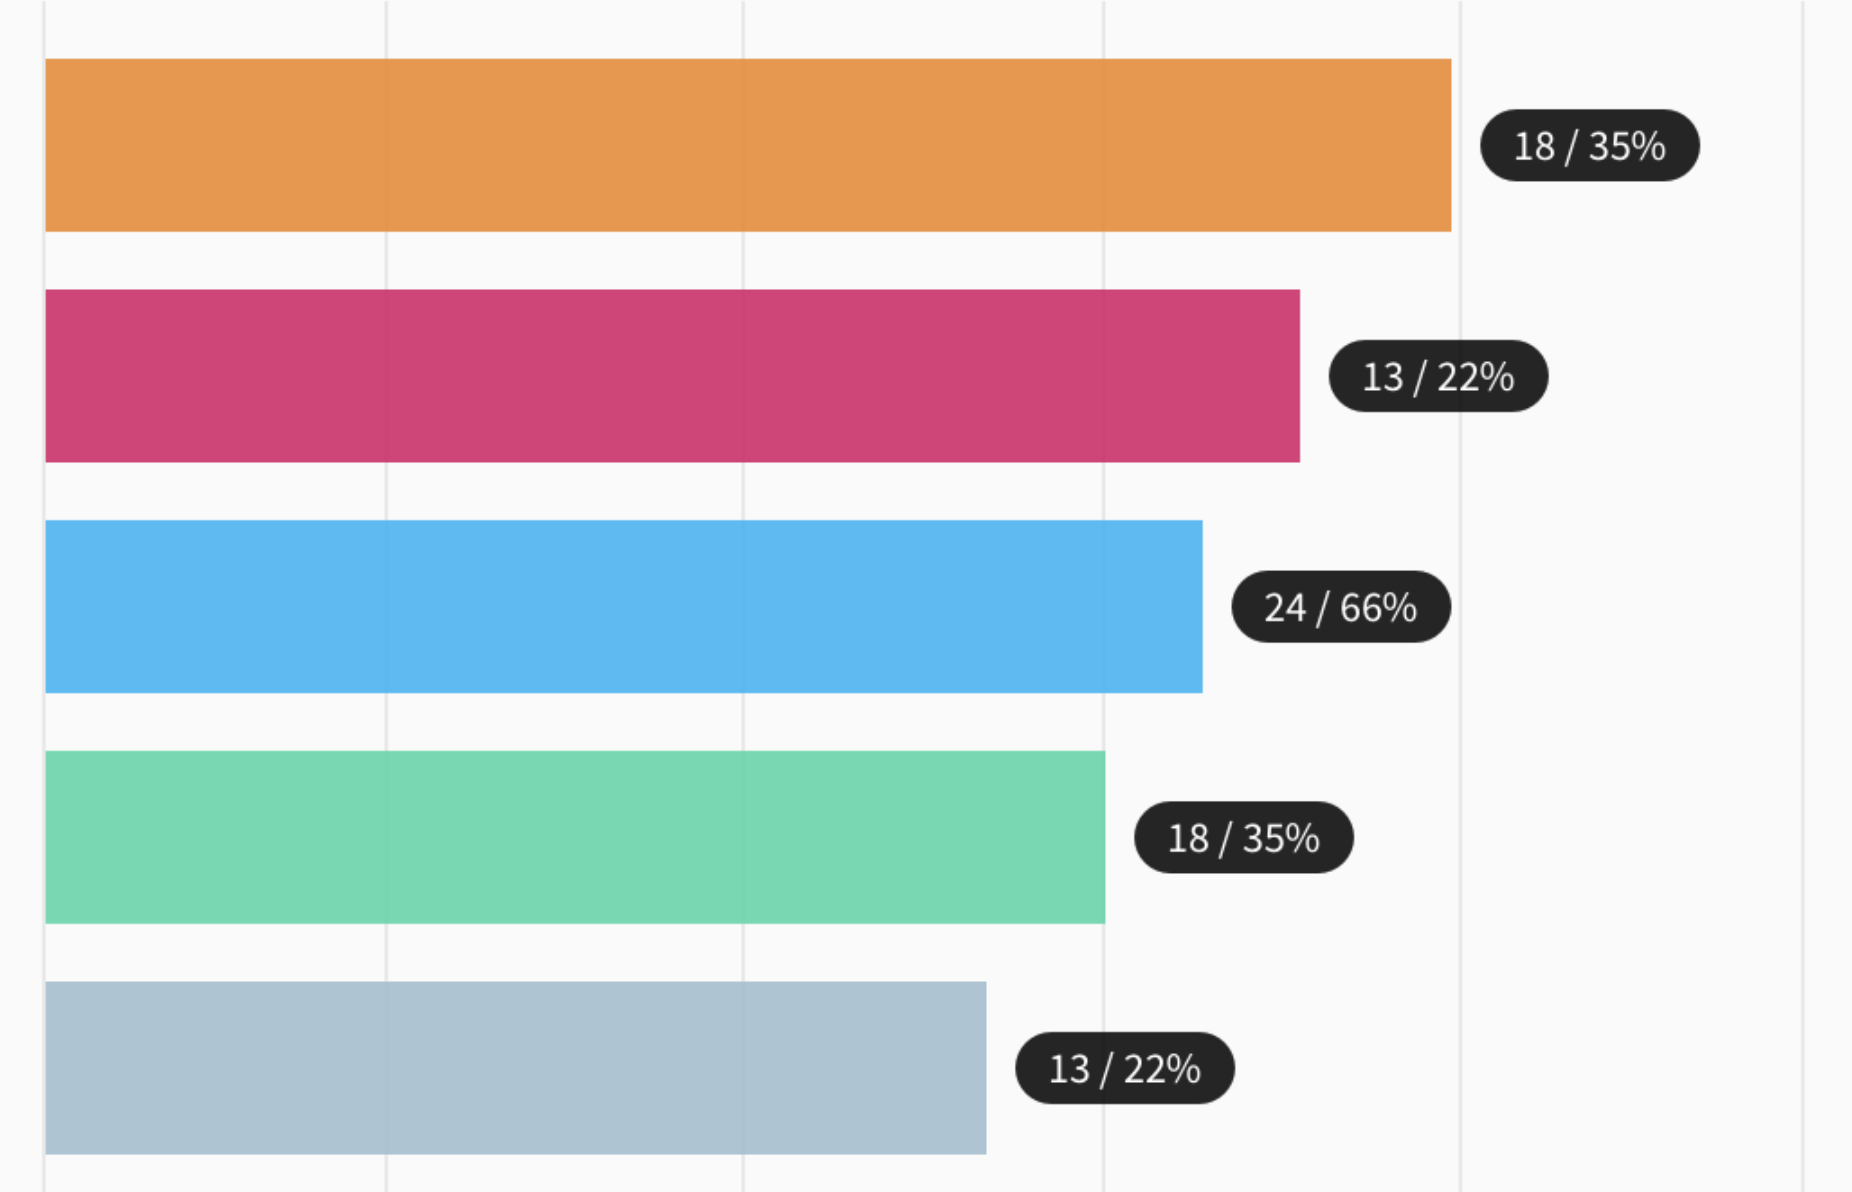
How would you suggest going about adding a <rect> element manually? Is this something that can be added via data label formatting?
bryantserres
on 22 Aug 2018
@serres2, data.labels.format option is only for formatting. You can't add some other nodes from there.
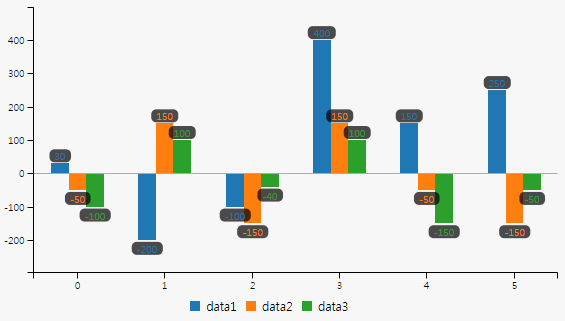
I made an example adding rounded background for data labels. Checkout the working code from the below link.
- https://jsbin.com/woretiv/edit?html,css,js,output
onrendered: function() {
        const padding = 5;

        this.main.selectAll(".bb-texts text").each(function() {
            const rect = this.getBBox();

            d3.select(this.parentNode)
            .insert("rect", "text")
            .attr("class", "bb-texts-bg")
            .attr("x", rect.x - padding)
            .attr("y", rect.y)
            .attr("rx", 5)
            .attr("ry", 5)
            .attr("width", rect.width + padding * 2)
            .attr("height", rect.height);
        });
}
netil
on 23 Aug 2018
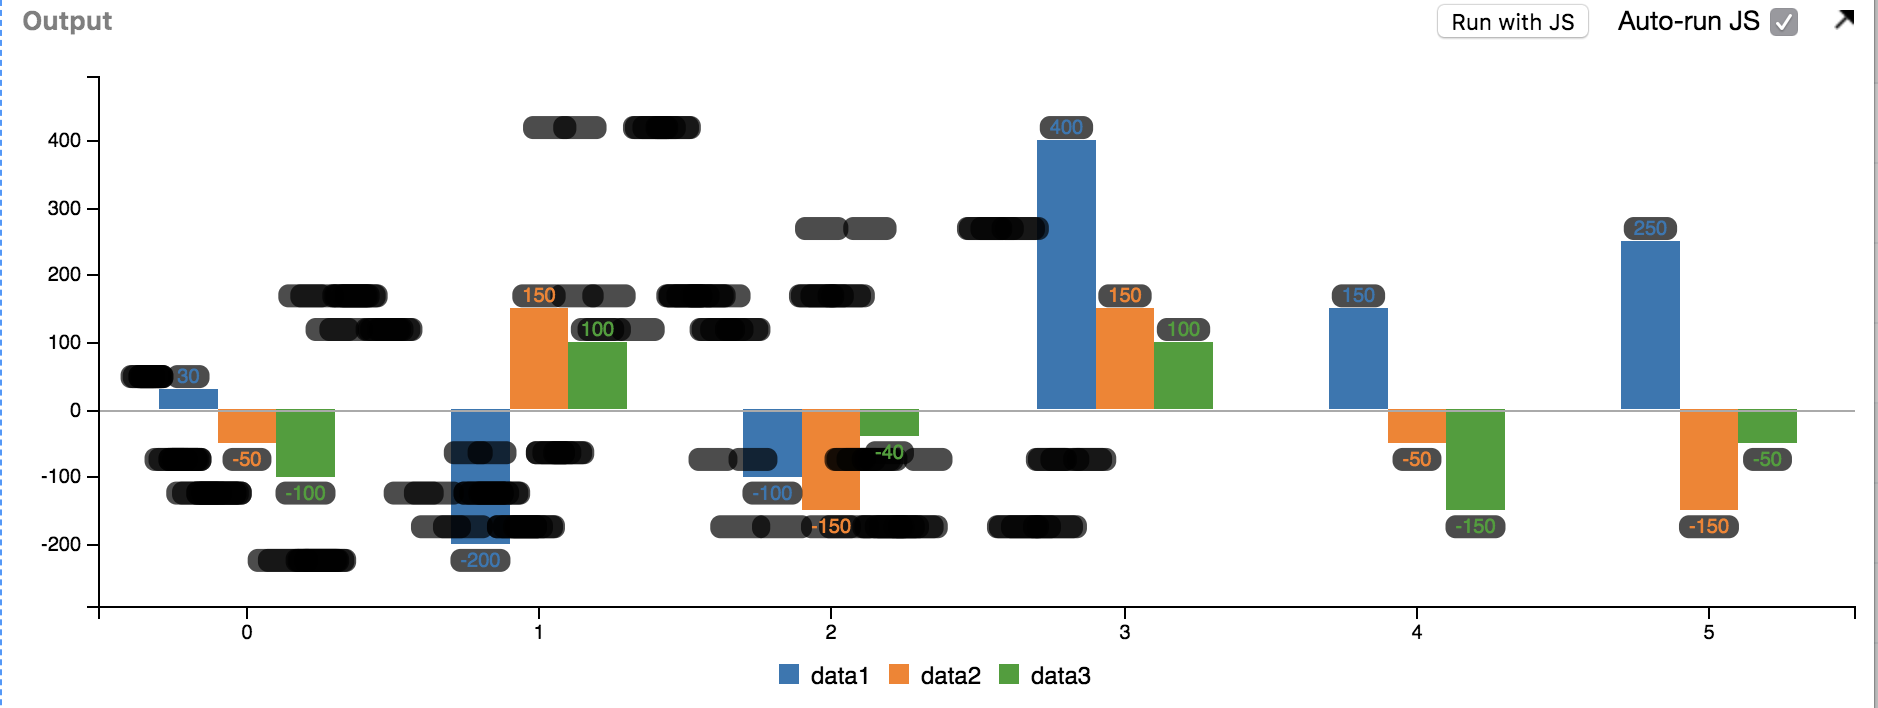
@netil => This works as expected on render, but if the screen is resized, the rectangle is drawn again on the canvas.
bryantserres
on 23 Aug 2018
@serres2, I just gave an initial idea on how to approach this.
Well, the full example code to be responsible on resizing checkout:
onrendered: function() {
    const padding = 5;

    this.main.selectAll("g.bb-texts").each(function() {
      let g = d3.select(this);
      const data = [];

      g.selectAll("text").each(function() {
        data.push(this.getBBox());
      });

      g = g.selectAll("rect").data(data);
      g.exit().remove();

      g.enter()
        .insert("rect", "text")
        .merge(g)
        .attr("class", "bb-texts-bg")
        .attr("x", d => d.x - padding)
        .attr("y", d => d.y)
        .attr("rx", 5)
        .attr("ry", 5)
        .attr("width", d => d.width + padding * 2)
        .attr("height", d => d.height);
    });
  }
@netil => AMAZING! Not only does it work, that piece of code is a great representation of how to use D3 when needing some extra control over the chart within the DOM.
bryantserres
on 23 Aug 2018
Related issues
 planttheidea
·
4Comments
planttheidea
·
4Comments
 imbyungjun
·
5Comments
imbyungjun
·
5Comments
 flipcode1973
·
5Comments
flipcode1973
·
5Comments
 gyuhyeon
·
3Comments
gyuhyeon
·
3Comments
 davidhund
·
5Comments
davidhund
·
5Comments
Most helpful comment
@netil => AMAZING! Not only does it work, that piece of code is a great representation of how to use D3 when needing some extra control over the chart within the DOM.