Billboard.js: Area covers non-area graphs
Description
When creating a graph that has two different chart types and one of them is area / area-spline, the area graph is completely opaque (and covers the other graph). It appears that area* graphs only become semi-translucent when combined with other area* graphs, however it seems appropriate for the area to be translucent when combined with other opaque graph types.
Steps to check or reproduce
Create a chart with a dataset for both bar and area graph:
const CHART_DATA = {
  columns: [['data1', 30, 200, 100, 400, 150, 250], ['data2', 130, 100, 140, 200, 150, 50]],
  types: {
    data1: 'bar',
    data2: 'area'
  }
};

bb.generate({
  data: CHART_DATA,
  bindto: '#whatever'
});
Version used: 1.1.1
 planttheidea
All 4 comments
Transparency
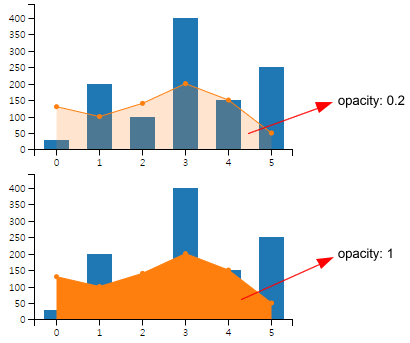
The area which appear over some data type, in this case area is displayed over bar, is reasonable have transparency to not cover bar rendering.
You can see the difference of transparency below. When has no transparency, will cover bar and it makes difficult to be recognized.
Node's position
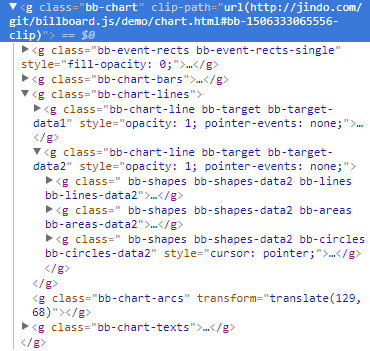
The generated node hierarchy look like in this order:
<g class="bb-chart">
    <g class="bb-chart-bars">
    <g class="bb-chart-lines">
        <g class="bb-lines">
        <g class="bb-area">
        <g class="bb-circles">
    <g class="bb-chart-arcs"> <!-- pie/donut -->
    <g class="bb-chart-texts">
There's no z-index stacking order in SVG element. They're stacked based on how nodes are positioned.
According above ordering, area will appear over bar elements. This is the reason for this behavior.
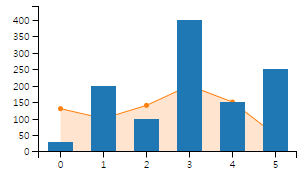
If you want area to be positioned under bar element, you need to change the node's position.
bb.generate({
    data: {
        columns: [
            ['data1', 30, 200, 100, 400, 150, 250],
            ['data2', 130, 100, 140, 200, 150, 50]
        ],
        types: {
            data2: 'area',
            data1: 'bar'
        }
    },
    oninit: function() {
        const bars = this.main.select(".bb-chart-bars").node();
        const lines = this.main.select(".bb-chart-lines").node();

        // move lines node be positioned before the bars node
        bars.parentNode.insertBefore(lines, bars);
    }
});
 netil
on 25 Sep 2017
netil
on 25 Sep 2017
Apologies for the confusion, my original comment was more about the absence of transparency which you reference at the beginning of your response than the location of the area graph, in front of vs behind. In my opinion, having a solid color for the area graph in the context described is unusual, as would any manual styling to accomplish it, since that styling is automatic in other similar contexts.
Your response to that question is a bit confusing ... Are you agreeing that transparency is the expected behavior in this scenario?
planttheidea
on 25 Sep 2017
Your question is, why area elements transparency are applied automatically in that scenario whereas it can be styled by user, right? (Correct me if I'm misunderstanding your question.)
If so, let me explain based on code.
The code where opacity prop is setting, is as below. Is taking node's opacity value from the CSS rule and re-setting it as inline style. If there's no rule, opacity will be 0.
https://github.com/naver/billboard.js/blob/412d562bc5e5c9d0e3439bd7e3736a73a6aa4028/src/internals/shape.line.js#L314-L322
This mean, if you want to change having specific transparency for area elements, just change the value from the css file.
netil
on 25 Sep 2017
@netil Thanks. That worked wonderfully...exactly what I was looking for.
 taylorchasewhite
on 17 Mar 2018
taylorchasewhite
on 17 Mar 2018
Related issues
 bogdan-iuga
·
3Comments
bogdan-iuga
·
3Comments
 flipcode1973
·
5Comments
flipcode1973
·
5Comments
 imbyungjun
·
5Comments
imbyungjun
·
5Comments
 nwpappas
·
3Comments
nwpappas
·
3Comments
 michkami
·
5Comments
michkami
·
5Comments
Most helpful comment
Transparency
The area which appear over some data type, in this case
areais displayed overbar, is reasonable have transparency to not cover bar rendering.You can see the difference of transparency below. When has no transparency, will cover

barand it makes difficult to be recognized.Node's position
The generated node hierarchy look like in this order:
There's no
z-indexstacking order in SVG element. They're stacked based on how nodes are positioned.According above ordering,
areawill appear overbarelements. This is the reason for this behavior.If you want

areato be positioned underbarelement, you need to change the node's position.