Description
For a line-chart I'd like to be able to set Y-axis tick text _inline_ on narrow screens:
The tick text would show _inside_ the line-chart as described in this article: "Inset y-axis labels on small viewports"

On narrow screens this would free up some horizontal space in the left margin of the chart.
I cannot find any config setting for this.
I could set something like:
chart.config( `axis.y.tick.text.position.x`, 20); // 20 is arbitrary :(
.. but the value (20) depends on the width of the value, and this could be anything...
Q: Is there a way to set the Y-axis text 'inline'?
 davidhund
All 5 comments
Hi @davidhund, have you ever tried axis.y.inner option?
 netil
on 7 Mar 2019
netil
on 7 Mar 2019
Hi @netil - Thank you for your quick reply.
I did look at .inner but that gave me really weird results.
It seems as though something goes wrong with the width of the SVG inner <g transform..> - This group is too wide for the SVG when I set .inner to true.

The SVG width is 307, but the inner group is 356.2...
In the screenshot below, the bottom part is what I currently have. This looks OK (but I'd like the labels inline). If I set y.inner to true I get the top view, where the inner <g> seems too wide...
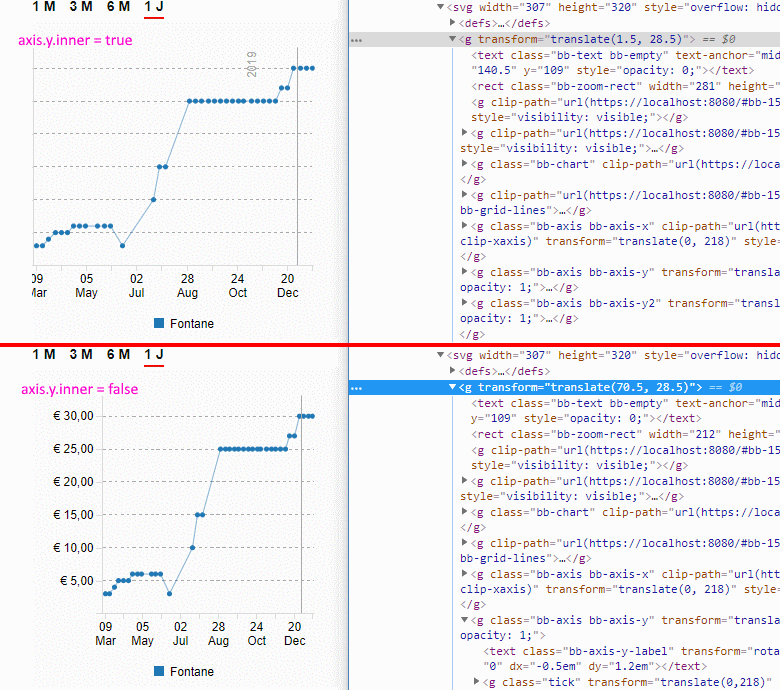
PS: I realize this setting should be used, but it is unusable because of this effect.
davidhund
on 7 Mar 2019
@davidhund, can you give full generation option to reproduce?
netil
on 8 Mar 2019
@netil - I've added a codepen: https://codepen.io/davidhund/pen/jJmLjJ
The issue is with dynamically setting the inner with chart.config
If you look at the JS pane, line 29 I can set inner to true directly _and it works_
// ..
axis: {
  y: {
    inner: true // THIS WORKS
  }
}
// ..
However: I am using chart.config after initializing the Chart (see line 68):
if(window.matchMedia(`(max-width: 55em)`).matches) {
  // ...
  chart.config(`axis.y.inner`, true); // THIS DOES NOT WORK
}
Maybe that is because I found I needed to re-draw the Chart with chart.show() after creation to have the config changes be picked up. See lines 73 - 75
// Config changes
// .. chart.config(xyz);

// RE-render (!?)
// https://github.com/naver/billboard.js/issues/500#issuecomment-406487456
chart.show();
@davidhund, I fixed axis inner style to be updated via .config() (checkout the screenshot from #802)
netil
on 11 Mar 2019
Related issues
 matthiaskomarek
·
4Comments
matthiaskomarek
·
4Comments
 SoYoung210
·
5Comments
SoYoung210
·
5Comments
 planttheidea
·
4Comments
planttheidea
·
4Comments
 serzhiio
·
4Comments
serzhiio
·
4Comments
 drazik
·
4Comments
drazik
·
4Comments