Azuredatastudio: Profiler extension missing parameterized queries from ASP.NET Core + EF Core application
Hello, and thx for a wonderful new tool. I'm trying out the Profiler extension for SQL Operations Studio because some of my colleagues use Linux for .NET Core development, and this tool could be very helpful.
I outlined in an answer on Stack Overflow a way to use the Profiler for a very basic ASP.NET Core 2.1 + EF Core + Sql Server (docker or localdb), and got it to work nicely.
Now I'm trying to hook up to my actual ASP.NET Core 2.1.0 (with EF Core 2.1.0) application, but the important statements aren't showing. I'm using Postman to hit my API with a simple GET of one value, but my profiler window only shows EventClass
lougoutrpc_completedtwicelogin
all from the "Core .Net SqlClient Data Provider". However, I was also expecting sql_batch_starting and sql_batch_completed or similar, with some SELECT queries. In fact, that's the only events I'm after at the moment.
Some additional info:
- If (on my Windows machine) I use SQL Server 2016 Profiler to do the same trace, then I do see
RPC:Completedevents withexec sp_executesql N'SELECT TOP(1)...events containing my query. - If (on my Windows machine) I use SSMS 2016 to drill into Management > Extended Events > Sessions > Profiler > package0.ring_buffer (which I _guess_ is related?), then click to the XML, I do see a
<data name="statement">element with that sameSELECT. It is contained in arpc_completedevent with a timestamp similar to the events that the Profiler in OpsStudio showed.
Surely the missing events are particular to my ASP.NET Core Web API application, but I can't seem to find any relevant setting for this. I also am at a loss how to debug this further to provide you with a concise repro.
I would love to provide such a concise repro, but perhaps someone can point me in a good research direction?
Edit: see repro below.
 jeroenheijmans
All 15 comments
It sounds like the app is sending over dynamic sql via exec sp_executesql, which is why you get rpc_completed but not sql_batch* events. See https://dba.stackexchange.com/questions/34484/difference-between-sql-batch-statement-and-rpc
 shueybubbles
on 5 Aug 2018
shueybubbles
on 5 Aug 2018
@shueybubbles Yes, of course, why didn't I think of that!? Thank you for your insight.
This means the repro is actually pretty simple. Just create a scaffolded ASP.NET Core 2.1 API as per this Stack Overflow post but change the API method to this:
[HttpGet]
public ActionResult<IEnumerable<Item>> Get(string q)
{
    return _context.Items
        .Where(i => i.Name.Contains(q))
        .ToList();
}
Then run it and (regardless whether q contains data) you will not see anything anymore in SQL Operations Studio (where the old Sql Profiler _would_ show those RPC calls with query data). You will see something like this:
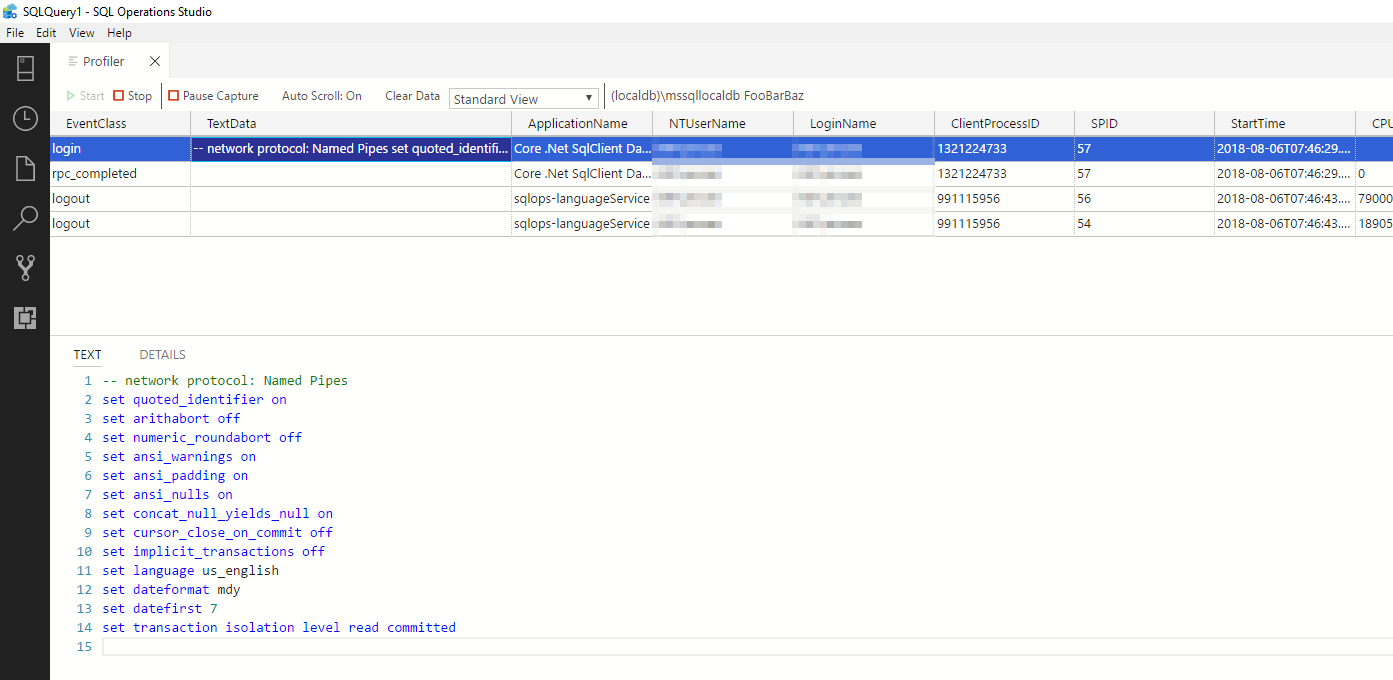
Expected resullt was to see the dynamic sql generated by EF Core, similar to the old SQL Profiler tool.
jeroenheijmans
on 6 Aug 2018
To clarify - you are saying that for this same event stream generated by the same application, SQL Profiler shows the TextData in the rpc_completed trace event as non-empty, but SQL Ops Studio does not? And that the ring buffer target data as viewed by SSMS also shows the data?
Sent from Mailhttps://go.microsoft.com/fwlink/?LinkId=550986 for Windows 10
From: Jeroen Heijmans notifications@github.com
Sent: Monday, August 6, 2018 3:48:22 AM
To: Microsoft/sqlopsstudio
Cc: David Shiflet; Mention
Subject: Re: [Microsoft/sqlopsstudio] Profiler extension missing SELECT queries from ASP.NET Core + EF Core application (#2125)
@shueybubbleshttps://eur03.safelinks.protection.outlook.com/?url=https%3A%2F%2Fgithub.com%2Fshueybubbles&data=02%7C01%7C%7C8cc322dbc82c4bf9ed0e08d5fb70fc85%7C84df9e7fe9f640afb435aaaaaaaaaaaa%7C1%7C0%7C636691385041937374&sdata=T7qUSAxCSgU4JxjSCCHHaPlk%2F92sk8PKvVzPFz7QaoA%3D&reserved=0 Yes, of course, why didn't I think of that!? Thank you for your insight.
This means the repro is actually pretty simple. Just create a scaffolded ASP.NET Core 2.1 API as per this Stack Overflow posthttps://eur03.safelinks.protection.outlook.com/?url=https%3A%2F%2Fstackoverflow.com%2Fa%2F51652775%2F419956&data=02%7C01%7C%7C8cc322dbc82c4bf9ed0e08d5fb70fc85%7C84df9e7fe9f640afb435aaaaaaaaaaaa%7C1%7C0%7C636691385041937374&sdata=JKoiyUwXxO%2FwgLl5YZQqrqri%2FzkN3z7FtwJjN2PZKy4%3D&reserved=0 but change the API method to this:
[HttpGet]
public ActionResult
{
return _context.Items
.Where(i => i.Name.Contains(q))
.ToList();
}
Then run it and (regardless whether q contains data) you will not see anything anymore in SQL Operations Studio (where the old Sql Profiler would show those RPC calls with query data). You will see something like this:
Expected resullt was to see the dynamic sql generated by EF Core, similar to the old SQL Profiler tool.
—
You are receiving this because you were mentioned.
Reply to this email directly, view it on GitHubhttps://eur03.safelinks.protection.outlook.com/?url=https%3A%2F%2Fgithub.com%2FMicrosoft%2Fsqlopsstudio%2Fissues%2F2125%23issuecomment-410618705&data=02%7C01%7C%7C8cc322dbc82c4bf9ed0e08d5fb70fc85%7C84df9e7fe9f640afb435aaaaaaaaaaaa%7C1%7C0%7C636691385041937374&sdata=oIGKx4JjIA%2FtwOGokf40YPujqEiZLUV8CR2fKSu0g8E%3D&reserved=0, or mute the threadhttps://eur03.safelinks.protection.outlook.com/?url=https%3A%2F%2Fgithub.com%2Fnotifications%2Funsubscribe-auth%2FACHzCo5Dc9I1jVB6X-3jUD9xR4jEnqwsks5uN_TGgaJpZM4VsMhm&data=02%7C01%7C%7C8cc322dbc82c4bf9ed0e08d5fb70fc85%7C84df9e7fe9f640afb435aaaaaaaaaaaa%7C1%7C0%7C636691385041937374&sdata=MznvrOy2wPOqiKuUAm9tVSJu5XZYKSKq8DwcJ21JfO4%3D&reserved=0.
shueybubbles
on 6 Aug 2018
@shueybubbles Aye, that is correct.
Here's a screenshot of what SQL Server Profiler 2016 gives me for the exact same API call:

And here is a screenshot of what I see in SSMS 2016 if I go to the ring buffer when I have just run the SQL Operations Studio Profiler trace for that query (the oldskool SQL Server Profiler was _off_ during this screenshot):

Let me know if you require any other details, or if you need extra help in reproducing the issue.
jeroenheijmans
on 6 Aug 2018
ok somewhere is a template that maps event fields like "statement" to view fields like "TextData". I will try to learn this part of the app to find a solution.
Get Outlook for Androidhttps://aka.ms/ghei36
From: Jeroen Heijmans notifications@github.com
Sent: Monday, August 6, 2018 8:21:38 AM
To: Microsoft/sqlopsstudio
Cc: David Shiflet; Mention
Subject: Re: [Microsoft/sqlopsstudio] Profiler extension missing parameterized queries from ASP.NET Core + EF Core application (#2125)
@shueybubbleshttps://nam03.safelinks.protection.outlook.com/?url=https%3A%2F%2Fgithub.com%2Fshueybubbles&data=02%7C01%7C%7C84719cd908234a421a4608d5fb972971%7C84df9e7fe9f640afb435aaaaaaaaaaaa%7C1%7C0%7C636691549001313100&sdata=tOR3utoxqhEK9oIzzozdggqyRd48LfMXOyzV2qSnlJQ%3D&reserved=0 Aye, that is correct.
Here's a screenshot of what SQL Server Profiler 2016 gives me for the exact same API call:
And here is a screenshot of what I see in SSMS 2016 if I go to the ring buffer when I have just run the SQL Operations Studio Profiler trace for that query (the oldskool SQL Server Profiler was off during this screenshot):
Let me know if you require any other details, or if you need extra help in reproducing the issue.
—
You are receiving this because you were mentioned.
Reply to this email directly, view it on GitHubhttps://nam03.safelinks.protection.outlook.com/?url=https%3A%2F%2Fgithub.com%2FMicrosoft%2Fsqlopsstudio%2Fissues%2F2125%23issuecomment-410689362&data=02%7C01%7C%7C84719cd908234a421a4608d5fb972971%7C84df9e7fe9f640afb435aaaaaaaaaaaa%7C1%7C0%7C636691549001313100&sdata=skP40ZZFwYYJoBYUDscWuJHHtukT9nfVd7rlvseyBb8%3D&reserved=0, or mute the threadhttps://nam03.safelinks.protection.outlook.com/?url=https%3A%2F%2Fgithub.com%2Fnotifications%2Funsubscribe-auth%2FACHzCpO2zRceG8aF14i_AZMpgFg0Yt0xks5uODTSgaJpZM4VsMhm&data=02%7C01%7C%7C84719cd908234a421a4608d5fb972971%7C84df9e7fe9f640afb435aaaaaaaaaaaa%7C1%7C0%7C636691549001313100&sdata=zMVGeUSG7QhhbMH5hVPo5Dk3h3ZxZ0fhlj8W0QMuK2E%3D&reserved=0.
shueybubbles
on 6 Aug 2018
I think if you edit resources\app\out\vs\workbench\workbench.main.js you can add "statement" to this mapping:
var profilerViewTemplateSchema = {
description: nls.localize(0, null),
type: 'array',
items: {
type: 'object',
properties: {
name: {
type: 'string'
}
}
},
default: [
{
name: 'Standard View',
columns: [
{
name: 'EventClass',
eventsMapped: ['name']
},
{
name: 'TextData',
eventsMapped: ['options_text', 'batch_text']
},
I have to run to an appointment and can try it out later today
shueybubbles
on 6 Aug 2018
I can confirm that the suggestion seems to do the trick. See:

On a side note, doing this for a production install (as I have) you do get a:
Your sqlops installation appears to be corrupt. Please reinstall.
popup. (Which makes sense since I "corrupted" the file by editing it.)
jeroenheijmans
on 7 Aug 2018
Will the fix make it to a released version?
Additionally, it would be good to be able to filter events as in SQL Server Profiler (from SSMS) so that we can filter on the database name for instance.
 qbodart
on 29 Aug 2018
qbodart
on 29 Aug 2018
Thanks for the fix, it works here too. Hope it makes it to the release.
 vmary2014
on 4 Sep 2018
vmary2014
on 4 Sep 2018
Please I am not clear how to implement this fix
 DevFojo
on 27 Sep 2018
DevFojo
on 27 Sep 2018
@vmary2014 @MrFojo I think this is already in the release, are you still having the same issue with the latest release?
 alanrenmsft
on 8 Nov 2018
alanrenmsft
on 8 Nov 2018
Please reactivate if you are still seeing the issue.
alanrenmsft
on 8 Nov 2018
@qbodart I didn't ignore your suggestion of the filtering feature, it is being tracked here: https://github.com/Microsoft/azuredatastudio/issues/2030
alanrenmsft
on 8 Nov 2018
Steel doesn't show RPC query in the last version.
 PejmanNik
on 9 Nov 2018
PejmanNik
on 9 Nov 2018
@PejmanNik Please try the latest insiders build: https://github.com/Microsoft/azuredatastudio/releases/tag/1.3.4 and the version 0.5.1 of Profiler extension.
alanrenmsft
on 28 Nov 2018
Related issues
 haydnlj
·
3Comments
haydnlj
·
3Comments
 erickangMSFT
·
3Comments
erickangMSFT
·
3Comments
 mayurrumal1
·
3Comments
mayurrumal1
·
3Comments
 RobLW
·
3Comments
RobLW
·
3Comments
 Ungerfall
·
3Comments
Ungerfall
·
3Comments
Most helpful comment
I can confirm that the suggestion seems to do the trick. See:
On a side note, doing this for a production install (as I have) you do get a:
popup. (Which makes sense since I "corrupted" the file by editing it.)