Apexcharts.js: Feature Request: Radial bar Charts to support annotations
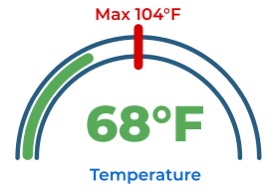
I am creating a temperature chart for a system that has a maximum ambient temperature that can not survive above. To indicate this maximum value, I was hoping to add a small line on the radial chart to indicate this maximum ambient temperature to users on a dashboard.
 fmahmoo3
👍2
All 7 comments
Can you please re-upload the image of how it should look?
 junedchhipa
on 4 Feb 2020
junedchhipa
on 4 Feb 2020
fmahmoo3
on 5 Feb 2020
👍1
Is that supported now ? I don't find it in the docs
 laurent-brisbois
on 11 Aug 2020
laurent-brisbois
on 11 Aug 2020
👍3
@junedchhipa Hello.
Any news about this ?
In my opinion it is necessary to have this option to this kind of graph.
laurent-brisbois
on 9 Dec 2020
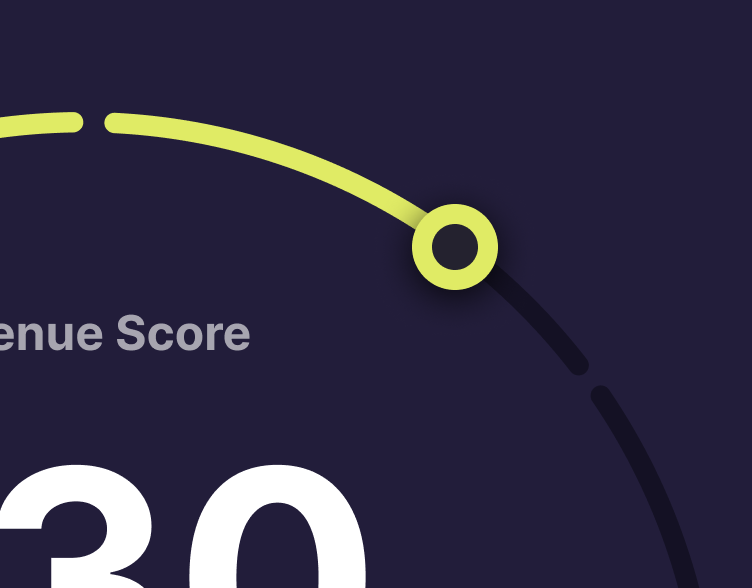
In my case I need to add a custom image to the end of the stroke
 width="200" />
Any ideas on how to do it?
 asumaran
on 18 Dec 2020
asumaran
on 18 Dec 2020
This would be awesome for us as well.
 michaeldever
on 21 Mar 2021
michaeldever
on 21 Mar 2021
How is it going ? It's been more than a year now.
Just asking.
laurent-brisbois
on 6 Apr 2021
Was this page helpful?
0 / 5 - 0 ratings
Related issues
 LucaCorcella
·
14Comments
LucaCorcella
·
14Comments
 Vvelghe
·
15Comments
Vvelghe
·
15Comments
 dougnewnham
·
18Comments
dougnewnham
·
18Comments
 jsinhSolanki
·
23Comments
jsinhSolanki
·
23Comments
 tforssander
·
24Comments
tforssander
·
24Comments
Most helpful comment
Is that supported now ? I don't find it in the docs