Apexcharts.js: Data Labels missing on stacked column charts with negative values
Codesandbox
Here's a link showing the issue: https://codesandbox.io/s/react-basic-example-8zrui. The example uses react, but I was able to observe the issue in Vue as well.
Explanation
_- What is the behavior you expect?_
I expected dataLabels to be visible on the negative columns
_- What is happening instead?_
There are no dataLabels visible on the negative columns
_- What error message are you getting?_
No error message
 jhadenfeldt
All 8 comments
+1
 astronati
on 2 Jan 2020
astronati
on 2 Jan 2020
Can you please provide a minimal example? The provided example doesn't have any negative values.
 junedchhipa
on 5 Jan 2020
junedchhipa
on 5 Jan 2020

This is an example.
Pink bar contains negative values.
astronati
on 5 Jan 2020
Please provide a working codepen
junedchhipa
on 5 Jan 2020
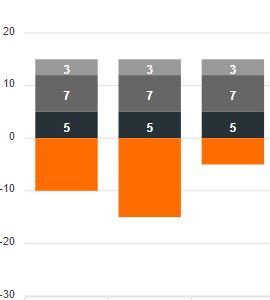
Here is one: https://codepen.io/fengtan/pen/mdypRmd
It looks like datalabels are missing only if all values of the series are negative. In the example above the values are [-10, -10], but if I change that to [-10, 10] then they all show up: https://codepen.io/fengtan/pen/QWwadgp
 fengtan
on 6 Jan 2020
fengtan
on 6 Jan 2020
Thank you for the demo, will be addressed soon.
junedchhipa
on 6 Jan 2020
Hi @junedchhipa, This issue still occurs in the current version, there are no labels on negative values. I am using version 3.23.1 from https://cdn.jsdelivr.net/npm/apexcharts
Here is a screenshot
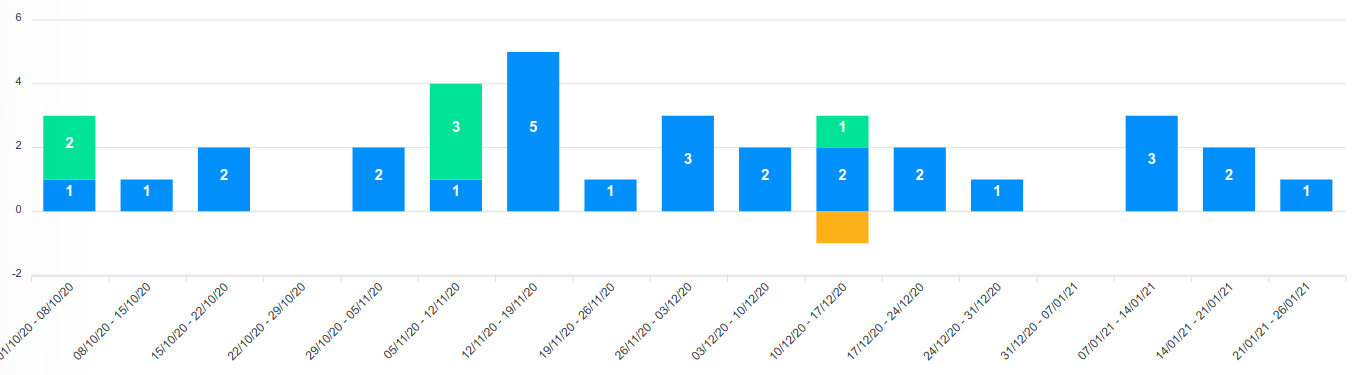
here is an example with Codepen
https://codepen.io/alexxbetancourt/pen/VwKorOd
 alexxbetancourt
on 26 Jan 2021
alexxbetancourt
on 26 Jan 2021
Hi @junedchhipa I have the same problem as @alexxbetancourt, plz tell me if there is any solution
UPD. this is solution
plotOptions: {
    bar: {
        dataLabels: {
            hideOverflowingLabels: false
        }
    }
}
 Jarkovato
on 2 Apr 2021
Jarkovato
on 2 Apr 2021
Related issues
 stalnikar
·
13Comments
stalnikar
·
13Comments
 astone2014
·
15Comments
astone2014
·
15Comments
 Epithumia
·
17Comments
Epithumia
·
17Comments
 RyanMooreOPS
·
16Comments
RyanMooreOPS
·
16Comments
 tforssander
·
24Comments
tforssander
·
24Comments
Most helpful comment
Thank you for the demo, will be addressed soon.