Apexcharts.js: Stacked Bar Charts overlapping instead of stacking
Codepen
https://codesandbox.io/embed/react-basic-example-6807o

Explanation
- What is the behavior you expect?
Bars should stack on top of one another. - What is happening instead?
Bars are overlapping one another
 jowen19o
All 10 comments
I've recently upgraded from 3.6.10 to 3.8.6 and have noticed this too. I'm not sure what changed in between versions, but i will try to see what version works again.
edit. Looks like it was there in 3.6.11 too. I actually switched from using categories and series array of data to solely relying on a series of datetime data objects, ie, {x:'string date value', ,yL 1234} . has this ever worked with datetimes?
 stevebor1
on 29 Sep 2019
stevebor1
on 29 Sep 2019
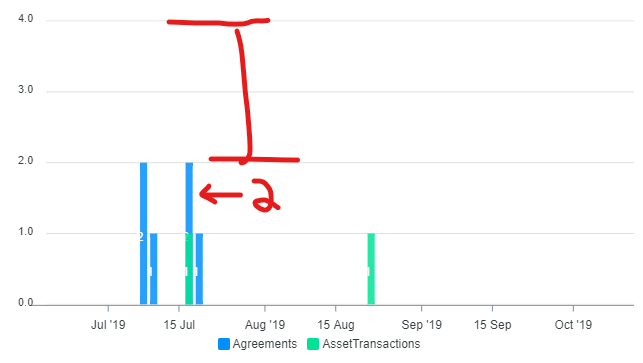
Here is a minimalistic version of the datatime and data x,y demo where stacked bar charts are not working and are overlapped, instead of being stacked.
https://codepen.io/stevebor1/pen/xxKNXVZ
In this chart, the blue and green should be stacked. The blue has a value of 2, and the green is a value of 1. Overall chart y axis is 4, which is correct, but the bars are both starting from 0.
stevebor1
on 29 Sep 2019
It appears that this happens when you have multiple series with data points where not all other series has data on the same date.
Is it possible that this gets fixed so that you are not required to fill the series with dummy data so that the chart works correctly?
stevebor1
on 29 Sep 2019
It appears that this happens when you have multiple series with data points where not all other series has data on the same date.
Very interesting discovery. Thank you for sharing!
 duckyb
on 6 Mar 2020
duckyb
on 6 Mar 2020
Also encountering this issue, and when I try to revert to 3.8.6 i get even weirder patterns (columns going SUPER WIDE and overlapping horizontally as well as vertically and being completely unusable). What's the chance of getting a fix for this?
 cpalmerbright
on 12 Mar 2020
cpalmerbright
on 12 Mar 2020
I got the same issue as well
 RyonMB
on 1 Jul 2020
RyonMB
on 1 Jul 2020
A workaround for the initial issue (not sure what's going on with wide columns or area graphs) is to add data pairs of the x value that is missing and a 0. For example if series A has 5 data points, and series B only has 3 of the these 5, and you are experiencing issues, add the 2 missing but with values of 0.
And if that still is not working, make sure to sort all dates in order from oldest to newest.
 IanConceicao
on 31 Jul 2020
IanConceicao
on 31 Jul 2020
A ruby snippet for filling missing [year,week] data.
 def generate_missing_week_data(h,from_date,to_date)
  from_date = Date.parse(from_date) if from_date.class.name == 'String'
  to_date = Date.parse(to_date) if to_date.class.name == 'String'
    (from_date..to_date).step(7)do |v|
    year = v.strftime('%Y').to_i
    week = v.strftime('%W').to_i + 1
    h.merge!({[year,week]=>0}) unless h.has_key?([year,week])
  end
  return h.sort_by{ |k,_| (k[0].to_s+k[1].to_s.rjust(2, '0')).to_i }.to_h
end
 andriesfilmer
on 16 Oct 2020
andriesfilmer
on 16 Oct 2020
It seems like another work around is adding horizontal: true to the bar chart plot options.
 jpaav
on 23 Feb 2021
jpaav
on 23 Feb 2021
Issue still exists in 3.25.0
 RasAlhague
on 13 Mar 2021
RasAlhague
on 13 Mar 2021
Related issues
 steebchen
·
20Comments
steebchen
·
20Comments
 dougnewnham
·
18Comments
dougnewnham
·
18Comments
 astone2014
·
15Comments
astone2014
·
15Comments
 filipinyo
·
14Comments
filipinyo
·
14Comments
 jsinhSolanki
·
23Comments
jsinhSolanki
·
23Comments
Most helpful comment
Issue still exists in 3.25.0