Apexcharts.js: Missing first X-Axis label
Codepen
https://codepen.io/MACscr/pen/JVYvBN
Explanation
Im not getting any errors, but cant figure out why my first date of March 26th isnt showing in the X axis. Data is plotted though.
I expect Mar 26 to show at the bottom just like the 27th is and every day after.
 MACscr
All 10 comments
Fixed in v3.12.0
 junedchhipa
on 2 Jan 2020
junedchhipa
on 2 Jan 2020
I am using [email protected] and [email protected]. This problem still exists.
 Khangng7
on 20 Apr 2020
Khangng7
on 20 Apr 2020
I am using "apexcharts": "^3.17.0", still the problem exists. Please re open the issue. It might increase changes to get it fixed by someone.

I am not able to see the first label. It's the same case with all types of graphs.
 rajeshwarpatlolla
on 23 May 2020
rajeshwarpatlolla
on 23 May 2020
All the working example conveniently have the 1st January as the first category - this is then displayed as "Jan '11" - I suspect the missing first label is caused if the 1st of the month is not one of the labels so it cannot put in year label anywhere ...
 jaydublu2002
on 29 May 2020
jaydublu2002
on 29 May 2020
Also happening to me still , [email protected], [email protected]

 joykliu
on 28 Jul 2020
joykliu
on 28 Jul 2020
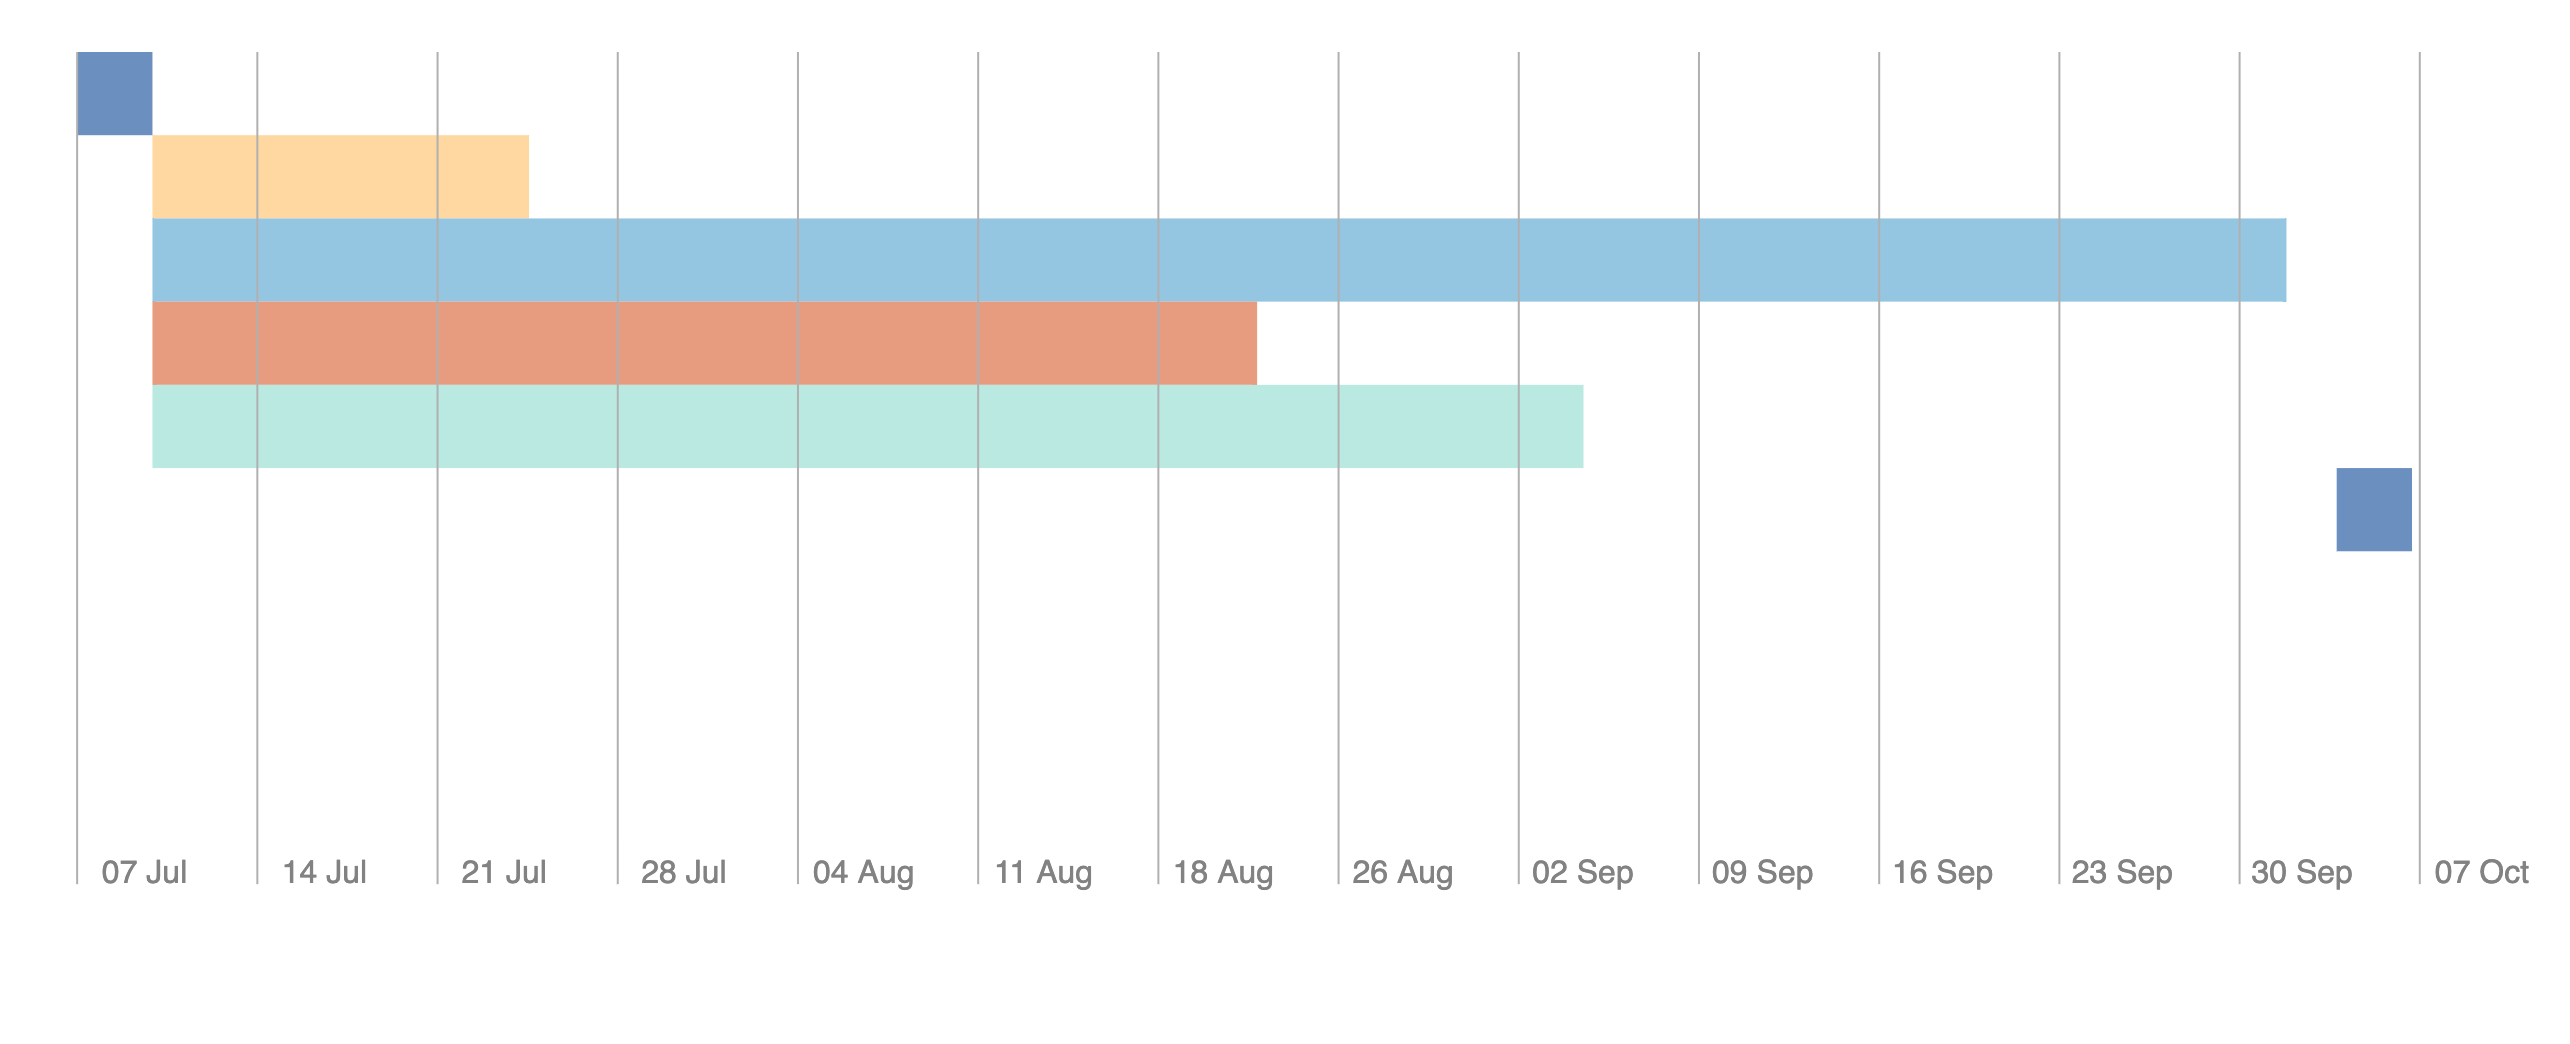
Update ^^
I set an offset for the labels now the first label is showing up
xaxis options:
  xaxis: {
    type: "numeric",
    min: new Date("2020-07-07T00:00:00").getTime(),
    tickAmount: 13,
    labels: {
      formatter: (value: number) => moment(value).format("DD MMM"),
      offsetX: -35,
      offsetY: -10,
      style: {
        fontSize: "16px",
        colors: "#828282",
        fontFamily: "Calibri Regular",
        fontWeight: 400,
        cssClass: "apexcharts-xaxis-label"
      }
    },
    axisBorder: {
      show: false
    },
    axisTicks: {
      show: false
    }
  },
Rendering:
joykliu
on 28 Jul 2020
What if the label size is big. There has to be an option to automatically show the first label like every other graph libraries has.
rajeshwarpatlolla
on 28 Jul 2020
FYI: Changing the formatter helped im my case
 MichalWi
on 16 Dec 2020
MichalWi
on 16 Dec 2020
Adding below formatter property in labels object of xaxis worked for me.
formatter: function(value, dateObj) {
  return moment(dateObj).format("ddd MM");
}
Weird! but worked for me.
 Basir-PD
on 7 Feb 2021
Basir-PD
on 7 Feb 2021
This issue is not happening (in my case) when Y axis labels are present, so you can apply a very ugly workaround and define y axis labels but then add css class:
yaxis.labels.cssClass: 'hidden'.
.hidden { display: hidden}
MichalWi
on 3 Apr 2021
Related issues
 LucaCorcella
·
14Comments
LucaCorcella
·
14Comments
 taheri24
·
19Comments
taheri24
·
19Comments
 dougnewnham
·
18Comments
dougnewnham
·
18Comments
 Bilge
·
15Comments
Bilge
·
15Comments
 astone2014
·
15Comments
astone2014
·
15Comments