Altair: Custom ordering categorical grouped bar chart
I have the following Altair code
ordering = df['xval'].values
df = df.melt('xval', var_name='group', value_name='value')
df['xval'] = pd.Categorical(df['xval'], categories=ordering, ordered=True)
df.sort_values(by='xval',inplace=True)
chart = alt.Chart(df).mark_bar().encode(
    x=alt.X('group:O', axis=alt.Axis(title=None, labels=False, ticks=False)),
    y=alt.Y('value:Q', axis=alt.Axis(grid=False)),
    color='group',
    column=alt.Column('xval:N', header=alt.Header(title=None, labelOrient='bottom'))
    ).configure_view(
        stroke='transparent'
)
which produces the following output

This is great except for the ordering of the xaxis. I have tried passing various things to the sorting keyword in both the alt.X(...) and the alt.Column(...), in particular passing the python list of the sorted values as well as None as it was suggested elsewhere this would cause it to default to the dataframe ordering, though neither seem to work.
This is what the melted df looks like

and this is the correct ordering.
If I get the Vega-Lite json and just put in
"sort":[1, "2-3","4-5","6-10","11+"],
for the xval definition it works great, how do i go about doing this via Altair? If I pass the ordering list directly to the alt.Column(sort=ordering...) I get
ValueError: The truth value of an array with more than one element is ambiguous. Use a.any() or a.all()
 Zylatis
All 2 comments
You can specify the order of the columns by passing a list of values to the sort parameter. For example:
import altair as alt
import pandas as pd

df = pd.DataFrame({
    'xval': ["1", "1", "2-3", "2-3", "4-5", "4-5", "6-10", "6-10", "11+", "11+"],
    'group': [1, 2, 1, 2, 1, 2, 1, 2, 1, 2],
    "value": [5000, 8000, 500, 3000, 100, 1000, 60, 800, 30, 300]
})

alt.Chart(df).mark_bar().encode(
  x=alt.X('group:O', axis=alt.Axis(title=None, labels=False, ticks=False)),
  y=alt.Y('value:Q', axis=alt.Axis(grid=False)),
  color='group:N',
  column=alt.Column(
    'xval:N',
    sort=["1", "2-3", "4-5", "6-10", "11+"],
    header=alt.Header(title=None, labelOrient='bottom')
  )
).configure_view(
  stroke='transparent'
)
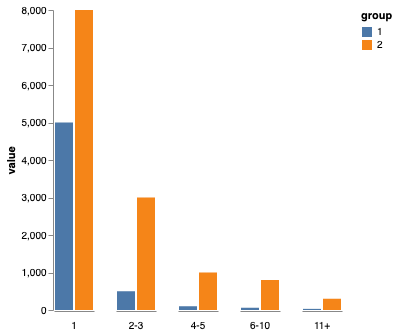
Without more information about the input dataframe you're using, I can't tell you what exactly will work in your case. But hopefully the above example is enough for you to figure it out.
 jakevdp
on 2 Dec 2019
jakevdp
on 2 Dec 2019
Perfect, thanks! Guess I had put it in the wrong spot when I tried.
Zylatis
on 5 Dec 2019
Related issues
 mroswell
·
54Comments
mroswell
·
54Comments
 Znafon
·
23Comments
Znafon
·
23Comments
 choldgraf
·
20Comments
mroswell
·
21Comments
choldgraf
·
20Comments
mroswell
·
21Comments
 dyuval
·
34Comments
dyuval
·
34Comments
Most helpful comment
You can specify the order of the columns by passing a list of values to the
sortparameter. For example:Without more information about the input dataframe you're using, I can't tell you what exactly will work in your case. But hopefully the above example is enough for you to figure it out.