Altair: Setting the size of mark_rect
My question is regarding setting the size (width and height) of each of the cells in mark_rect(). How can we do that such that the size is fixed, and the overall heatmap just gets bigger if we have more boxes to show?
 ilyasustun
All 7 comments
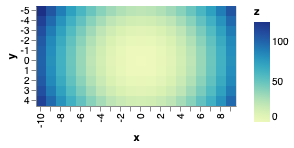
You can do that with the rangeStep scale setting. Here's an example of setting it globally to 10 pixels:
import altair as alt
import numpy as np
import pandas as pd
# Compute x^2 + y^2 across a 2D grid
x, y = np.meshgrid(range(-10, 10), range(-5, 5))
z = x ** 2 + y ** 2
# Convert this grid to columnar data expected by Altair
source = pd.DataFrame({'x': x.ravel(),
'y': y.ravel(),
'z': z.ravel()})
alt.Chart(source).mark_rect(size=5).encode(
x='x:O',
y='y:O',
color='z:Q'
).configure_scale(
rangeStep=10
)
 jakevdp
on 20 Jul 2019
jakevdp
on 20 Jul 2019
Thank you so much Jake. When I try to add text on top of the cells it complains about Objects with "config" attribute cannot be used within LayerChart. Consider defining the config attribute in the LayerChart object instead.
heatmap = alt.Chart(df).mark_rect(cornerRadius=0).encode(
alt.Y('rows:O', axis=alt.Axis(title='Model')),
alt.X('bin:O', axis=alt.Axis(title='Score')),
alt.Color('score:Q', scale=alt.Scale(scheme='redblue'), legend=alt.Legend(title='%'))
).configure_scale(
rangeStep=100
)
# ).properties(
# width=1600,
# height=300
# )
# # Configure text
text = alt.Chart(df).mark_text(baseline='middle', color='black', size=15).encode(
y='rows:O',
x='bin:O',
text='score:Q'
)
# Draw the chart
chart = heatmap + text
display(chart)
Figured out from another answer of Jake:
chart = alt.layer(heatmap, text).configure_view(
stroke='transparent'
).configure_scale(
rangeStep=100
).configure_axis(
labelFontSize=16,
titleFontSize=16,
domainWidth=0.0
)
@jakevdp Is there the option to set the size of mark_rect for each cell individually?
This post demonstrates how much more clarity that can bring for visualising correlations.
I was expecting this to work in a similar way to color:
import altair as alt
import numpy as np
import pandas as pd
# Compute x^2 + y^2 across a 2D grid
x, y = np.meshgrid(range(-10, 10), range(-5, 5))
z = x ** 2 + y ** 2
# Convert this grid to columnar data expected by Altair
source = pd.DataFrame({'x': x.ravel(),
'y': y.ravel(),
'z': z.ravel()})
alt.Chart(source).mark_rect().encode(
x='x:O',
y='y:O',
color='z:Q',
size='z:Q'
).configure_scale(
rangeStep=10
)
 sbrugman
on 19 Sep 2020
sbrugman
on 19 Sep 2020
You can do this with mark_square() - this is akin to mark_point() and mark_circle() in that it generates points that can have a size encoding, whereas rect generates rectangles whose size is controlled by x,x2,y,y2 encodings:
import altair as alt
import numpy as np
import pandas as pd

# Compute x^2 + y^2 across a 2D grid
x, y = np.meshgrid(range(-10, 10), range(-5, 5))
z = x ** 2 + y ** 2

# Convert this grid to columnar data expected by Altair
source = pd.DataFrame({'x': x.ravel(),
                     'y': y.ravel(),
                     'z': z.ravel()})

alt.Chart(source).mark_square().encode(
    x='x:O',
    y='y:O',
    color='z:Q',
    size='z:Q'
)

jakevdp
on 19 Sep 2020
import altair as alt
import numpy as np
import pandas as pd

# Compute x^2 + y^2 across a 2D grid
x, y = np.meshgrid(range(-10, 10), range(-5, 5))
z = x ** 2 + y ** 2

# Convert this grid to columnar data expected by Altair
source = pd.DataFrame({'x': x.ravel(),
                     'y': y.ravel(),
                     'z': z.ravel()})

alt.Chart(source).mark_rect(size=5).encode(
    x='x:O',
    y='y:O',
    color='z:Q'
).configure_scale(
    rangeStep=10
)
This seems to have stopped working. I get
SchemaValidationError: Invalid specification

        altair.vegalite.v4.schema.core.ScaleConfig, validating 'additionalProperties'

        Additional properties are not allowed ('rangeStep' was unexpected)
 RoyalTS
on 30 Nov 2020
RoyalTS
on 30 Nov 2020
rangeStep was removed in Altair v4.0; see https://altair-viz.github.io/releases/changes.html#grammar-changes
jakevdp
on 30 Nov 2020
Related issues
 dyuval
·
34Comments
dyuval
·
34Comments
 lzamparo
·
39Comments
jakevdp
·
17Comments
lzamparo
·
39Comments
jakevdp
·
17Comments
 mattijn
·
23Comments
mattijn
·
23Comments
 mroswell
·
54Comments
mroswell
·
54Comments
Most helpful comment
You can do this with
mark_square()- this is akin tomark_point()andmark_circle()in that it generates points that can have a size encoding, whereasrectgenerates rectangles whose size is controlled by x,x2,y,y2 encodings: