Altair: Concatenated Charts Merging Legends, Resolution Methods
Hi, thanks for the fantastic library, I've really been enjoying learning it over the last week or so. I have a question re: chart concatenation, and legend resolution. I have a chart I've created following along at the Seattle Weather Interactive Tutorial.
For my example, I would like to have the legends for each chart separated and colored indepentently, even though they drive each other.
My code:
stopline = alt.Chart().mark_line(cursor='crosshair',strokeWidth=5.0, interpolate='basis').encode(
    x=alt.X('Month:T',timeUnit='yearmonth', axis=alt.Axis(title="Month", grid=False)),
    y=alt.Y('Instances', axis=alt.Axis(title='',grid=True)),
    color=alt.condition(click, color1, alt.value('lightgray'), axis=alt.Axis(title='Category'))
).interactive().properties(title='',
                          selection=brush,
                          width=700,
                          height=300).transform_filter(click.ref())


secondline = alt.Chart().mark_line(strokeWidth=5.0, interpolate='cardinal').encode(
    x=alt.X('Month:O',timeUnit='month', axis=alt.Axis(title='')),
    y=alt.Y('sum(Instances)', axis=alt.Axis(title='Total Instances')),
    color=alt.condition(click, color, alt.value('lightgray'), axis=alt.Axis(title='Year')),
).transform_filter(
    brush.ref()
).properties(
    width=700, height=300,
    selection=click
)

con = alt.vconcat(stopline, secondline,
    data=total,
    title="Title Here",
)

con
yields:
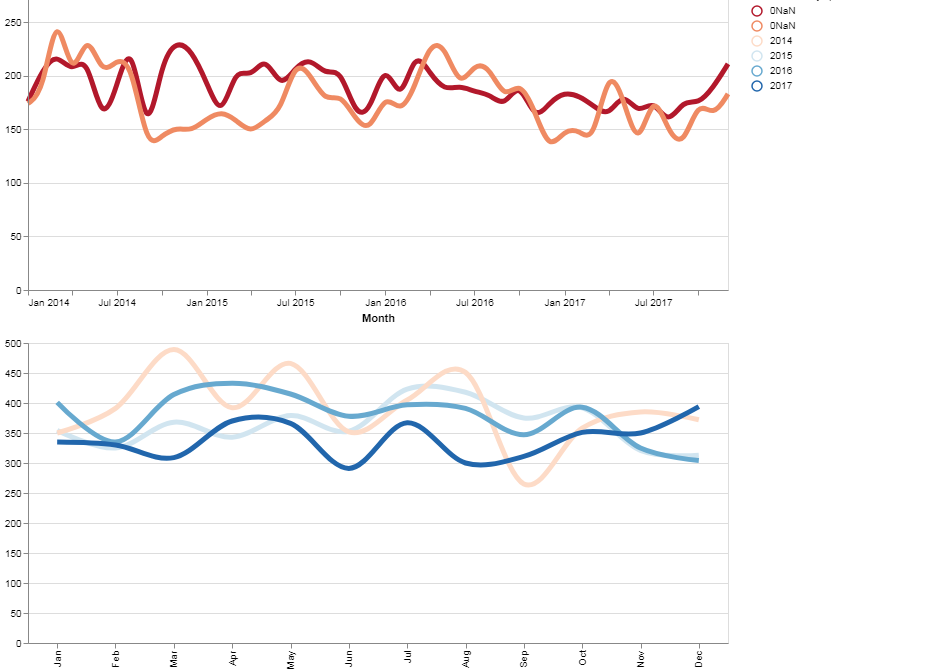
The 'Category' values in my upper chart legend have been replaced by an 'ONaN' value, instead of my 'Category:O' value, although they display correctly on the graph.
I've attempted using the below line in addition to my Chart concatenation block following the specs at VEGA Scale and Guide Resolution
resolve=alt.LegendResolveMap(color=alt.ResolveMode('independent'))
This gives me:
SchemaValidationError: Invalid specification

        altair.vegalite.v2.schema.channels.Color, validating 'additionalProperties'

        Additional properties are not allowed ('selection' was unexpected)
which seems to be due to the click selection property, but I'm unsure of how to account for this in my code. My goal would be to have each legend display next to its corresponding chart, on the basis of the color values represented on its lines.
Many thanks, in advance.
 jtbaker
All 3 comments
Not exactly sure about your intention... Can you provide the full code to reproduce the viz (like what is total and what is click )? Also, have you used legend=alt.legend() for the color encoding instead of axis=alt.axis()?
 pagpires
on 1 May 2018
pagpires
on 1 May 2018
Hi @jtbaker,
I came across the same issue - so thanks for the pointer on "resolve" and the Vega-Lite link.
I played around a bit, and I got this to work for my problem:
resolve = alt.Resolve(scale=alt.LegendResolveMap(color=alt.ResolveMode('independent')))
Hope this helps!
 ijlyttle
on 31 May 2018
ijlyttle
on 31 May 2018
Thanks @ijlyttle. I was having trouble with legend=None in only one of the charts (values would still show up in the concatenated legend) and this resolved the issue.
 gschivley
on 6 Jun 2018
gschivley
on 6 Jun 2018
Related issues
 fischcheng
·
4Comments
fischcheng
·
4Comments
 bmcfee
·
3Comments
bmcfee
·
3Comments
 DentonGentry
·
3Comments
DentonGentry
·
3Comments
 tonylee3399
·
3Comments
tonylee3399
·
3Comments
 nielsmde
·
4Comments
nielsmde
·
4Comments
Most helpful comment
Hi @jtbaker,
I came across the same issue - so thanks for the pointer on "resolve" and the Vega-Lite link.
I played around a bit, and I got this to work for my problem:
Hope this helps!