Altair: line chart with different point marker?
How can I give different lines a different type of point marker, say a cross (+) symbol? For example, the following chart with point=True will have data points as solid circle, but it won't work well when print black & white.
import altair as alt
from vega_datasets import data

source = data.stocks()

alt.Chart(source).mark_line(point=True).encode(
    x='date',
    y='price',
    color='symbol'
)
 python152
All 16 comments
Hi there,
Perhaps you could add the shape encoding.
alt.Chart(source).mark_line().encode(
x='date',
y='price',
color='symbol',
shape=alt.Shape('symbol', scale=alt.Scale(range=['cross', 'circle', 'square', 'triangle-right', 'diamond']))
)

 Alcampopiano
on 10 Apr 2019
Alcampopiano
on 10 Apr 2019
It is exactly what I am hoping for. thanks.
The default symbol size does seem small, alt.Shape doesn't seem to have any option to set it though, is there anyway to change it?
python152
on 10 Apr 2019
Hi there,
Just as you can specify a shape encoding, you can also specify a size encoding. You can find the Altair encoding options here in the docs.
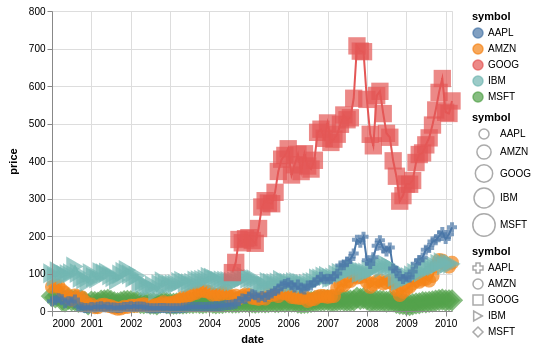
One way to have more control over the shapes, apart from the lines, is to use layers (docs here):
import altair as alt
from vega_datasets import data
source = data.stocks()
c=alt.Chart(source).encode(
x='date',
y='price',
color='symbol'
)
l=c.mark_line()
p=c.mark_point(filled=True).encode(
shape=alt.Shape('symbol', scale=alt.Scale(range=['cross', 'circle', 'square', 'triangle-right', 'diamond'])),
size=alt.Size('symbol', scale=alt.Scale(range=[100,500],domain=['AAPL', 'AMZN', 'GOOG', 'IBM', 'MSFT']))
)
l+p
Alcampopiano
on 11 Apr 2019
Hi there,
Perhaps you could add the shape encoding.
alt.Chart(source).mark_line().encode( x='date', y='price', color='symbol', shape=alt.Shape('symbol', scale=alt.Scale(range=['cross', 'circle', 'square', 'triangle-right', 'diamond'])) )
Is there a way to combine the two legends to include both the color and the shape in a single legend?
 cmartin-cay
on 30 Apr 2019
cmartin-cay
on 30 Apr 2019
For point charts, this kind of legend combination is done automatically:
import altair as alt
from vega_datasets import data
source = data.stocks()
alt.Chart(source).mark_point(filled=True).encode(
x='date',
y='price',
color='symbol',
shape='symbol'
)

The reason this doesn't happen for the line chart is because the color legend refers to the line itself.
 jakevdp
on 30 Apr 2019
jakevdp
on 30 Apr 2019
Thanks Jake. I saw that for the point chart and thought I was mostly finished with a little excel chart replacement project. But, people will want the legend to look like the above, but also have the lines.
I'll have to see what else I can find.
cmartin-cay
on 30 Apr 2019
@cmartin-cay
You might consider layering the points on top of the line chart.
Alcampopiano
on 30 Apr 2019
I'll have to see what else I can find.
OK, best of luck. Sorry Altair didn't work for you.
jakevdp
on 30 Apr 2019
Doing that brings me back to the initial situation where I have two separate legends. One with colors and one with shapes.
Maybe I can convince people that it's better this way :)
cmartin-cay
on 30 Apr 2019
You can get the result you want by carefully defining legends and scale resolution:
import altair as alt
from vega_datasets import data

source = data.stocks()

line = alt.Chart(source).mark_line().encode(
    x='date',
    y='price',
    color=alt.Color('symbol', legend=None)
)

points = line.mark_point(filled=True).encode(
    color='symbol',
    shape='symbol'
)

alt.layer(
    line,
    points
).resolve_scale(
    color='independent',
    shape='independent'
)

jakevdp
on 30 Apr 2019
I knew there was a way!
Alcampopiano
on 30 Apr 2019
All I can say is thank you very much.
cmartin-cay
on 30 Apr 2019
Is there any way to set the size of the points on a mark_line chart with the 'shape' encoding without overlaying a mark_line and a mark_point chart?
 TomBugnon
on 10 Oct 2019
TomBugnon
on 10 Oct 2019
Where can I find a menu of available shapes? (And thanks for the great thread!)
 JanetMatsen
on 20 Feb 2020
JanetMatsen
on 20 Feb 2020
Where can I find a menu of available shapes? (And thanks for the great thread!)
Hi Janet. This link to the Vega-Lite docs on the "point" mark may help.
Alcampopiano
on 20 Feb 2020
In Altair's docs, it's under shape here: https://altair-viz.github.io/user_guide/marks.html#mark-properties
jakevdp
on 20 Feb 2020
Related issues
 firasm
·
3Comments
firasm
·
3Comments
 pabloinsente
·
3Comments
pabloinsente
·
3Comments
 floringogianu
·
3Comments
floringogianu
·
3Comments
 dzonimn
·
3Comments
dzonimn
·
3Comments
 jtbaker
·
3Comments
jtbaker
·
3Comments
Most helpful comment
You can get the result you want by carefully defining legends and scale resolution: