Altair: Chart sizing through custom theme doesn't work
Hello Altair community,
I am trying to set the width and height of chart through theme setting, however it doesn't seem to be working. Am I setting the wrong keys or is this a bug? Please see below for detail:
# custom theme
def long_chart():
    return {
        'view': {
            'width'  : 500,
            'height' : 150
        }
    }
alt.themes.register('long_chart', long_chart)

with alt.themes.enable('long_chart'):
    chart1 = alt.Chart(population).mark_point().encode(
        x='year:O',
        y='sum(people)',
        color='sex:N'
    ).properties(
        title='Chart sizing thru custom theme'
    )

chart2 = alt.Chart(
    population,
    width=500,
    height=150).mark_point().encode(
    x='year:O',
    y='sum(people)',
    color='sex:N'
    ).properties(
    title='Chart sizing thru Chart()'
    )

chart1 | chart2

I was expecting chart1 to look exactly the same as chart2.
Looking at the json spec of chart1, it seems that the width and height is still the default value:
chart1.to_dict()
{'config': {'view': {'width': 400, 'height': 300}},
 'data': {'name': 'data-45e35b5faa42c7034b347e8bcfc8b805'},
 'mark': 'point',
 'encoding': {'color': {'type': 'nominal', 'field': 'sex'},
  'x': {'type': 'ordinal', 'field': 'year'},
  'y': {'type': 'quantitative', 'aggregate': 'sum', 'field': 'people'}},
 'title': 'Chart sizing thru custom theme',
 '$schema': 'https://vega.github.io/schema/vega-lite/v2.6.0.json',
 'datasets': {'data-45e35b5faa42c7034b347e8bcfc8b805': [{'age': 0,
    'people': 1483789,
    'sex': 1,
    'year': 1850},
   {'age': 0, 'people': 1450376, 'sex': 2, 'year': 1850},
...
 xujiboy
All 8 comments
Hi there,
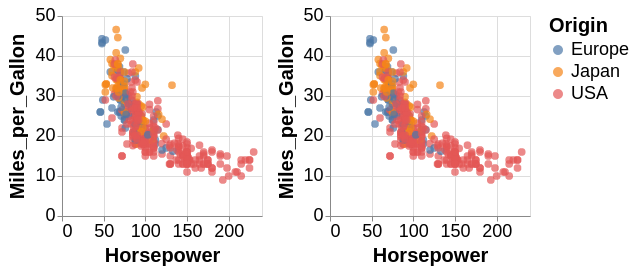
It may be possible that your theme dictionary is not set up quite right. This should work, where view is inside of config:
import pandas as pd
import altair as alt
from vega_datasets import data

def workshop_theme(*args, **kwargs):
    return {
            "config": {
              "view": {"width": 200, "height": 200},
              "title": {
                  'fontSize': 20
              },

              "legend": {
                "symbolSize": 100,
                "titleFontSize": 20,
                "labelFontSize": 18
              },
              "axis": {
                "titleFontSize": 20,
                "labelFontSize": 18
              }
            }
          }


themes.register('workshop_theme', workshop_theme)
themes.enable('workshop_theme');

cars = data.cars()

c = alt.Chart(cars).mark_circle(size=60).encode(
    x='Horsepower',
    y='Miles_per_Gallon',
    color='Origin',
    tooltip=['Name', 'Origin', 'Horsepower', 'Miles_per_Gallon']
)

c | c
 Alcampopiano
on 19 Nov 2018
Alcampopiano
on 19 Nov 2018
When exiting the context manager, the settings are reset, even for saved charts. I do not know if it is normal, but you can see it this way
import altair as alt
from vega_datasets import data
from pprint import pprint

population = data.population.url

def long_chart():
    return {
        'config': {
            'view': {
                'height': 150,
                'width': 500,
            },
        }
    }

alt.themes.register('long_chart', long_chart)
#> <function __main__.long_chart()>

with alt.themes.enable('long_chart'):
    chart1 = alt.Chart(population).mark_point().encode(
        x='year:O',
        y='sum(people):Q',
        color='sex:N'
    ).properties(
        title='Chart sizing thru custom theme'
    )
    print('Inside of the context manager')
    pprint(chart1.to_dict())
#> Inside of the context manager
#> {'$schema': 'https://vega.github.io/schema/vega-lite/v2.6.0.json',
#>  'config': {'view': {'height': 150, 'width': 500}},
#>  'data': {'url': 'https://vega.github.io/vega-datasets/data/population.json'},
#>  'encoding': {'color': {'field': 'sex', 'type': 'nominal'},
#>               'x': {'field': 'year', 'type': 'ordinal'},
#>               'y': {'aggregate': 'sum',
#>                     'field': 'people',
#>                     'type': 'quantitative'}},
#>  'mark': 'point',
#>  'title': 'Chart sizing thru custom theme'}

print('Oustide of the context manager')
#> Oustide of the context manager
pprint(chart1.to_dict())
#> {'$schema': 'https://vega.github.io/schema/vega-lite/v2.6.0.json',
#>  'config': {'view': {'height': 300, 'width': 400}},
#>  'data': {'url': 'https://vega.github.io/vega-datasets/data/population.json'},
#>  'encoding': {'color': {'field': 'sex', 'type': 'nominal'},
#>               'x': {'field': 'year', 'type': 'ordinal'},
#>               'y': {'aggregate': 'sum',
#>                     'field': 'people',
#>                     'type': 'quantitative'}},
#>  'mark': 'point',
#>  'title': 'Chart sizing thru custom theme'}
Created on 2018-11-19 by the reprexpy package
 FlorianGD
on 19 Nov 2018
FlorianGD
on 19 Nov 2018
Hi there. The context manager for changing the renderer is only applied at the final rendering. So, because you do chart1 | chart2 outside the context manager, it is not being applied.
 jakevdp
on 19 Nov 2018
jakevdp
on 19 Nov 2018
If you want your context manager to be applied when displaying the chart in your example above, you can do this:
with alt.themes.enable('long_chart'):
   (chart1 | chart2).display()
And note that themes, and configuration settings in general, can only be applied to top-level charts. There is no way in Vega-Lite to set different global configuration options for different sub-charts.
jakevdp
on 19 Nov 2018
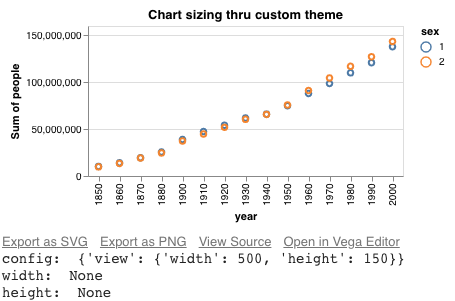
@Alcampopiano Thank you very much for pointing that out. I was defining the theme wrongly. And I also greatly appreciate the insights from @FlorianGD and @jakevdp. I understand now that chart sizing thru Chart( ) provides a per-chart-instance control while theme application offers a top-level governance. However, it is still kinda unclear to me why the two following examples renders differently:
alt.themes.enable('long_chart') # apply custom theme
chart = alt.Chart(population).mark_point().encode(
    x='year:O',
    y='sum(people)',
    color='sex:N'
).properties(
    title='Chart sizing thru custom theme'
)
chart.display()
for key in ('config','width','height'):
  print(key+': ', chart.to_dict().get(key))
which leads to:
while this one:
alt.themes.enable('default') # theme reset
chart = alt.Chart(
    population,
    width=500,
    height=150).mark_point().encode(
    x='year:O',
    y='sum(people)',
    color='sex:N'
    ).properties(
    title='Chart sizing thru Chart()'
    )
chart.display()
for key in ('config','width','height'):
  print(key+': ', chart.to_dict().get(key))
leads to:
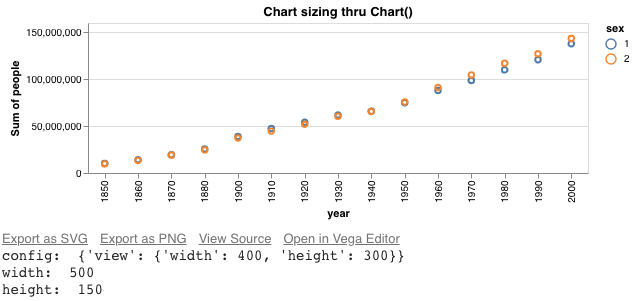
It seems that there are definable width and height keys in both the config: view and the root. And the current behaviour looks like this: if they are defined at the root level of the json spec then then the chart is resized accordingly; otherwise if they are defined at the config: view level then only the height is resized accordingly. Apparently I can just live with sizing chart in Chart( ), but I would also love to understand the rendering behaviour when sizing using theme. For your convenience I posted a Colab notebook here containing the same code.
xujiboy
on 20 Nov 2018
I think the main thing to be aware of is that many chart properties can be defined in multiple places. This is discussed in the docs in a slightly different context under Global Config vs. Local Config vs. Encoding.
Think of the config/theme as a set of defaults settings, which can be overridden by specifying different values within the chart configuration. So, for example, config.view allows you to specify a default width and height, but those defaults can be overridden by specifying the width and height in the chart properties.
jakevdp
on 20 Nov 2018
Thank you very much @jakevdp for the explanation and providing the reference.
xujiboy
on 21 Nov 2018
Related issues
 XaviFar
·
19Comments
XaviFar
·
19Comments
 dyuval
·
34Comments
dyuval
·
34Comments
 HalukaMB
·
31Comments
HalukaMB
·
31Comments
 mroswell
·
54Comments
mroswell
·
54Comments
 pagpires
·
21Comments
pagpires
·
21Comments