Altair: JupyterLab - Browser crashes on large dataset even when passing data by URL
I have a dataset with ~ 100K records in it. I'm currently storing the dataset as a json file and passing the url reference to altair to plot within Jupyter Lab. The first time executing the code renders the graph properly, but attempting to plot the same data again causes the browser to crash. It would seems as if the json data is still being embedded in the page and the second time plotting can't handle that amount of data. Increasing the size of the data causes the browser to crash on the first attempt plotting.
Here is the code I'm using that causes this problem:
Export data to json
data_export = 'notebooks/json.json'
df.to_json(path_or_buf=data_export, orient='records')Obtain data URL reference
Get string URL in Jupyter Lab by right clicking and selecting 'Copy Shareable Link' then removing '/lab'
data_url = 'http://localhost:8888tree/notebooks%json.json'
Chart data with url reference
alt.Chart(data_url, height=300, width=300).mark_bar().encode(
alt.X('X:Q', bin=True),
alt.Y('count()'),
alt.Color('sum(Z):Q')
).transform_filter((alt.datum['X'] < 100000)
).interactive()
Any idea what's going on and how to fix this? I appreciate the help and those developing Altair as I really utilizing it.
 safurrier
All 11 comments
One of the biggest issues with Vega/Vega-Lite is that they tend to choke on larger datasets. Perhaps @jheer, @kanitw, @domoritz have suggestions?
 jakevdp
on 9 Jul 2018
jakevdp
on 9 Jul 2018
@safurrier Can you try to add a sample transform or an aggregation to restrict the number of marks that get rendered? I'd like to know whether this is an issue with Vega or with JupyterLab.
Note that we are working on an integration of Arrow into Vega, which will help mitigate some of these issues. @saba9 in our lab is also working on moving preprocessing of the data to the kernel so it doesn't have to run in the browser. Scalability is an important issue but it's not straightforward and we thank you for your patience.
 domoritz
on 9 Jul 2018
domoritz
on 9 Jul 2018
@domoritz is this along the lines of what you mean? I limited the number of bins to 5 and filtered based on a percentile of the X variable. The filter should have cut down the data to about 2k records as opposed to 100k.
alt.Chart(data_url, height=300, width=300).mark_bar().encode(
alt.X('X:Q', bin=alt.Bin(maxbins=5)),
alt.Y('count()'),
alt.Color('sum(Z):Q')
).transform_filter((alt.datum['percentile_x'] > .98)).interactive()
Plotting the above crashes the web browser.
If this is not what you meant I'd be happy to try again. Thanks for the help and I very much appreciate the work you all do on Altair and Vega.
safurrier
on 9 Jul 2018
Hm, since you are already binning, the chart should only have a few bars (can you send a screenshot). If you could share a notebook that demonstrates the issue (with generated data preferrably), we can look into it.
domoritz
on 10 Jul 2018
I've recreated a similar dataset to the one I'm using, populated mostly with fake data. I'm guessing it's a bit lighter weight than the original as the text columns are one character samples from the english alphabet rather than some text heavy columns in the original set. Working in Jupyter Lab 0.32.1 the transform_filter from before now works when plotting under ~35k records. Anything over that leads to a similar problem with the browser crashing.
Here's a link to a folder with the sample data, exported json file in a subdirectory and a sample notebook with the plotting code that causes the browser to crash. Hope that helps.
https://www.dropbox.com/sh/lkwbrjv7nlp3u9f/AAA53cFQH-0Th6hY-VXbNAfwa?dl=0
safurrier
on 10 Jul 2018
@saba9, can you look into this?
domoritz
on 10 Jul 2018
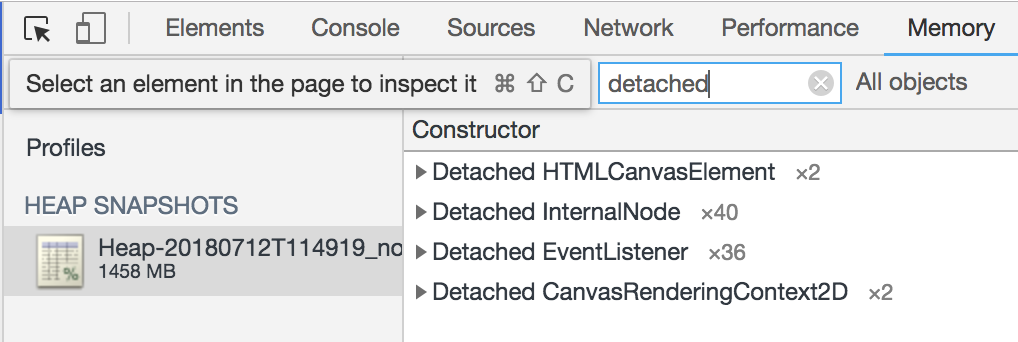
It looks like this issue is occurring because the event listeners attached to the interactive Vega chart persist resulting in the DOM elements containing the chart to remain in memory. If you try rendering the chart without the call to interactive() this issue doesn't occur. The fix to this problem is calling finalize() on the chart's vega-view in JS.
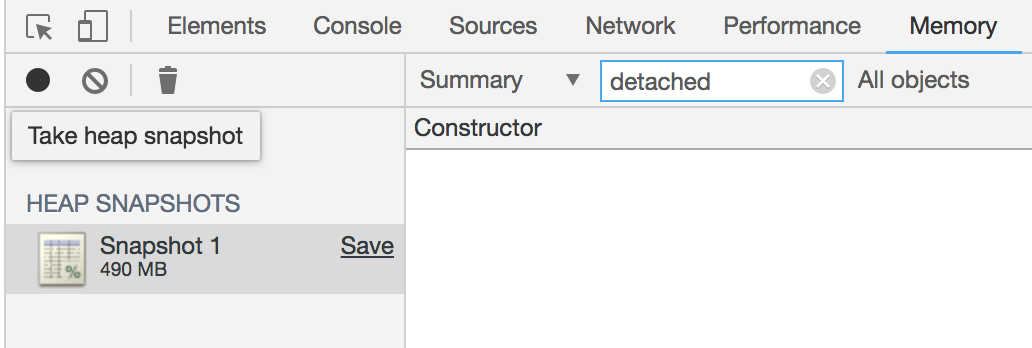
The first image below shows both the memory usage and number of detached elements after rendering the chart 3 times. The second one shows memory usage and a lack of detached elements after rendering the chart three times and calling finalize after each call.
 Saba9
on 12 Jul 2018
Saba9
on 12 Jul 2018
Thanks for checking that out... since this is JupyterLab, I believe the relevant JS call is here: https://github.com/jupyterlab/jupyterlab/blob/afedbf9e6f00d12723b142a3e87729e9ed60b994/packages/vega4-extension/src/index.ts
jakevdp
on 12 Jul 2018
We have to call finalize when the cell gets detached. We should apply this fix to jupyterlab and ipyvega.
domoritz
on 12 Jul 2018
I filed issues with Jupyterlab and ipyvgea. Let me know if you have a suggestion.
domoritz
on 14 Jul 2018
Fixed in jupyterlab.
domoritz
on 15 Jul 2018
Related issues
 dyuval
·
34Comments
dyuval
·
34Comments
 choldgraf
·
20Comments
jakevdp
·
34Comments
choldgraf
·
20Comments
jakevdp
·
34Comments
 lzamparo
·
39Comments
jakevdp
·
36Comments
lzamparo
·
39Comments
jakevdp
·
36Comments
Most helpful comment
It looks like this issue is occurring because the event listeners attached to the interactive Vega chart persist resulting in the DOM elements containing the chart to remain in memory. If you try rendering the chart without the call to
interactive()this issue doesn't occur. The fix to this problem is callingfinalize()on the chart's vega-view in JS.The first image below shows both the memory usage and number of detached elements after rendering the chart 3 times. The second one shows memory usage and a lack of detached elements after rendering the chart three times and calling finalize after each call.