Is there a way to create a dashed line plot?
Thanks
 biotemon
All 7 comments
Try mark_line(strokeDash=[1,1])
 kanitw
on 16 May 2018
kanitw
on 16 May 2018
Thank you!
biotemon
on 16 May 2018
It would be worth adding a note in https://altair-viz.github.io/user_guide/customization.html about this.
 jakevdp
on 16 May 2018
jakevdp
on 16 May 2018
About this topic. I couldn't do it with mark_line. Instead, I used mark_rule. I wrote the lines below
rule1 = alt.Chart(filt_df).mark_rule(color='black',strokeDash=[3,5]).encode(
alt.YValue(35.0),
size=alt.value(2))
I wanted the dashed line to be at position 80 (0~100 yaxis), but I had to type _35_ to get the wanted pos. How could I do it right? I also tried alt.Y(80), but it doesn't accept int/float. Plus, is there a way to get this rule legend? (ie: dashed line '---' = meaning)?
 LiviaMoura
on 4 Aug 2018
LiviaMoura
on 4 Aug 2018
I have the following code to make a chart:
base = alt.Chart(adsdmg_no_2020).encode(
    alt.X('yearmonth(Date):O',
    )
)
bar = base.mark_bar().encode(
    y='Months',color='dummy:O',
)
line =  base.mark_line(color='green').encode(
    y=alt.Y('UCSs (Total) (Units):Q',axis=alt.Axis(tickCount=0,title='Units',
)),
)
line2 =  base.mark_line(color='dummy:O').encode(
    y=alt.Y('USTUs (Units):Q', axis=alt.Axis(tickCount=10,title='',                                                                                      ))

)
alt.layer(
    bar,
    line,
    line2
    ).resolve_scale(
    y='independent'
)
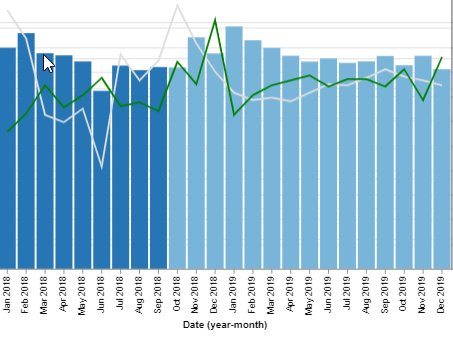
How would I adjust this to make each line a different color and create dashes only on the part of the line where the dummy variable is equal to one? Like how the bars are opaque for future values, I want to make the line dashed for future values.
 aawalker9
on 22 Oct 2018
aawalker9
on 22 Oct 2018
it appears .mark_line(strokeDash=[1,1]) doesn't give a dashed line in the legend.... or am I missing something.
 kayarre
on 18 Nov 2019
kayarre
on 18 Nov 2019
Altair 4.1 added the strokedash encoding; see an example here: https://altair-viz.github.io/gallery/multi_series_line.html
jakevdp
on 13 Apr 2020
Related issues
 galloramiro
·
3Comments
galloramiro
·
3Comments
 DentonGentry
·
3Comments
DentonGentry
·
3Comments
 jtbaker
·
3Comments
jtbaker
·
3Comments
 SuperShinyEyes
·
3Comments
SuperShinyEyes
·
3Comments
 zanarmstrong
·
4Comments
zanarmstrong
·
4Comments
Most helpful comment
Try
mark_line(strokeDash=[1,1])