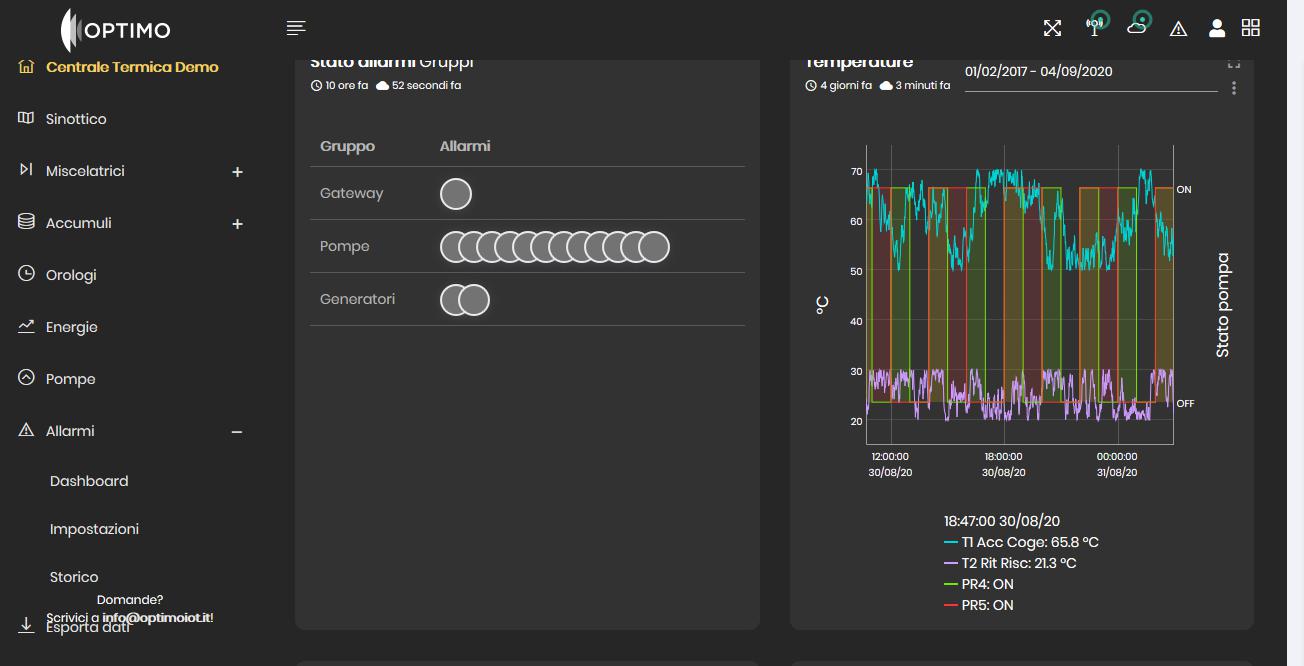
Web-bugs: demo.optimoiot.it - Unable to zoom on "Temperature" graph
URL: https://demo.optimoiot.it/dashboard/main
Browser / Version: Firefox 80.0
Operating System: Windows 10
Tested Another Browser: Yes Edge
Problem type: Site is not usable
Description: Buttons or links not working
Steps to Reproduce:
Move the mouse over the chart "Temperature". The mouse icone chnages to hand (and this is ok).
This should enable the zoom functionality using the mouse wheel, but this doesn't happen.
If you scroll the wheel, the page is scrolled up and down.
Maybe the chart doesn't take the focus?
View the screenshot
Browser Configuration
- None
_From webcompat.com with ❤️_
 escherstair
All 7 comments
Thanks for the report @escherstair , I was to reproduce the issue.
Tested with:
Browser / Version: Firefox Nightly 82.0a1 (2020-09-02)
Operating System: Windows 10 Pro
Moving to Needsdiagnosis for further investigation.
 softvision-oana-arbuzov
on 4 Sep 2020
softvision-oana-arbuzov
on 4 Sep 2020
The chart is a couple of canvas elements and div.
<div _ngcontent-esd-c12="" class="chart">
  <div style="text-align: left; position: relative; width: 490px; height: 320px;">
    <canvas style="position: absolute; width: 490px; height: 320px;" width="980" height="640"></canvas>
    <canvas style="position: absolute; width: 490px; height: 320px;/*! display: none; */" width="980" height="640"></canvas>
    <input type="text" style="display: none; top: 275px; left: 57px;" class="dygraph-roller" size="2">
    <div style="position: absolute; left: 0px; top: 0px; width: 0px; height: 320px; font-size: 16px;">
      <div style="position: absolute; width: 320px; height: 0px; top: 160px; left: -160px;" class="dygraph-label-rotate-right">
        <div class="dygraph-label dygraph-ylabel">°C</div>
      </div>
    </div>
    <div style="position: absolute; left: 485px; top: 0px; width: 0px; height: 320px; font-size: 16px;">
      <div style="position: absolute; width: 320px; height: 0px; top: 160px; left: -160px;" class="dygraph-label-rotate-left">
        <div class="dygraph-label dygraph-y2label">Stato pompa</div>
      </div>
    </div>
    <div class="dygraph-legend" style="left: 428px; top: 0px; display: none;"></div>
    <div style="position: absolute; font-size: 14px; width: 50px; top: 274.514px; left: 3px; text-align: right;">
      <div class="dygraph-axis-label dygraph-axis-label-y dygraph-axis-label-y1">25</div>
    </div>
    <div style="position: absolute; font-size: 14px; width: 50px; top: 231.661px; left: 3px; text-align: right;">
      <div class="dygraph-axis-label dygraph-axis-label-y dygraph-axis-label-y1">30</div>
    </div>
    <div style="position: absolute; font-size: 14px; width: 50px; top: 188.809px; left: 3px; text-align: right;">
      <div class="dygraph-axis-label dygraph-axis-label-y dygraph-axis-label-y1">35</div>
    </div>
    <div style="position: absolute; font-size: 14px; width: 50px; top: 145.957px; left: 3px; text-align: right;">
      <div class="dygraph-axis-label dygraph-axis-label-y dygraph-axis-label-y1">40</div>
    </div>
    <div style="position: absolute; font-size: 14px; width: 50px; top: 103.105px; left: 3px; text-align: right;">
      <div class="dygraph-axis-label dygraph-axis-label-y dygraph-axis-label-y1">45</div>
    </div>
    <div style="position: absolute; font-size: 14px; width: 50px; top: 60.2523px; left: 3px; text-align: right;">
      <div class="dygraph-axis-label dygraph-axis-label-y dygraph-axis-label-y1">50</div>
    </div>
    <div style="position: absolute; font-size: 14px; width: 50px; top: 17.4001px; left: 3px; text-align: right;">
      <div class="dygraph-axis-label dygraph-axis-label-y dygraph-axis-label-y1">55</div>
    </div>
    <div style="position: absolute; font-size: 14px; width: 50px; top: 35.8571px; left: 432px; text-align: left;">
      <div class="dygraph-axis-label dygraph-axis-label-y dygraph-axis-label-y2">ON</div>
    </div>
    <div style="position: absolute; font-size: 14px; width: 50px; top: 250.143px; left: 432px; text-align: left;">
      <div class="dygraph-axis-label dygraph-axis-label-y dygraph-axis-label-y2">OFF</div>
    </div>
    <div style="position: absolute; font-size: 14px; width: 60px; text-align: center; top: 303px; left: 79.2857px;">
      <div class="dygraph-axis-label dygraph-axis-label-x">10:56:00
        <br>07/09/20</div>
    </div>
    <div style="position: absolute; font-size: 14px; width: 60px; text-align: center; top: 303px; left: 185.857px;">
      <div class="dygraph-axis-label dygraph-axis-label-x">10:58:00
        <br>07/09/20</div>
    </div>
    <div style="position: absolute; font-size: 14px; width: 60px; text-align: center; top: 303px; left: 292.429px;">
      <div class="dygraph-axis-label dygraph-axis-label-x">11:00:00
        <br>07/09/20</div>
    </div>
  </div>
</div>
The graph is receiving pointermove, mousemove events, but no WheelEvent. The scroll event is attached to the Window.
This should happen here
https://demo.optimoiot.it/polyfills-es2015.75ac7b001e63ab3dbf48.js
                  , y = function(t) {
                    if (!(t = t || e.event))
                        return;
which eventually calls
                mousewheel: function(e, n, i) {
                    var r = (e.detail ? -1 * e.detail : e.wheelDelta / 40) / 50;
                    e.offsetX && e.offsetY || (e.offsetX = e.layerX - e.target.offsetLeft,
                    e.offsetY = e.layerY - e.target.offsetTop);
…
https://demo.optimoiot.it/8-es2015.a1eccc77cd271765199f.js
but it's not being called in Firefox. @wisniewskit an idea?
 karlcow
on 7 Sep 2020
karlcow
on 7 Sep 2020
I think the canvas element is not receiving the wheel event since mousewheel is not supported in Firefox and considered non standard , which is https://bugzilla.mozilla.org/show_bug.cgi?id=1529953. The site should use wheel instead to make it work in all browsers.
 ksy36
on 8 Sep 2020
ksy36
on 8 Sep 2020
OOOOh thanks @ksy36 🙈 rubbing my eyes about mousewheel.
karlcow
on 9 Sep 2020
Thank you for your investigation.
The graph has been changed and now the zoom works in firefox too.
escherstair
on 9 Sep 2020
thanks!
karlcow
on 10 Sep 2020
I can confirm it is fixed.
Tested with:
Browser / Version: Firefox Nightly 82.0a1 (2020-09-14)
Operating System: Windows 10 Pro
softvision-oana-arbuzov
on 15 Sep 2020
Related issues
 Ezio916
·
4Comments
Ezio916
·
4Comments
 bvanrijn
·
4Comments
bvanrijn
·
4Comments
 scheinercc
·
6Comments
scheinercc
·
6Comments
 oksas
·
5Comments
oksas
·
5Comments
 halwane050
·
5Comments
halwane050
·
5Comments
Most helpful comment
Thank you for your investigation.
The graph has been changed and now the zoom works in firefox too.