Victory: VictoryTooltip doesn't work when used as a labelComponent for VictoryScatter and is overlapped
I am using VictoryTooltip as a label component for VictoryScatter. Both the components are grouped with VictoryArea having strokes and fillOpacity of 0.4. Some data points (scatter points) are getting overlapped in my chart and VictoryTooltip is not getting rendered at such points. I have tried using CSS properties like z-index and svg properties to manipulate the behaviour. Didn't work! Help requested.
Attaching the screenshot of my chart:
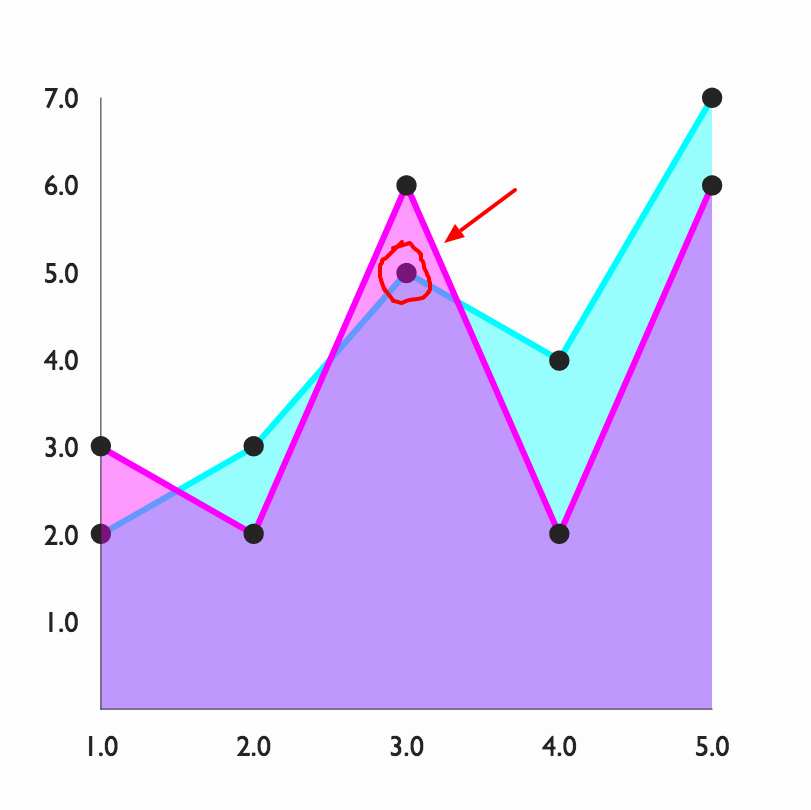
Here is the link of reproduced problem: https://codesandbox.io/s/qYAmYBjz2
 omkar-joshi
>All comments
@omkarjoshi-cc unfortunately there's no concept of z-index for svg. There are a couple options:
1) Wrap your dataComponent in VictoryPortal which will cause each of those elements to be rendered in a top level portal. You would want to do this to your points in VictoryScatter in your scenario, so something like VictoryScatter dataComponent={<VictoryPortal><Point/></VictoryPortal>} ...
2) Use VictoryVoronoiContainer to trigger your tooltips rather than attaching them to individual elements. You can read more about voronoi tooltips here: https://formidable.com/open-source/victory/guides/tooltips#tooltips-with-victoryvoronoicontainer
 boygirl
on 27 Jul 2017
boygirl
on 27 Jul 2017
Related issues
 jotak
·
4Comments
jotak
·
4Comments
 esutton
·
6Comments
esutton
·
6Comments
 michowski
·
4Comments
michowski
·
4Comments
 robinwkurtz
·
3Comments
robinwkurtz
·
3Comments
 captDaylight
·
5Comments
captDaylight
·
5Comments
Most helpful comment
@omkarjoshi-cc unfortunately there's no concept of z-index for svg. There are a couple options:
1) Wrap your
dataComponentinVictoryPortalwhich will cause each of those elements to be rendered in a top level portal. You would want to do this to your points inVictoryScatterin your scenario, so something likeVictoryScatter dataComponent={<VictoryPortal><Point/></VictoryPortal>} ...2) Use
VictoryVoronoiContainerto trigger your tooltips rather than attaching them to individual elements. You can read more about voronoi tooltips here: https://formidable.com/open-source/victory/guides/tooltips#tooltips-with-victoryvoronoicontainer