Victory: Adding styling to grid of axis
Bugs and Questions
Checklist
[x] This is not a
victory-nativespecific issue. (Issues that only appear invictory-nativeshould be opened here)[x] I have read through the FAQ and Guides before asking a question
[x] I am using the latest version of Victory
[x] I've searched open issues to make sure I'm not opening a duplicate issue
Question
Not a problem, just a question.
I'm looking to add a background colour the columns of my grid, so the space between axis grid strokes. I want do a simple gray/white repeat but I am unable to see how to do so.
Some broken solutions are to use VictoryBar (However knowing the ratio based on my data is not something I am able to wrap my head around... it almost seems inconsistant as my data changes). Or using VictoryArea based on my tick locations (However I don't see how to access such information)
Another thing I am struggling with when styling my elements I don't always have the same information to compare to... is there any documentation on this that I may have overlooked? i.e VictoryBar.data gives me access to the whole object which includes eventKey as an index. Where as VictoryAxis.grid only gives me access to the tick's value which when it's a dynamic date is a little harder to compare with.
Thanks!
 robinwkurtz
All 3 comments
I have a similar use case, wanting to color the area between grid markers, e.g.:
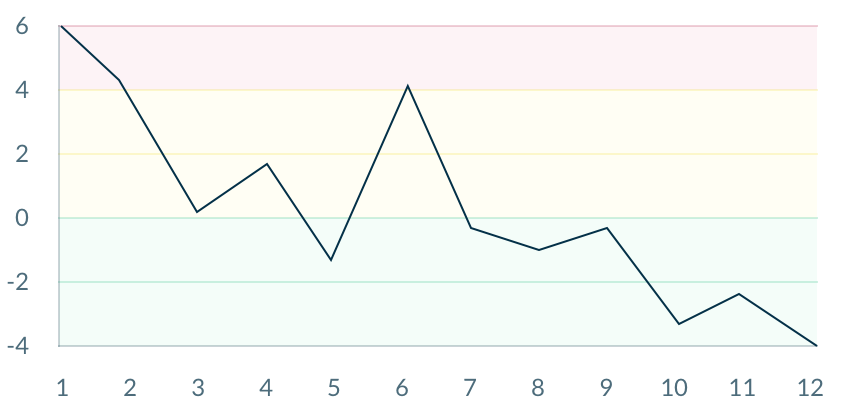
Coloring the grid lines conditionally is easy since grid accepts a functional style, but there seems to be no way to color the area in between grid lines. Is there?
 bewildergeist
on 13 Nov 2018
bewildergeist
on 13 Nov 2018
Is there any solution to the problem by now?
Because i would like to do the same thing and i could not find any so far.
 artur-ott
on 1 Apr 2019
artur-ott
on 1 Apr 2019
@artur-ott I solved my above use case with a combination of conditional grid line styles on the Y axis and three different <VictoryArea /> elements (green, yellow, red) placed behind (i.e. before in the source code) the <VictoryAxis /> and <VictoryLine /> elements. All styled by some predefined thresholds.
So for the Y axis:
<VictoryAxis
  dependentAxis
  style={{
    grid: {
      stroke: d => {
        if (!points) {
          return 'none'
        } else if (!thresholds) {
          return '#ccc'
        } else if (
          d > thresholds.find(t => t.name === 'alert').fromValue
        ) {
          return THRESHOLD_COLORS.alert.stroke
        } else if (
          d > thresholds.find(t => t.name === 'warning').fromValue
        ) {
          return THRESHOLD_COLORS.warning.stroke
        } else {
          return THRESHOLD_COLORS.ok.stroke
        }
      },
    }}}
/>
And for the areas between grid lines (where fromDate and toDate are the beginning and ending X axis values of my data set):
{thresholds.map(({ fromValue, toValue, name }) => {
  return (
    <VictoryArea
      key={name}
      data={[
        {
          x: fromDate,
          y0: fromValue,
          y: toValue,
        },
        {
          x: toDate,
          y0: fromValue,
          y: toValue,
        },
      ]}
      style={{
        data: {
          fill: get(THRESHOLD_COLORS, [name, 'fill'], 'none'),
        },
      }}
    />
  )
})}
Related issues
 nicmesan
·
6Comments
nicmesan
·
6Comments
 MrHen
·
3Comments
MrHen
·
3Comments
 purplecones
·
3Comments
purplecones
·
3Comments
 seddonm1
·
5Comments
seddonm1
·
5Comments
 danielberndt
·
4Comments
danielberndt
·
4Comments
Most helpful comment
@artur-ott I solved my above use case with a combination of conditional grid line styles on the Y axis and three different
<VictoryArea />elements (green, yellow, red) placed behind (i.e. before in the source code) the<VictoryAxis />and<VictoryLine />elements. All styled by some predefined thresholds.So for the Y axis:
And for the areas between grid lines (where
fromDateandtoDateare the beginning and ending X axis values of my data set):